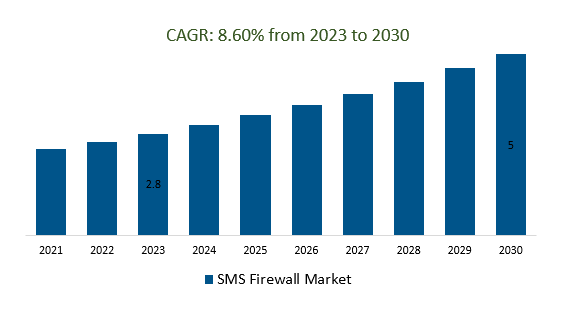
The global SMS Firewall Market Size is estimated to be US$ 2.8 Billion in 2023 and is poised to register 8.6%​​​​​​ growth over the forecast period from 2023 to 2030 to reach US $ 5 billion in 2030.
The market growth is driven predominantly by the increasing use of mobile devices and messaging apps has led to a surge in SMS and A2P (Application-to-Person) messaging traffic. This growth has also attracted the attention of spammers and fraudsters, driving the need for SMS firewalls to prevent unauthorized messaging and spam. Leading companies focusing on AI and Machine Learning Integration, Behavioral Analytics, IoT Security, 5G Integration, Rich Communication Services (RCS), Global Regulatory Changes, Multi-Channel Protection, User Education and Awareness, and others to boost market shares in the industry.
Market Overview
The SMS Firewall market was a growing sector within cybersecurity and mobile communication. SMS firewalls are security solutions that safeguard mobile networks and users from threats like spam and fraud by monitoring and filtering SMS traffic. Driven by rising mobile messaging usage, increased threats, and regulatory compliance needs, the market saw players like AdaptiveMobile Security and BICS providing functionalities like traffic monitoring, message filtering, and anti-fraud measures. Challenges included adapting to evolving threats and balancing accuracy with false positives. As mobile usage and threats continued to evolve, SMS firewalls played a crucial role in securing messaging communication.
Market Dynamics
Market Trends- Companies are launching Machine Learning and AI to attract a consumer base
Machine Learning (ML) and Artificial Intelligence (AI) have significantly advanced the SMS Firewall market by enabling real-time threat detection, adaptive learning, reduced false positives, and contextual analysis. These technologies empower SMS firewalls to recognize evolving and sophisticated SMS-based threats, identify anomalies, optimize resource allocation, and automate responses. ML and AI enhance the accuracy and efficiency of SMS firewalls, making them dynamic and intelligent safeguards against diverse risks in mobile messaging.
Market Driver- Cloud-based Solutions demand for efficient SMS Firewall Market
Cloud-based solutions have brought transformative benefits to the SMS Firewall market, revolutionizing how mobile networks and users are protected from SMS-based threats. By leveraging the cloud, SMS firewalls gain scalability, flexibility, and real-time responsiveness. Cloud-based SMS firewalls can handle fluctuating messaging traffic volumes effectively and offer rapid deployment, enabling organizations to quickly adapt to evolving threat landscapes. These solutions offer centralized management and updates, streamlining maintenance processes. Moreover, cloud infrastructure enhances collaboration and threat intelligence sharing among different entities. As the SMS Firewall market evolves, cloud-based solutions are poised to continue playing a pivotal role in providing robust, adaptable, and collaborative protection against SMS-related risks.
Market Opportunity-Introduction of Real-time Monitoring and Analysis
Real-time monitoring and analysis are critical components driving innovation within the SMS Firewall market. By constantly analyzing incoming and outgoing SMS traffic in real-time, SMS firewalls can swiftly identify and respond to emerging threats, such as spam, phishing, and fraud. This proactive approach allows for immediate detection of anomalies, patterns, and suspicious behaviors, enabling timely countermeasures. Real-time analysis also empowers SMS firewalls to adapt rapidly to changing attack techniques, enhancing their accuracy and effectiveness. By providing a dynamic and responsive defense mechanism, real-time monitoring and analysis are essential in maintaining the security and integrity of mobile messaging networks in the evolving threat landscape.
Market Share Analysis- SMS firewall platform SMS Firewall Market will register the fastest growth
The global SMS Firewall Market is analyzed across SMS firewall Platforms, Services, and others. Of these, the SMS firewall platform is poised to register the fastest growth. An SMS firewall platform is a comprehensive solution within the SMS Firewall market designed to provide robust security and management for mobile messaging traffic. It encompasses a range of functionalities and tools aimed at protecting mobile networks and users from various SMS-based threats while ensuring regulatory compliance and optimal communication quality. The SMS firewall platform typically includes features such as real-time monitoring, content filtering, anti-fraud mechanisms, reporting and analytics, user behavior analysis, and integration with threat intelligence feeds. This platform enables mobile network operators and enterprises to manage and secure their messaging traffic effectively, detect and mitigate risks in real time, and maintain the integrity of their messaging services, contributing to a safer and more reliable mobile messaging ecosystem.
Market Share Analysis- BFSI, IT, and Telecom held a significant market share in 2023
The global SMS Firewall Market is analyzed across a wide range of end users including BFSI, IT and Telecom, Retail and E-Commerce, Healthcare, Media and Entertainment, Government and Public Sector, and Others. Of these, BFSI, IT, and Telecom held a significant market share in 2023. The SMS Firewall market holds substantial importance in BFSI, IT, and Telecom sectors. In BFSI, SMS firewalls ensure secure mobile banking and transactions, while in IT, they safeguard sensitive communications and data. In Telecom, SMS firewalls are integral to network security, preventing spam and fraudulent messages. These solutions uphold regulatory compliance, data protection, and customer trust, playing a pivotal role in creating secure mobile messaging environments within these industries.
SMS Firewall Market Segmentation
By Component
- SMS firewall Platform
- Services
By SMS Type
- Application-to-Person (A2P) messages
- Person-to-Application (P2A) messages
By SMS Traffic
- National SMS traffic
- International SMS traffic
By Deployment Mode
By End User
- BFSI, IT, and Telecom
- Retail and E-Commerce
- Healthcare
- Media and Entertainment
- Government and Public Sector
- Others
By Region
- North America (United States, Canada, Mexico)
- Europe (Germany, France, United Kingdom, Spain, Italy, Others)
- Asia Pacific (China, India, Japan, South Korea, Australia, Others)
- Latin America (Brazil, Argentina, Others)
- Middle East and Africa (Saudi Arabia, UAE, Kuwait, Other Middle East, South Africa, Nigeria, Other Africa)
SMS Firewall Market companies
- Mobileum India Pvt Ltd
- AdaptiveMobile Security
- Monty Mobile
- Comviva
- Mob ileum
- BICS
- ANAM Technologies
- Infobip Ltd
- Enghouse Networks
- Route Mobile Limited
- HAUD Systems
- Proofpoint Inc
- Net Number Inc
- Global Wavenet
- AMD Telecom S.A.
- Tango Telecom Limited
- SAP SE
- Tata Communications
- Syniverse Technologies LLC
- 6d Technologies
- Cellusys
- Broadnet Technologies
- TWILIO INC
- Openmind Networks
* List not exhaustive
SMS Firewall Market Outlook 2023
1 Market Overview
1.1 Introduction to the SMS Firewall Market
1.2 Scope of the Study
1.3 Research Objective
1.3.1 Key Market Scope and Segments
1.3.2 Players Covered
1.3.3 Years Considered
2 Executive Summary
2.1 2023 SMS Firewall Industry- Market Statistics
3 Market Dynamics
3.1 Market Drivers
3.2 Market Challenges
3.3 Market Opportunities
3.4 Market Trends
4 Market Factor Analysis
4.1 Porter’s Five Forces
4.2 Market Entropy
4.2.1 Global SMS Firewall Market Companies with Area Served
4.2.2 Products Offerings Global SMS Firewall Market
5 COVID-19 Impact Analysis and Outlook Scenarios
5.1.1 Covid-19 Impact Analysis
5.1.2 Post-COVID-19 Scenario- Low Growth Case
5.1.3 Post-COVID-19 Scenario- Reference Growth Case
5.1.4 Post-COVID-19 Scenario- Low Growth Case
6 Global SMS Firewall Market Trends
6.1 Global SMS Firewall Revenue (USD Million) and CAGR (%) by Type (2018-2030)
6.2 Global SMS Firewall Revenue (USD Million) and CAGR (%) by Applications (2018-2030)
6.3 Global SMS Firewall Revenue (USD Million) and CAGR (%) by Regions (2018-2030)
7 Global SMS Firewall Market Revenue (USD Million) by Type, and Applications (2018-2022)
7.1 Global SMS Firewall Revenue (USD Million) by Type (2018-2022)
7.1.1 Global SMS Firewall Revenue (USD Million), Market Share (%) by Type (2018-2022)
7.2 Global SMS Firewall Revenue (USD Million) by Applications (2018-2022)
7.2.1 Global SMS Firewall Revenue (USD Million), Market Share (%) by Applications (2018-2022)
8 Global SMS Firewall Development Regional Status and Outlook
8.1 Global SMS Firewall Revenue (USD Million) By Regions (2018-2022)
8.2 North America SMS Firewall Revenue (USD Million) by Type, and Application (2018-2022)
8.2.1 North America SMS Firewall Revenue (USD Million) by Country (2018-2022)
8.2.2 North America SMS Firewall Revenue (USD Million) by Type (2018-2022)
8.2.3 North America SMS Firewall Revenue (USD Million) by Applications (2018-2022)
8.3 Europe SMS Firewall Revenue (USD Million), by Type, and Applications (USD Million) (2018-2022)
8.3.1 Europe SMS Firewall Revenue (USD Million), by Country (2018-2022)
8.3.2 Europe SMS Firewall Revenue (USD Million) by Type (2018-2022)
8.3.3 Europe SMS Firewall Revenue (USD Million) by Applications (2018-2022)
8.4 Asia Pacific SMS Firewall Revenue (USD Million), and Revenue (USD Million) by Type, and Applications (2018-2022)
8.4.1 Asia Pacific SMS Firewall Revenue (USD Million) by Country (2018-2022)
8.4.2 Asia Pacific SMS Firewall Revenue (USD Million) by Type (2018-2022)
8.4.3 Asia Pacific SMS Firewall Revenue (USD Million) by Applications (2018-2022)
8.5 South America SMS Firewall Revenue (USD Million), by Type, and Applications (2018-2022)
8.5.1 South America SMS Firewall Revenue (USD Million), by Country (2018-2022)
8.5.2 South America SMS Firewall Revenue (USD Million) by Type (2018-2022)
8.5.3 South America SMS Firewall Revenue (USD Million) by Applications (2018-2022)
8.6 Middle East and Africa SMS Firewall Revenue (USD Million), by Type, Technology, Application, Thickness (2018-2022)
8.6.1 Middle East and Africa SMS Firewall Revenue (USD Million) by Country (2018-2022)
8.6.2 Middle East and Africa SMS Firewall Revenue (USD Million) by Type (2018-2022)
8.6.3 Middle East and Africa SMS Firewall Revenue (USD Million) by Applications (2018-2022)
9 Company Profiles
10 Global SMS Firewall Market Revenue (USD Million), by Type, and Applications (2023-2030)
10.1 Global SMS Firewall Revenue (USD Million) and Market Share (%) by Type (2023-2030)
10.1.1 Global SMS Firewall Revenue (USD Million), and Market Share (%) by Type (2023-2030)
10.2 Global SMS Firewall Revenue (USD Million) and Market Share (%) by Applications (2023-2030)
10.2.1 Global SMS Firewall Revenue (USD Million), and Market Share (%) by Applications (2023-2030)
11 Global SMS Firewall Development Regional Status and Outlook Forecast
11.1 Global SMS Firewall Revenue (USD Million) By Regions (2023-2030)
11.2 North America SMS Firewall Revenue (USD Million) by Type, and Applications (2023-2030)
11.2.1 North America SMS Firewall Revenue (USD) Million by Country (2023-2030)
11.2.2 North America SMS Firewall Revenue (USD Million), by Type (2023-2030)
11.2.3 North America SMS Firewall Revenue (USD Million), Market Share (%) by Applications (2023-2030)
11.3 Europe SMS Firewall Revenue (USD Million), by Type, and Applications (2023-2030)
11.3.1 Europe SMS Firewall Revenue (USD Million), by Country (2023-2030)
11.3.2 Europe SMS Firewall Revenue (USD Million), by Type (2023-2030)
11.3.3 Europe SMS Firewall Revenue (USD Million), by Applications (2023-2030)
11.4 Asia Pacific SMS Firewall Revenue (USD Million) by Type, and Applications (2023-2030)
11.4.1 Asia Pacific SMS Firewall Revenue (USD Million), by Country (2023-2030)
11.4.2 Asia Pacific SMS Firewall Revenue (USD Million), by Type (2023-2030)
11.4.3 Asia Pacific SMS Firewall Revenue (USD Million), by Applications (2023-2030)
11.5 South America SMS Firewall Revenue (USD Million), by Type, and Applications (2023-2030)
11.5.1 South America SMS Firewall Revenue (USD Million), by Country (2023-2030)
11.5.2 South America SMS Firewall Revenue (USD Million), by Type (2023-2030)
11.5.3 South America SMS Firewall Revenue (USD Million), by Applications (2023-2030)
11.6 Middle East and Africa SMS Firewall Revenue (USD Million), by Type, and Applications (2023-2030)
11.6.1 Middle East and Africa SMS Firewall Revenue (USD Million), by Region (2023-2030)
11.6.2 Middle East and Africa SMS Firewall Revenue (USD Million), by Type (2023-2030)
11.6.3 Middle East and Africa SMS Firewall Revenue (USD Million), by Applications (2023-2030)
12 Methodology and Data Sources
12.1 Methodology/Research Approach
12.1.1 Research Programs/Design
12.1.2 Market Size Estimation
12.1.3 Market Breakdown and Data Triangulation
12.2 Data Sources
12.2.1 Secondary Sources
12.2.2 Primary Sources
12.3 Disclaimer
List of Tables
Table 1 Market Segmentation Analysis
Table 2 Global SMS Firewall Market Companies with Areas Served
Table 3 Products Offerings Global SMS Firewall Market
Table 4 Low Growth Scenario Forecasts
Table 5 Reference Case Growth Scenario
Table 6 High Growth Case Scenario
Table 7 Global SMS Firewall Revenue (USD Million) And CAGR (%) By Type (2018-2030)
Table 8 Global SMS Firewall Revenue (USD Million) And CAGR (%) By Applications (2018-2030)
Table 9 Global SMS Firewall Revenue (USD Million) And CAGR (%) By Regions (2018-2030)
Table 10 Global SMS Firewall Revenue (USD Million) By Type (2018-2022)
Table 11 Global SMS Firewall Revenue Market Share (%) By Type (2018-2022)
Table 12 Global SMS Firewall Revenue (USD Million) By Applications (2018-2022)
Table 13 Global SMS Firewall Revenue Market Share (%) By Applications (2018-2022)
Table 14 Global SMS Firewall Market Revenue (USD Million) By Regions (2018-2022)
Table 15 Global SMS Firewall Market Share (%) By Regions (2018-2022)
Table 16 North America SMS Firewall Revenue (USD Million) By Country (2018-2022)
Table 17 North America SMS Firewall Revenue (USD Million) By Type (2018-2022)
Table 18 North America SMS Firewall Revenue (USD Million) By Applications (2018-2022)
Table 19 Europe SMS Firewall Revenue (USD Million) By Country (2018-2022)
Table 20 Europe SMS Firewall Revenue (USD Million) By Type (2018-2022)
Table 21 Europe SMS Firewall Revenue (USD Million) By Applications (2018-2022)
Table 22 Asia Pacific SMS Firewall Revenue (USD Million) By Country (2018-2022)
Table 23 Asia Pacific SMS Firewall Revenue (USD Million) By Type (2018-2022)
Table 24 Asia Pacific SMS Firewall Revenue (USD Million) By Applications (2018-2022)
Table 25 South America SMS Firewall Revenue (USD Million) By Country (2018-2022)
Table 26 South America SMS Firewall Revenue (USD Million) By Type (2018-2022)
Table 27 South America SMS Firewall Revenue (USD Million) By Applications (2018-2022)
Table 28 Middle East and Africa SMS Firewall Revenue (USD Million) By Region (2018-2022)
Table 29 Middle East and Africa SMS Firewall Revenue (USD Million) By Type (2018-2022)
Table 30 Middle East and Africa SMS Firewall Revenue (USD Million) By Applications (2018-2022)
Table 31 Financial Analysis
Table 32 Global SMS Firewall Revenue (USD Million) By Type (2023-2030)
Table 33 Global SMS Firewall Revenue Market Share (%) By Type (2023-2030)
Table 34 Global SMS Firewall Revenue (USD Million) By Applications (2023-2030)
Table 35 Global SMS Firewall Revenue Market Share (%) By Applications (2023-2030)
Table 36 Global SMS Firewall Market Revenue (USD Million), And Revenue (USD Million) By Regions (2023-2030)
Table 37 North America SMS Firewall Revenue (USD)By Country (2023-2030)
Table 38 North America SMS Firewall Revenue (USD Million) By Type (2023-2030)
Table 39 North America SMS Firewall Revenue (USD Million) By Applications (2023-2030)
Table 40 Europe SMS Firewall Revenue (USD Million) By Country (2023-2030)
Table 41 Europe SMS Firewall Revenue (USD Million) By Type (2023-2030)
Table 42 Europe SMS Firewall Revenue (USD Million) By Applications (2023-2030)
Table 43 Asia Pacific SMS Firewall Revenue (USD Million) By Country (2023-2030)
Table 44 Asia Pacific SMS Firewall Revenue (USD Million) By Type (2023-2030)
Table 45 Asia Pacific SMS Firewall Revenue (USD Million) By Applications (2023-2030)
Table 46 South America SMS Firewall Revenue (USD Million) By Country (2023-2030)
Table 47 South America SMS Firewall Revenue (USD Million) By Type (2023-2030)
Table 48 South America SMS Firewall Revenue (USD Million) By Applications (2023-2030)
Table 49 Middle East and Africa SMS Firewall Revenue (USD Million) By Region (2023-2030)
Table 50 Middle East and Africa SMS Firewall Revenue (USD Million) By Region (2023-2030)
Table 51 Middle East and Africa SMS Firewall Revenue (USD Million) By Type (2023-2030)
Table 52 Middle East and Africa SMS Firewall Revenue (USD Million) By Applications (2023-2030)
Table 53 Research Programs/Design for This Report
Table 54 Key Data Information from Secondary Sources
Table 55 Key Data Information from Primary Sources
List of Figures
Figure 1 Market Scope
Figure 2 Porter’s Five Forces
Figure 3 Global SMS Firewall Revenue (USD Million) By Type (2018-2022)
Figure 4 Global SMS Firewall Revenue Market Share (%) By Type (2022)
Figure 5 Global SMS Firewall Revenue (USD Million) By Applications (2018-2022)
Figure 6 Global SMS Firewall Revenue Market Share (%) By Applications (2022)
Figure 7 Global SMS Firewall Market Revenue (USD Million) By Regions (2018-2022)
Figure 8 Global SMS Firewall Market Share (%) By Regions (2022)
Figure 9 North America SMS Firewall Revenue (USD Million) By Country (2018-2022)
Figure 10 North America SMS Firewall Revenue (USD Million) By Type (2018-2022)
Figure 11 North America SMS Firewall Revenue (USD Million) By Applications (2018-2022)
Figure 12 Europe SMS Firewall Revenue (USD Million) By Country (2018-2022)
Figure 13 Europe SMS Firewall Revenue (USD Million) By Type (2018-2022)
Figure 14 Europe SMS Firewall Revenue (USD Million) By Applications (2018-2022)
Figure 15 Asia Pacific SMS Firewall Revenue (USD Million) By Country (2018-2022)
Figure 16 Asia Pacific SMS Firewall Revenue (USD Million) By Type (2018-2022)
Figure 17 Asia Pacific SMS Firewall Revenue (USD Million) By Applications (2018-2022)
Figure 18 South America SMS Firewall Revenue (USD Million) By Country (2018-2022)
Figure 19 South America SMS Firewall Revenue (USD Million) By Type (2018-2022)
Figure 20 South America SMS Firewall Revenue (USD Million) By Applications (2018-2022)
Figure 21 Middle East and Africa SMS Firewall Revenue (USD Million) By Region (2018-2022)
Figure 22 Middle East and Africa SMS Firewall Revenue (USD Million) By Type (2018-2022)
Figure 23 Middle East and Africa SMS Firewall Revenue (USD Million) By Applications (2018-2022)
Figure 24 Global SMS Firewall Revenue (USD Million) By Type (2023-2030)
Figure 25 Global SMS Firewall Revenue Market Share (%) By Type (2030)
Figure 26 Global SMS Firewall Revenue (USD Million) By Applications (2023-2030)
Figure 27 Global SMS Firewall Revenue Market Share (%) By Applications (2030)
Figure 28 Global SMS Firewall Market Revenue (USD Million) By Regions (2023-2030)
Figure 29 North America SMS Firewall Revenue (USD Million) By Country (2023-2030)
Figure 30 North America SMS Firewall Revenue (USD Million) By Type (2023-2030)
Figure 31 North America SMS Firewall Revenue (USD Million) By Applications (2023-2030)
Figure 32 Europe SMS Firewall Revenue (USD Million) By Country (2023-2030)
Figure 33 Europe SMS Firewall Revenue (USD Million) By Type (2023-2030)
Figure 34 Europe SMS Firewall Revenue (USD Million) By Applications (2023-2030)
Figure 35 Asia Pacific SMS Firewall Revenue (USD Million) By Country (2023-2030)
Figure 36 Asia Pacific SMS Firewall Revenue (USD Million) By Type (2023-2030)
Figure 37 Asia Pacific SMS Firewall Revenue (USD Million) By Applications (2023-2030)
Figure 38 South America SMS Firewall Revenue (USD Million) By Country (2023-2030)
Figure 39 South America SMS Firewall Revenue (USD Million) By Type (2023-2030)
Figure 40 South America SMS Firewall Revenue (USD Million) By Applications (2023-2030)
Figure 41 Middle East and Africa SMS Firewall Revenue (USD Million) By Region (2023-2030)
Figure 42 Middle East and Africa SMS Firewall Revenue (USD Million) By Region (2023-2030)
Figure 43 Middle East and Africa SMS Firewall Revenue (USD Million) By Type (2023-2030)
Figure 44 Middle East and Africa SMS Firewall Revenue (USD Million) By Applications (2023-2030)
Figure 45 Bottom-Up and Top-Down Approaches For This Report
Figure 46 Data Triangulation
