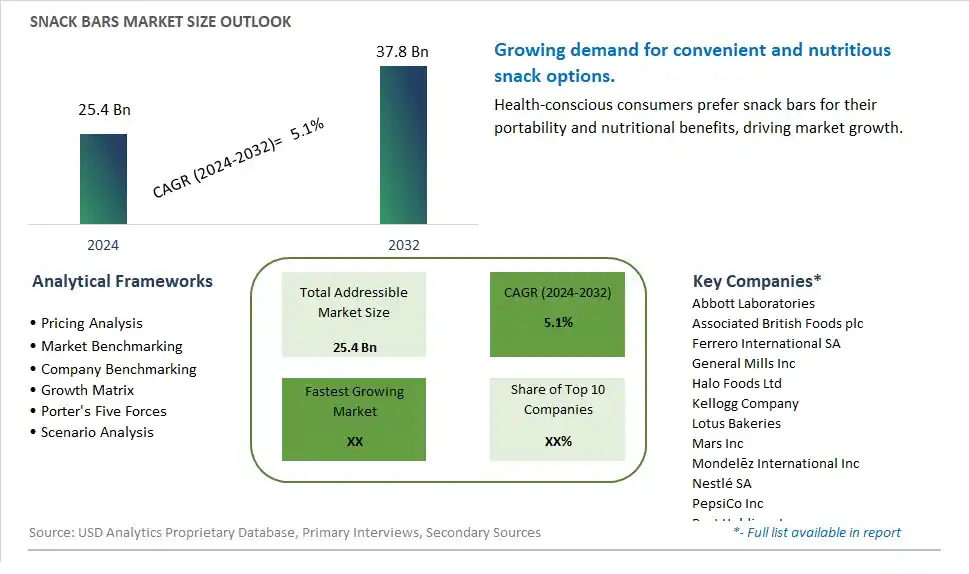
Global Snack Bars Market Size is valued at $25.4 Billion in 2024 and is forecast to register a growth rate (CAGR) of 5.1% to reach $37.8 Billion by 2032.
The global Snack Bars Market Comprehensive Study analyzes and forecasts the market size across 6 regions and 24 countries for diverse segments -By Product (Breakfast Bars, Muesli Bars, Fruit Bars, Energy And Nutrition Bars, Others), By Application (Supermarkets/Hypermarkets, Convenience Stores, Online)
An Introduction to Snack Bars Market
The snack bars market in 2024 is experiencing robust growth, fueled by shifting consumer lifestyles, increasing demand for convenient and nutritious on-the-go snacks, and product innovation. Snack bars, including granola bars, protein bars, and energy bars, are gaining popularity as convenient and portable snack options that provide sustained energy and satiety. With consumers prioritizing health and wellness, manufacturers are responding by offering a diverse range of snack bars formulated with natural and functional ingredients, such as whole grains, nuts, seeds, and superfoods. Moreover, advancements in food technology and manufacturing processes are enabling the development of snack bars with improved taste, texture, and nutritional profiles, further driving market growth. Additionally, strategic partnerships with retailers, fitness centers, and wellness brands are expanding distribution channels and enhancing brand visibility. Furthermore, personalized nutrition trends, such as customizable snack bar options tailored to individual dietary preferences and wellness goals, are gaining traction and driving market innovation. Overall, the snack bars market is poised for sustained expansion as consumers seek convenient, nutritious, and satisfying snack options to support their active lifestyles and dietary needs.
Snack Bars Competitive Landscape
The market report analyses the leading companies in the industry including Abbott Laboratories, Associated British Foods plc, Ferrero International SA, General Mills Inc, Halo Foods Ltd, Kellogg Company, Lotus Bakeries, Mars Inc, MondelÄ“z International Inc, Nestlé SA, PepsiCo Inc, Post Holdings Inc, Simply Good Foods Co, The Hershey Company, and Others.
Snack Bars Market Dynamics
Snack Bars Market Trend: Growing Demand for Healthy and Convenient Snacking Options
A prominent trend in the snack bars market is the increasing demand for healthy and convenient snacking options. With busy lifestyles and a greater focus on health and wellness, consumers are seeking snacks that provide nutritional benefits without sacrificing taste or convenience. Snack bars, fortified with protein, fiber, vitamins, and minerals, are gaining popularity as on-the-go snacks that offer sustained energy and satiety. This trend is driven by consumers' desire for portable, portion-controlled snacks that support their active lifestyles and dietary preferences, including gluten-free, vegan, and low-sugar options.
Market Driver: Rising Health Consciousness and Wellness Trends
A key driver for the snack bars market is the rising health consciousness and wellness trends among consumers. As more individuals prioritize their health and seek out nutritious food choices, the demand for snack bars perceived as healthier alternatives to traditional snacks like candy bars and chips is increasing. Snack bars positioned as wholesome, natural, and functional snacks appeal to health-conscious consumers looking to fuel their bodies with nourishing ingredients. Additionally, the influence of fitness and wellness influencers, coupled with growing awareness of the importance of balanced nutrition, drives the adoption of snack bars as convenient options for supporting overall well-being.
Market Opportunity: Innovation in Flavor Profiles and Ingredient Formulations
An opportunity for the snack bars market lies in innovation in flavor profiles and ingredient formulations. Manufacturers can capitalize on consumer preferences for variety and novelty by introducing new and exciting flavors that cater to diverse taste preferences. This includes incorporating trending flavors such as exotic fruits, superfood ingredients, and globally-inspired flavor combinations to differentiate their products in the competitive market landscape. Moreover, exploring innovative ingredient formulations, such as plant-based proteins, ancient grains, and functional ingredients like probiotics and adaptogens, can further enhance the nutritional profile and appeal of snack bars. By staying abreast of evolving consumer tastes and dietary preferences, brands can leverage flavor and ingredient innovation to capture market share and meet the growing demand for innovative snack solutions.
Snack Bars Market Share Analysis: Energy and Nutrition Bars held the dominant market share in 2024
In the segmented landscape of the Snack Bars Market categorized by Product, the Energy and Nutrition Bars segment is the largest and most prevalent, driven by several key factors. Energy and nutrition bars are increasingly favored by consumers seeking convenient, on-the-go snacks that provide sustained energy and essential nutrients. These bars are often formulated with a balance of carbohydrates, proteins, and healthy fats, making them a popular choice among health-conscious individuals looking to maintain their energy levels throughout the day. Additionally, the versatility of energy and nutrition bars allows for a wide range of flavor profiles and functional ingredients, catering to diverse consumer preferences and dietary needs. Further, the growing trend of meal replacement and snacking occasions further boosts the demand for energy and nutrition bars. While other segments such as breakfast bars and fruit bars also hold significance in the snack bars market, the dominance of Energy and Nutrition Bars persists due to their widespread appeal and functional benefits. As consumers continue to prioritize convenience and nutrition in their snacking choices, the Energy and Nutrition Bars segment is expected to maintain its dominance, driving overall market sales and growth.
Snack Bars Market Share Analysis: Online market is poised to register the fastest growth rae over the forecast period to 2032
In the dynamic landscape of the Snack Bars Market categorized by Application, the Online segment is the fastest-growing player, propelled by several key factors. With the increasing adoption of e-commerce platforms and the convenience of online shopping, consumers are increasingly turning to online channels to purchase snack bars. Online retailers offer a wide selection of snack bars from various brands, providing consumers with the convenience of browsing and purchasing from the comfort of their homes. Further, the COVID-19 pandemic has further accelerated the shift towards online shopping, as consumers prioritize safety and contactless transactions. Additionally, online platforms often provide discounts, promotions, and subscription options, enticing consumers to purchase snack bars in bulk or try new flavors. As the online retail landscape continues to expand and evolve, the Online segment is expected to sustain its rapid growth trajectory in the Snack Bars Market, reshaping the way consumers access and enjoy their favorite snack bars.
Snack Bars Market Segmentation
By Product
Breakfast Bars
Muesli Bars
Fruit Bars
Energy And Nutrition Bars
Others
By Application
Supermarkets/Hypermarkets
Convenience Stores
Online
Countries Analyzed
North America (US, Canada, Mexico)
Europe (Germany, UK, France, Spain, Italy, Russia, Rest of Europe)
Asia Pacific (China, India, Japan, South Korea, Australia, South East Asia, Rest of Asia)
South America (Brazil, Argentina, Rest of South America)
Middle East and Africa (Saudi Arabia, UAE, Rest of Middle East, South Africa, Egypt, Rest of Africa)
Snack Bars Companies Profiled in the Study
Abbott Laboratories
Associated British Foods plc
Ferrero International SA
General Mills Inc
Halo Foods Ltd
Kellogg Company
Lotus Bakeries
Mars Inc
Mondelēz International Inc
Nestlé SA
PepsiCo Inc
Post Holdings Inc
Simply Good Foods Co
The Hershey Company
*- List Not Exhaustive
Chapter 1. TABLE OF CONTENTS
Chapter 2. Introduction to Snack Bars Market
2.1. Market Overview
2.2. Key Statistics and Report Highlights
2.3. Scope of the Comprehensive Study
2.3.1. Market Definition
2.3.2 Countries and Regions Covered
2.3.3 Research Objective
2.3.4 Units, Currency, and Conversions
2.3.5 Industry Value Chain
2.4. Key Market Segments
2.5. Key Companies
2.6. Study Period
Chapter 3. Strategic Analysis Review
3.1. Snack Bars Pricing Analysis and Forecast
3.2. Porter’s Five Forces
3.3. Market Ecosystem
3.4. SWOT Analysis
3.5. Regulatory Scenario
3.3. Effects of Inflation, Russia-Ukraine War, moderating economic growth, and other macroeconomic factors
Chapter 4. Competitive Landscape
4.1. Market Share Analysis
4.1.1. Global Snack Bars Market Share by Company, 2023
4.1.2. Product Offerings of Leading Snack Bars Companies
4.2. Market Entropy
4.2.1. New Product Launches in the Industry
4.2.2. Mergers, Acquisitions, Joint ventures, and Partnerships
4.3. Key Strategies and Best Practices
Chapter 5. Global Market Projections: Best, Reference, and Low Case Scenarios
5.1. Growth Analysis- Case Scenario Definitions
5.2. Low Growth Case Scenario Forecasts
5.3. Reference Growth Case Scenario Forecasts
5.4. High Growth Case Scenario Forecasts
Chapter 6. Market Dynamics
6.1. Snack Bars Market Drivers
6.2. Snack Bars Market Challenges
6.6. Snack Bars Market Opportunities
6.4. Snack Bars Market Trends
Chapter 7. Global Snack Bars Market Outlook Trends
7.1. Global Snack Bars Revenue (USD Million) and CAGR (%) by Type (2021-2032)
7.2. Global Snack Bars Revenue (USD Million) and CAGR (%) by Application (2021-2032)
7.3. Global Snack Bars Revenue (USD Million) and CAGR (%) by Product (2021-2032)
By Product
Breakfast Bars
Muesli Bars
Fruit Bars
Energy And Nutrition Bars
Others
By Application
Supermarkets/Hypermarkets
Convenience Stores
Online
Chapter 8. Global Snack Bars Regional Analysis and Outlook
8.1. Global Snack Bars Revenue (USD Million) By Regions (2021- 2032)
8.2. North America Snack Bars Revenue (USD Million) by Country (2021-2032)
8.2.1. United States Snack Bars Regional Analysis and Outlook
8.2.2. Canada Snack Bars Regional Analysis and Outlook
8.2.3. Mexico Snack Bars Regional Analysis and Outlook
8.3. Europe Snack Bars Revenue (USD Million), by Country (2021-2032)
8.3.1. Germany Snack Bars Regional Analysis and Outlook
8.3.2. France Snack Bars Regional Analysis and Outlook
8.3.3. United Kingdom Snack Bars Regional Analysis and Outlook
8.3.4. Spain Snack Bars Regional Analysis and Outlook
8.3.5. Italy Snack Bars Regional Analysis and Outlook
8.3.6. Russia Snack Bars Regional Analysis and Outlook
8.3.7. Rest of Europe Snack Bars Regional Analysis and Outlook
8.4. Asia Pacific Snack Bars Revenue (USD Million) by Country (2021-2032)
8.4.1. China Snack Bars Regional Analysis and Outlook
8.4.2. Japan Snack Bars Regional Analysis and Outlook
8.4.3. India Snack Bars Regional Analysis and Outlook
8.4.4. South Korea Snack Bars Regional Analysis and Outlook
8.4.5. Australia Snack Bars Regional Analysis and Outlook
8.4.6. South East Asia Snack Bars Regional Analysis and Outlook
8.4.7. Rest of Asia Pacific Snack Bars Regional Analysis and Outlook
8.5. South America Snack Bars Revenue (USD Million), by Country (2021-2032)
8.5.1. Brazil Snack Bars Regional Analysis and Outlook
8.5.2. Argentina Snack Bars Regional Analysis and Outlook
8.5.3. Rest of South America Snack Bars Regional Analysis and Outlook
8.6. Middle East and Africa Snack Bars Revenue (USD Million) by Country (2021-2032)
8.6.1. Middle East Snack Bars Regional Analysis and Outlook
8.6.2. Africa Snack Bars Regional Analysis and Outlook
Chapter 9. North America Snack Bars Analysis and Outlook
9.1. North America Snack Bars Revenue (USD Million) by Segments (2021-2032)
9.1.1. North America Snack Bars Revenue (USD Million) by Type (2021-2032)
9.1.2. North America Snack Bars Revenue (USD Million) by Application (2021-2032)
9.1.3. North America Snack Bars Revenue (USD Million) by Product (2021-2032)
By Product
Breakfast Bars
Muesli Bars
Fruit Bars
Energy And Nutrition Bars
Others
By Application
Supermarkets/Hypermarkets
Convenience Stores
Online
Chapter 10. Europe Snack Bars Analysis and Outlook
10.1. Europe Snack Bars Revenue (USD Million), by Segments (USD Million) (2021-2032)
10.1.1. Europe Snack Bars Revenue (USD Million) by Type (2021-2032)
10.1.2. Europe Snack Bars Revenue (USD Million) by Application (2021-2032)
10.1.3. Europe Snack Bars Revenue (USD Million) by Product (2021-2032)
By Product
Breakfast Bars
Muesli Bars
Fruit Bars
Energy And Nutrition Bars
Others
By Application
Supermarkets/Hypermarkets
Convenience Stores
Online
Chapter 11. Asia Pacific Snack Bars Analysis and Outlook
11.1. Asia Pacific Snack Bars Revenue (USD Million), and Revenue (USD Million) by Segments (2021-2032)
11.1.1. Asia Pacific Snack Bars Revenue (USD Million) by Type (2021-2032)
11.1.2. Asia Pacific Snack Bars Revenue (USD Million) by Application (2021-2032)
11.1.3. Asia Pacific Snack Bars Revenue (USD Million) by Product (2021-2032)
By Product
Breakfast Bars
Muesli Bars
Fruit Bars
Energy And Nutrition Bars
Others
By Application
Supermarkets/Hypermarkets
Convenience Stores
Online
Chapter 12. South America Snack Bars Analysis and Outlook
12.1. South America Snack Bars Revenue (USD Million), by Segments (2021-2032)
12.1.1. South America Snack Bars Revenue (USD Million) by Type (2021-2032)
12.1.2. South America Snack Bars Revenue (USD Million) by Application (2021-2032)
12.1.3. South America Snack Bars Revenue (USD Million) by Product (2021-2032)
By Product
Breakfast Bars
Muesli Bars
Fruit Bars
Energy And Nutrition Bars
Others
By Application
Supermarkets/Hypermarkets
Convenience Stores
Online
Chapter 13. Middle East and Africa Snack Bars Analysis and Outlook
13.1. Middle East and Africa Snack Bars Revenue (USD Million), by Segments (2021-2032)
13.1.1. Middle East and Africa Snack Bars Revenue (USD Million) by Type (2021-2032)
13.1.2. Middle East and Africa Snack Bars Revenue (USD Million) by Application (2021-2032)
13.1.3. Middle East and Africa Snack Bars Revenue (USD Million) by Product (2021-2032)
By Product
Breakfast Bars
Muesli Bars
Fruit Bars
Energy And Nutrition Bars
Others
By Application
Supermarkets/Hypermarkets
Convenience Stores
Online
Chapter 14. Snack Bars Company Profiles
14.1 Business Overview
14.2 Product Profiles
14.3 SWOT Profiles
14.5 Recent Developments
14.6 Financial Profile
List of Companies
Abbott Laboratories
Associated British Foods plc
Ferrero International SA
General Mills Inc
Halo Foods Ltd
Kellogg Company
Lotus Bakeries
Mars Inc
Mondelēz International Inc
Nestlé SA
PepsiCo Inc
Post Holdings Inc
Simply Good Foods Co
The Hershey Company
15. Methodology and Data Sources
15.1 Customization Offerings
15.2 Subscription Services
15.3 Related Reports
15.4 Publisher Expertise
LIST OF TABLES
Table 1 Market Segmentation Analysis
Table 2 Global Snack Bars Market Share of Leading Companies, 2023
Table 3 Product Offerings of Leading Companies
Table 4 Low Growth Scenario Forecasts
Table 5 Reference Case Growth Scenario
Table 6 High Growth Case Scenario
Table 7 Global Snack Bars Revenue (USD Million) And CAGR (%) By Type (2021-2032)
Table 8 Global Snack Bars Revenue (USD Million) And CAGR (%) By Application (2021-2032)
Table 9 Global Snack Bars Revenue (USD Million) And CAGR (%) By Product (2021-2032)
Table 10 Global Snack Bars Market Revenue (USD Million) By Regions (2021-2032)
Table 11 Global Snack Bars Market Share (%) By Regions (2021-2032)
Table 12 North America Snack Bars Revenue (USD Million) By Country (2021-2032)
Table 13 Europe Snack Bars Revenue (USD Million) By Country (2021-2032)
Table 14 Asia Pacific Snack Bars Revenue (USD Million) By Country (2021-2032)
Table 15 South America Snack Bars Revenue (USD Million) By Country (2021-2032)
Table 16 Middle East and Africa Snack Bars Revenue (USD Million) By Region (2021-2032)
Table 17 North America Snack Bars Revenue (USD Million) By Type (2021-2032)
Table 18 North America Snack Bars Revenue (USD Million) By Application (2021-2032)
Table 19 North America Snack Bars Revenue (USD Million) By Product (2021-2032)
Table 20 Europe Snack Bars Revenue (USD Million) By Type (2021-2032)
Table 21 Europe Snack Bars Revenue (USD Million) By Application (2021-2032)
Table 22 Europe Snack Bars Revenue (USD Million) By Product (2021-2032)
Table 23 Asia Pacific Snack Bars Revenue (USD Million) By Type (2021-2032)
Table 24 Asia Pacific Snack Bars Revenue (USD Million) By Application (2021-2032)
Table 25 Asia Pacific Snack Bars Revenue (USD Million) By Product (2021-2032)
Table 26 South America Snack Bars Revenue (USD Million) By Type (2021-2032)
Table 27 South America Snack Bars Revenue (USD Million) By Application (2021-2032)
Table 28 South America Snack Bars Revenue (USD Million) By Product (2021-2032)
Table 29 Middle East and Africa Snack Bars Revenue (USD Million) By Type (2021-2032)
Table 30 Middle East and Africa Snack Bars Revenue (USD Million) By Application (2021-2032)
Table 31 Middle East and Africa Snack Bars Revenue (USD Million) By Product (2021-2032)
LIST OF FIGURES
Figure 1. Market Scope
Figure 2. Pricing Forecasts Per Unit, 2023- 2032
Figure 3. Porter’s Five Forces
Figure 4. Global Snack Bars Market Revenue (USD Million) By Regions (2021-2032)
Figure 5. Global Snack Bars Market Share (%) By Regions (2023)
Figure 6. North America Snack Bars Revenue (USD Million) By Country (2021-2032)
Figure 7. United States Snack Bars Revenue (USD Million) By Country (2021-2032)
Figure 8. Canada Snack Bars Revenue (USD Million) By Country (2021-2032)
Figure 9. Mexico Snack Bars Revenue (USD Million) By Country (2021-2032)
Figure 10. Europe Snack Bars Revenue (USD Million) By Country (2021-2032)
Figure 11. Germany Snack Bars Revenue (USD Million) By Country (2021-2032)
Figure 12. France Snack Bars Revenue (USD Million) By Country (2021-2032)
Figure 13. United Kingdom Snack Bars Revenue (USD Million) By Country (2021-2032)
Figure 14. Spain Snack Bars Revenue (USD Million) By Country (2021-2032)
Figure 15. Italy Snack Bars Revenue (USD Million) By Country (2021-2032)
Figure 16. Russia Snack Bars Revenue (USD Million) By Country (2021-2032)
Figure 17. Rest of Europe Snack Bars Revenue (USD Million) By Country (2021-2032)
Figure 11. Asia Pacific Snack Bars Revenue (USD Million) By Country (2021-2032)
Figure 12. China Snack Bars Revenue (USD Million) By Country (2021-2032)
Figure 13. Japan Snack Bars Revenue (USD Million) By Country (2021-2032)
Figure 14. India Snack Bars Revenue (USD Million) By Country (2021-2032)
Figure 15. South Korea Snack Bars Revenue (USD Million) By Country (2021-2032)
Figure 16. Australia Snack Bars Revenue (USD Million) By Country (2021-2032)
Figure 17. South East Asia Snack Bars Revenue (USD Million) By Country (2021-2032)
Figure 18. South America Snack Bars Revenue (USD Million) By Country (2021-2032)
Figure 19. Brazil Snack Bars Revenue (USD Million) By Country (2021-2032)
Figure 20. Argentina Snack Bars Revenue (USD Million) By Country (2021-2032)
Figure 21. Rest of Asia Pacific Snack Bars Revenue (USD Million) By Country (2021-2032)
Figure 22. Middle East and Africa Snack Bars Revenue (USD Million) By Region (2021-2032)
Figure 23. Saudi Arabia Snack Bars Revenue (USD Million) By Region (2021-2032)
Figure 24. The UAE Snack Bars Revenue (USD Million) By Region (2021-2032)
Figure 25. Rest of Middle East Snack Bars Revenue (USD Million) By Region (2021-2032)
Figure 26. South Africa Snack Bars Revenue (USD Million) By Region (2021-2032)
Figure 27. Africa Snack Bars Revenue (USD Million) By Region (2021-2032)
Figure 28. North America Snack Bars Revenue (USD Million) By Type (2021-2032)
Figure 29. North America Snack Bars Revenue (USD Million) By Application (2021-2032)
Figure 30. North America Snack Bars Revenue (USD Million) By Product (2021-2032)
Figure 31. Europe Snack Bars Revenue (USD Million) By Type (2021-2032)
Figure 32. Europe Snack Bars Revenue (USD Million) By Application (2021-2032)
Figure 33. Europe Snack Bars Revenue (USD Million) By Product (2021-2032)
Figure 34. Asia Pacific Snack Bars Revenue (USD Million) By Type (2021-2032)
Figure 35. Asia Pacific Snack Bars Revenue (USD Million) By Application (2021-2032)
Figure 36. Asia Pacific Snack Bars Revenue (USD Million) By Product (2021-2032)
Figure 37. South America Snack Bars Revenue (USD Million) By Type (2021-2032)
Figure 38. South America Snack Bars Revenue (USD Million) By Application (2021-2032)
Figure 39. South America Snack Bars Revenue (USD Million) By Product (2021-2032)
Figure 40. Middle East and Africa Snack Bars Revenue (USD Million) By Type (2021-2032)
Figure 41. Middle East and Africa Snack Bars Revenue (USD Million) By Application (2021-2032)
Figure 42. Middle East and Africa Snack Bars Revenue (USD Million) By Product (2021-2032)
By Product
Breakfast Bars
Muesli Bars
Fruit Bars
Energy And Nutrition Bars
Others
By Application
Supermarkets/Hypermarkets
Convenience Stores
Online
Countries Analyzed
North America (US, Canada, Mexico)
Europe (Germany, UK, France, Spain, Italy, Russia, Rest of Europe)
Asia Pacific (China, India, Japan, South Korea, Australia, South East Asia, Rest of Asia)
South America (Brazil, Argentina, Rest of South America)
Middle East and Africa (Saudi Arabia, UAE, Rest of Middle East, South Africa, Egypt, Rest of Africa)
