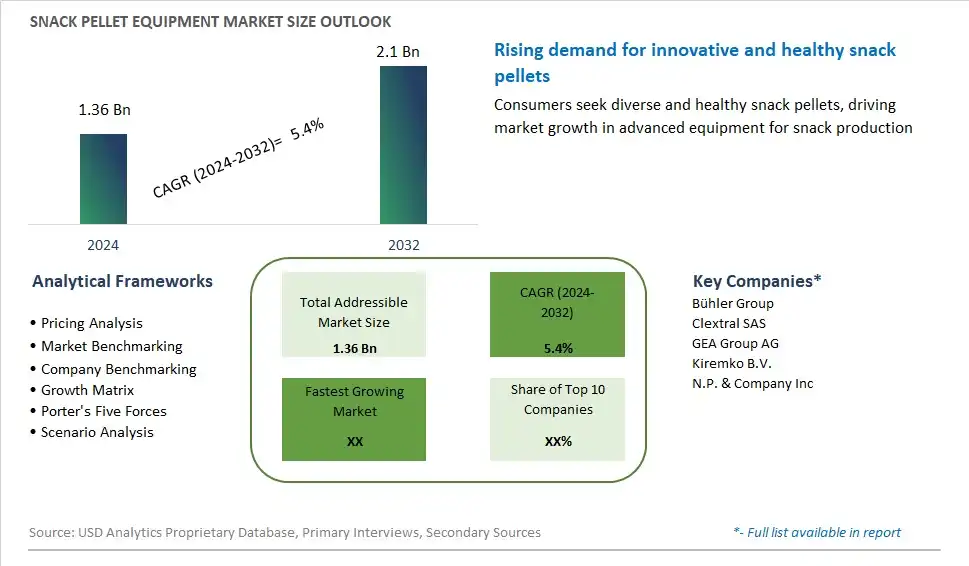
Global Snack Pellet Equipment Market Size is valued at $1.36 Billion in 2024 and is forecast to register a growth rate (CAGR) of 5.4% to reach $2.1 Billion by 2032.
The global Snack Pellet Equipment Market Comprehensive Study analyzes and forecasts the market size across 6 regions and 24 countries for diverse segments -By Equipment (Extrusion, Mixing, Cutting, Drying, Frying, Seasoning, Others), By Product (Potato, Corn, Rice, Tapioca, Multigrain, Others), By Form (2D, Tridimensional, Die-Face)
An Introduction to Snack Pellet Equipment Market
Snack pellet equipment comprises machinery and systems used in the production of snack pellets, semi-finished products made from various starchy ingredients such as potato, corn, wheat, rice, and tapioca in 2024. Snack pellets are versatile ingredients used in the manufacture of a wide range of extruded and fried snack products such as chips, curls, rings, and sticks. Snack pellet equipment includes extruders, pelletizers, dryers, fryers, and seasoning systems designed to produce snack pellets with desired shapes, textures, and flavors. With the growing demand for snack foods, convenience products, and ethnic snacks, the market for snack pellet equipment is expanding, driven by innovations in equipment design, processing technology, and flavor formulations that enable manufacturers to develop unique and differentiated snack products to meet diverse consumer preferences and market trends.
Snack Pellet Equipment Competitive Landscape
The market report analyses the leading companies in the industry including Bühler Group, Clextral SAS, GEA Group AG, Kiremko B.V., N.P. & Company Inc, and Others.
Snack Pellet Equipment Market Dynamics
Snack Pellet Equipment Market Trend: Growing Demand for Innovative Snack Varieties
One prominent market trend in snack pellet equipment is the growing demand for innovative snack varieties. Consumers are increasingly seeking unique and exotic flavors, textures, and shapes in their snacks, driving manufacturers to invest in advanced equipment capable of producing a wide range of pellet shapes and textures. Snack pellet equipment that offers flexibility in customization, such as the ability to produce multigrain, multicolor, and filled pellets, is particularly in demand as it enables manufacturers to cater to evolving consumer preferences and differentiate their product offerings in the competitive snack market. Additionally, the rise of health-conscious consumers is driving the demand for healthier snack options, leading manufacturers to develop snack pellets made from alternative ingredients such as whole grains, pulses, and vegetables.
Market Driver: Expansion of Snack Industry and Manufacturing Capabilities
A key driver fueling the market for snack pellet equipment is the expansion of the snack industry and manufacturing capabilities worldwide. The growing popularity of snacking as a convenient and on-the-go food option, coupled with changing consumer lifestyles and eating habits, has spurred significant growth in the snack market. This expansion has prompted snack manufacturers to ramp up their production capacities and invest in state-of-the-art equipment to meet the increasing demand for snack products. Snack pellet equipment plays a crucial role in this scenario by enabling manufacturers to efficiently produce large volumes of snack pellets at high speeds while maintaining consistent quality and safety standards. As snack companies seek to expand their product portfolios and enter new markets, the demand for advanced pellet equipment capable of enhancing production efficiency and product innovation is expected to surge further.
Market Opportunity: Adoption of Automation and Industry 4.0 Technologies
An opportunity within the snack pellet equipment market lies in the adoption of automation and Industry 4.0 technologies to enhance manufacturing efficiency, productivity, and competitiveness. With the rise of smart manufacturing and the Internet of Things (IoT), there is increasing interest among snack manufacturers in integrating automation solutions into their production processes to streamline operations, reduce labor costs, and improve overall equipment effectiveness. Advanced pellet equipment equipped with automation features such as remote monitoring, predictive maintenance, and self-adjusting controls can help manufacturers optimize production workflows, minimize downtime, and ensure consistent product quality. Furthermore, the integration of data analytics and machine learning algorithms into pellet equipment enables real-time performance monitoring, predictive analytics, and proactive decision-making, facilitating continuous process improvement and innovation. By embracing automation and Industry 4.0 technologies, manufacturers can unlock new levels of efficiency, agility, and competitiveness in the snack pellet equipment market, positioning themselves for long-term success in a rapidly evolving industry landscape.
Snack Pellet Equipment Market Share Analysis: Extrusion held the dominant market share in 2024
The extrusion segment dominates the snack pellet equipment market due to the widespread adoption of extrusion technology in the production of snack pellets. Extrusion equipment plays a pivotal role in the snack pellet manufacturing process by converting raw materials such as starches, flours, grains, and pulses into various shapes and textures through a continuous extrusion process. This technology offers versatility, flexibility, and scalability in snack pellet production, allowing manufacturers to create a wide range of snack products with different shapes, sizes, flavors, and textures. Additionally, extrusion equipment enables efficient and uniform cooking of snack pellets, ensuring consistent quality and taste across batches. With the growing demand for innovative and convenient snack products globally, the extrusion segment remains a vital component of the snack pellet equipment market, driving innovation and advancements in extrusion technologies for snack production.
Snack Pellet Equipment Market Share Analysis: Rice market is poised to register the fastest growth rae over the forecast period to 2032
The rice segment is experiencing rapid growth in the snack pellet equipment market due to several factors driving its popularity in snack production. Rice-based snack pellets offer several advantages, including gluten-free properties, light texture, and neutral flavor profile, making them suitable for a wide range of consumers, including those with dietary restrictions or preferences. Additionally, rice is a staple food in many regions worldwide, making it readily available and cost-effective for snack manufacturers. Further, rice-based snack pellets can be easily flavored, shaped, and textured to create a diverse range of snack products, catering to changing consumer preferences and market trends. With increasing consumer demand for healthier and more diverse snack options, the rice segment is poised for continued growth, driving innovation and investment in rice-based snack pellet equipment and technologies.
Snack Pellet Equipment Market Share Analysis: 2D held the dominant market share in 2024
The 2D segment commands the largest share in the snack pellet equipment market due to its versatility, efficiency, and widespread application in snack production. 2D snack pellet equipment is capable of producing a wide range of flat, sheet-like snack pellets with various shapes, sizes, and textures. These snack pellets are popularly used as bases for coated snacks, such as potato chips, crackers, and tortilla chips, as well as for filled snacks like sandwich crackers and filled biscuits. The simplicity and flexibility of 2D snack pellet equipment make it suitable for both small-scale and large-scale snack manufacturers, offering cost-effective solutions for producing high-quality snack products. Additionally, the 2D form factor allows for easy customization and adaptation to meet changing consumer preferences and market demands. As the snack industry continues to evolve and innovate, the 2D segment remains at the forefront of snack pellet equipment technology, driving growth and expansion in the market.
Snack Pellet Equipment Market Segmentation
By Equipment
Extrusion
Mixing
Cutting
Drying
Frying
Seasoning
Others
By Product
Potato
Corn
Rice
Tapioca
Multigrain
Others
By Form
2D
Tridimensional
Die-Face
Countries Analyzed
North America (US, Canada, Mexico)
Europe (Germany, UK, France, Spain, Italy, Russia, Rest of Europe)
Asia Pacific (China, India, Japan, South Korea, Australia, South East Asia, Rest of Asia)
South America (Brazil, Argentina, Rest of South America)
Middle East and Africa (Saudi Arabia, UAE, Rest of Middle East, South Africa, Egypt, Rest of Africa)
Snack Pellet Equipment Companies Profiled in the Study
Bühler Group
Clextral SAS
GEA Group AG
Kiremko B.V.
N.P. & Company Inc
*- List Not Exhaustive
Chapter 1. TABLE OF CONTENTS
Chapter 2. Introduction to Snack Pellet Equipment Market
2.1. Market Overview
2.2. Key Statistics and Report Highlights
2.3. Scope of the Comprehensive Study
2.3.1. Market Definition
2.3.2 Countries and Regions Covered
2.3.3 Research Objective
2.3.4 Units, Currency, and Conversions
2.3.5 Industry Value Chain
2.4. Key Market Segments
2.5. Key Companies
2.6. Study Period
Chapter 3. Strategic Analysis Review
3.1. Snack Pellet Equipment Pricing Analysis and Forecast
3.2. Porter’s Five Forces
3.3. Market Ecosystem
3.4. SWOT Analysis
3.5. Regulatory Scenario
3.3. Effects of Inflation, Russia-Ukraine War, moderating economic growth, and other macroeconomic factors
Chapter 4. Competitive Landscape
4.1. Market Share Analysis
4.1.1. Global Snack Pellet Equipment Market Share by Company, 2023
4.1.2. Product Offerings of Leading Snack Pellet Equipment Companies
4.2. Market Entropy
4.2.1. New Product Launches in the Industry
4.2.2. Mergers, Acquisitions, Joint ventures, and Partnerships
4.3. Key Strategies and Best Practices
Chapter 5. Global Market Projections: Best, Reference, and Low Case Scenarios
5.1. Growth Analysis- Case Scenario Definitions
5.2. Low Growth Case Scenario Forecasts
5.3. Reference Growth Case Scenario Forecasts
5.4. High Growth Case Scenario Forecasts
Chapter 6. Market Dynamics
6.1. Snack Pellet Equipment Market Drivers
6.2. Snack Pellet Equipment Market Challenges
6.6. Snack Pellet Equipment Market Opportunities
6.4. Snack Pellet Equipment Market Trends
Chapter 7. Global Snack Pellet Equipment Market Outlook Trends
7.1. Global Snack Pellet Equipment Revenue (USD Million) and CAGR (%) by Type (2021-2032)
7.2. Global Snack Pellet Equipment Revenue (USD Million) and CAGR (%) by Application (2021-2032)
7.3. Global Snack Pellet Equipment Revenue (USD Million) and CAGR (%) by Product (2021-2032)
By Equipment
Extrusion
Mixing
Cutting
Drying
Frying
Seasoning
Others
By Product
Potato
Corn
Rice
Tapioca
Multigrain
Others
By Form
2D
Tridimensional
Die-Face
Chapter 8. Global Snack Pellet Equipment Regional Analysis and Outlook
8.1. Global Snack Pellet Equipment Revenue (USD Million) By Regions (2021- 2032)
8.2. North America Snack Pellet Equipment Revenue (USD Million) by Country (2021-2032)
8.2.1. United States Snack Pellet Equipment Regional Analysis and Outlook
8.2.2. Canada Snack Pellet Equipment Regional Analysis and Outlook
8.2.3. Mexico Snack Pellet Equipment Regional Analysis and Outlook
8.3. Europe Snack Pellet Equipment Revenue (USD Million), by Country (2021-2032)
8.3.1. Germany Snack Pellet Equipment Regional Analysis and Outlook
8.3.2. France Snack Pellet Equipment Regional Analysis and Outlook
8.3.3. United Kingdom Snack Pellet Equipment Regional Analysis and Outlook
8.3.4. Spain Snack Pellet Equipment Regional Analysis and Outlook
8.3.5. Italy Snack Pellet Equipment Regional Analysis and Outlook
8.3.6. Russia Snack Pellet Equipment Regional Analysis and Outlook
8.3.7. Rest of Europe Snack Pellet Equipment Regional Analysis and Outlook
8.4. Asia Pacific Snack Pellet Equipment Revenue (USD Million) by Country (2021-2032)
8.4.1. China Snack Pellet Equipment Regional Analysis and Outlook
8.4.2. Japan Snack Pellet Equipment Regional Analysis and Outlook
8.4.3. India Snack Pellet Equipment Regional Analysis and Outlook
8.4.4. South Korea Snack Pellet Equipment Regional Analysis and Outlook
8.4.5. Australia Snack Pellet Equipment Regional Analysis and Outlook
8.4.6. South East Asia Snack Pellet Equipment Regional Analysis and Outlook
8.4.7. Rest of Asia Pacific Snack Pellet Equipment Regional Analysis and Outlook
8.5. South America Snack Pellet Equipment Revenue (USD Million), by Country (2021-2032)
8.5.1. Brazil Snack Pellet Equipment Regional Analysis and Outlook
8.5.2. Argentina Snack Pellet Equipment Regional Analysis and Outlook
8.5.3. Rest of South America Snack Pellet Equipment Regional Analysis and Outlook
8.6. Middle East and Africa Snack Pellet Equipment Revenue (USD Million) by Country (2021-2032)
8.6.1. Middle East Snack Pellet Equipment Regional Analysis and Outlook
8.6.2. Africa Snack Pellet Equipment Regional Analysis and Outlook
Chapter 9. North America Snack Pellet Equipment Analysis and Outlook
9.1. North America Snack Pellet Equipment Revenue (USD Million) by Segments (2021-2032)
9.1.1. North America Snack Pellet Equipment Revenue (USD Million) by Type (2021-2032)
9.1.2. North America Snack Pellet Equipment Revenue (USD Million) by Application (2021-2032)
9.1.3. North America Snack Pellet Equipment Revenue (USD Million) by Product (2021-2032)
By Equipment
Extrusion
Mixing
Cutting
Drying
Frying
Seasoning
Others
By Product
Potato
Corn
Rice
Tapioca
Multigrain
Others
By Form
2D
Tridimensional
Die-Face
Chapter 10. Europe Snack Pellet Equipment Analysis and Outlook
10.1. Europe Snack Pellet Equipment Revenue (USD Million), by Segments (USD Million) (2021-2032)
10.1.1. Europe Snack Pellet Equipment Revenue (USD Million) by Type (2021-2032)
10.1.2. Europe Snack Pellet Equipment Revenue (USD Million) by Application (2021-2032)
10.1.3. Europe Snack Pellet Equipment Revenue (USD Million) by Product (2021-2032)
By Equipment
Extrusion
Mixing
Cutting
Drying
Frying
Seasoning
Others
By Product
Potato
Corn
Rice
Tapioca
Multigrain
Others
By Form
2D
Tridimensional
Die-Face
Chapter 11. Asia Pacific Snack Pellet Equipment Analysis and Outlook
11.1. Asia Pacific Snack Pellet Equipment Revenue (USD Million), and Revenue (USD Million) by Segments (2021-2032)
11.1.1. Asia Pacific Snack Pellet Equipment Revenue (USD Million) by Type (2021-2032)
11.1.2. Asia Pacific Snack Pellet Equipment Revenue (USD Million) by Application (2021-2032)
11.1.3. Asia Pacific Snack Pellet Equipment Revenue (USD Million) by Product (2021-2032)
By Equipment
Extrusion
Mixing
Cutting
Drying
Frying
Seasoning
Others
By Product
Potato
Corn
Rice
Tapioca
Multigrain
Others
By Form
2D
Tridimensional
Die-Face
Chapter 12. South America Snack Pellet Equipment Analysis and Outlook
12.1. South America Snack Pellet Equipment Revenue (USD Million), by Segments (2021-2032)
12.1.1. South America Snack Pellet Equipment Revenue (USD Million) by Type (2021-2032)
12.1.2. South America Snack Pellet Equipment Revenue (USD Million) by Application (2021-2032)
12.1.3. South America Snack Pellet Equipment Revenue (USD Million) by Product (2021-2032)
By Equipment
Extrusion
Mixing
Cutting
Drying
Frying
Seasoning
Others
By Product
Potato
Corn
Rice
Tapioca
Multigrain
Others
By Form
2D
Tridimensional
Die-Face
Chapter 13. Middle East and Africa Snack Pellet Equipment Analysis and Outlook
13.1. Middle East and Africa Snack Pellet Equipment Revenue (USD Million), by Segments (2021-2032)
13.1.1. Middle East and Africa Snack Pellet Equipment Revenue (USD Million) by Type (2021-2032)
13.1.2. Middle East and Africa Snack Pellet Equipment Revenue (USD Million) by Application (2021-2032)
13.1.3. Middle East and Africa Snack Pellet Equipment Revenue (USD Million) by Product (2021-2032)
By Equipment
Extrusion
Mixing
Cutting
Drying
Frying
Seasoning
Others
By Product
Potato
Corn
Rice
Tapioca
Multigrain
Others
By Form
2D
Tridimensional
Die-Face
Chapter 14. Snack Pellet Equipment Company Profiles
14.1 Business Overview
14.2 Product Profiles
14.3 SWOT Profiles
14.5 Recent Developments
14.6 Financial Profile
List of Companies
Bühler Group
Clextral SAS
GEA Group AG
Kiremko B.V.
N.P. & Company Inc
15. Methodology and Data Sources
15.1 Customization Offerings
15.2 Subscription Services
15.3 Related Reports
15.4 Publisher Expertise
LIST OF TABLES
Table 1 Market Segmentation Analysis
Table 2 Global Snack Pellet Equipment Market Share of Leading Companies, 2023
Table 3 Product Offerings of Leading Companies
Table 4 Low Growth Scenario Forecasts
Table 5 Reference Case Growth Scenario
Table 6 High Growth Case Scenario
Table 7 Global Snack Pellet Equipment Revenue (USD Million) And CAGR (%) By Type (2021-2032)
Table 8 Global Snack Pellet Equipment Revenue (USD Million) And CAGR (%) By Application (2021-2032)
Table 9 Global Snack Pellet Equipment Revenue (USD Million) And CAGR (%) By Product (2021-2032)
Table 10 Global Snack Pellet Equipment Market Revenue (USD Million) By Regions (2021-2032)
Table 11 Global Snack Pellet Equipment Market Share (%) By Regions (2021-2032)
Table 12 North America Snack Pellet Equipment Revenue (USD Million) By Country (2021-2032)
Table 13 Europe Snack Pellet Equipment Revenue (USD Million) By Country (2021-2032)
Table 14 Asia Pacific Snack Pellet Equipment Revenue (USD Million) By Country (2021-2032)
Table 15 South America Snack Pellet Equipment Revenue (USD Million) By Country (2021-2032)
Table 16 Middle East and Africa Snack Pellet Equipment Revenue (USD Million) By Region (2021-2032)
Table 17 North America Snack Pellet Equipment Revenue (USD Million) By Type (2021-2032)
Table 18 North America Snack Pellet Equipment Revenue (USD Million) By Application (2021-2032)
Table 19 North America Snack Pellet Equipment Revenue (USD Million) By Product (2021-2032)
Table 20 Europe Snack Pellet Equipment Revenue (USD Million) By Type (2021-2032)
Table 21 Europe Snack Pellet Equipment Revenue (USD Million) By Application (2021-2032)
Table 22 Europe Snack Pellet Equipment Revenue (USD Million) By Product (2021-2032)
Table 23 Asia Pacific Snack Pellet Equipment Revenue (USD Million) By Type (2021-2032)
Table 24 Asia Pacific Snack Pellet Equipment Revenue (USD Million) By Application (2021-2032)
Table 25 Asia Pacific Snack Pellet Equipment Revenue (USD Million) By Product (2021-2032)
Table 26 South America Snack Pellet Equipment Revenue (USD Million) By Type (2021-2032)
Table 27 South America Snack Pellet Equipment Revenue (USD Million) By Application (2021-2032)
Table 28 South America Snack Pellet Equipment Revenue (USD Million) By Product (2021-2032)
Table 29 Middle East and Africa Snack Pellet Equipment Revenue (USD Million) By Type (2021-2032)
Table 30 Middle East and Africa Snack Pellet Equipment Revenue (USD Million) By Application (2021-2032)
Table 31 Middle East and Africa Snack Pellet Equipment Revenue (USD Million) By Product (2021-2032)
LIST OF FIGURES
Figure 1. Market Scope
Figure 2. Pricing Forecasts Per Unit, 2023- 2032
Figure 3. Porter’s Five Forces
Figure 4. Global Snack Pellet Equipment Market Revenue (USD Million) By Regions (2021-2032)
Figure 5. Global Snack Pellet Equipment Market Share (%) By Regions (2023)
Figure 6. North America Snack Pellet Equipment Revenue (USD Million) By Country (2021-2032)
Figure 7. United States Snack Pellet Equipment Revenue (USD Million) By Country (2021-2032)
Figure 8. Canada Snack Pellet Equipment Revenue (USD Million) By Country (2021-2032)
Figure 9. Mexico Snack Pellet Equipment Revenue (USD Million) By Country (2021-2032)
Figure 10. Europe Snack Pellet Equipment Revenue (USD Million) By Country (2021-2032)
Figure 11. Germany Snack Pellet Equipment Revenue (USD Million) By Country (2021-2032)
Figure 12. France Snack Pellet Equipment Revenue (USD Million) By Country (2021-2032)
Figure 13. United Kingdom Snack Pellet Equipment Revenue (USD Million) By Country (2021-2032)
Figure 14. Spain Snack Pellet Equipment Revenue (USD Million) By Country (2021-2032)
Figure 15. Italy Snack Pellet Equipment Revenue (USD Million) By Country (2021-2032)
Figure 16. Russia Snack Pellet Equipment Revenue (USD Million) By Country (2021-2032)
Figure 17. Rest of Europe Snack Pellet Equipment Revenue (USD Million) By Country (2021-2032)
Figure 11. Asia Pacific Snack Pellet Equipment Revenue (USD Million) By Country (2021-2032)
Figure 12. China Snack Pellet Equipment Revenue (USD Million) By Country (2021-2032)
Figure 13. Japan Snack Pellet Equipment Revenue (USD Million) By Country (2021-2032)
Figure 14. India Snack Pellet Equipment Revenue (USD Million) By Country (2021-2032)
Figure 15. South Korea Snack Pellet Equipment Revenue (USD Million) By Country (2021-2032)
Figure 16. Australia Snack Pellet Equipment Revenue (USD Million) By Country (2021-2032)
Figure 17. South East Asia Snack Pellet Equipment Revenue (USD Million) By Country (2021-2032)
Figure 18. South America Snack Pellet Equipment Revenue (USD Million) By Country (2021-2032)
Figure 19. Brazil Snack Pellet Equipment Revenue (USD Million) By Country (2021-2032)
Figure 20. Argentina Snack Pellet Equipment Revenue (USD Million) By Country (2021-2032)
Figure 21. Rest of Asia Pacific Snack Pellet Equipment Revenue (USD Million) By Country (2021-2032)
Figure 22. Middle East and Africa Snack Pellet Equipment Revenue (USD Million) By Region (2021-2032)
Figure 23. Saudi Arabia Snack Pellet Equipment Revenue (USD Million) By Region (2021-2032)
Figure 24. The UAE Snack Pellet Equipment Revenue (USD Million) By Region (2021-2032)
Figure 25. Rest of Middle East Snack Pellet Equipment Revenue (USD Million) By Region (2021-2032)
Figure 26. South Africa Snack Pellet Equipment Revenue (USD Million) By Region (2021-2032)
Figure 27. Africa Snack Pellet Equipment Revenue (USD Million) By Region (2021-2032)
Figure 28. North America Snack Pellet Equipment Revenue (USD Million) By Type (2021-2032)
Figure 29. North America Snack Pellet Equipment Revenue (USD Million) By Application (2021-2032)
Figure 30. North America Snack Pellet Equipment Revenue (USD Million) By Product (2021-2032)
Figure 31. Europe Snack Pellet Equipment Revenue (USD Million) By Type (2021-2032)
Figure 32. Europe Snack Pellet Equipment Revenue (USD Million) By Application (2021-2032)
Figure 33. Europe Snack Pellet Equipment Revenue (USD Million) By Product (2021-2032)
Figure 34. Asia Pacific Snack Pellet Equipment Revenue (USD Million) By Type (2021-2032)
Figure 35. Asia Pacific Snack Pellet Equipment Revenue (USD Million) By Application (2021-2032)
Figure 36. Asia Pacific Snack Pellet Equipment Revenue (USD Million) By Product (2021-2032)
Figure 37. South America Snack Pellet Equipment Revenue (USD Million) By Type (2021-2032)
Figure 38. South America Snack Pellet Equipment Revenue (USD Million) By Application (2021-2032)
Figure 39. South America Snack Pellet Equipment Revenue (USD Million) By Product (2021-2032)
Figure 40. Middle East and Africa Snack Pellet Equipment Revenue (USD Million) By Type (2021-2032)
Figure 41. Middle East and Africa Snack Pellet Equipment Revenue (USD Million) By Application (2021-2032)
Figure 42. Middle East and Africa Snack Pellet Equipment Revenue (USD Million) By Product (2021-2032)
By Equipment
Extrusion
Mixing
Cutting
Drying
Frying
Seasoning
Others
By Product
Potato
Corn
Rice
Tapioca
Multigrain
Others
By Form
2D
Tridimensional
Die-Face
Countries Analyzed
North America (US, Canada, Mexico)
Europe (Germany, UK, France, Spain, Italy, Russia, Rest of Europe)
Asia Pacific (China, India, Japan, South Korea, Australia, South East Asia, Rest of Asia)
South America (Brazil, Argentina, Rest of South America)
Middle East and Africa (Saudi Arabia, UAE, Rest of Middle East, South Africa, Egypt, Rest of Africa)
