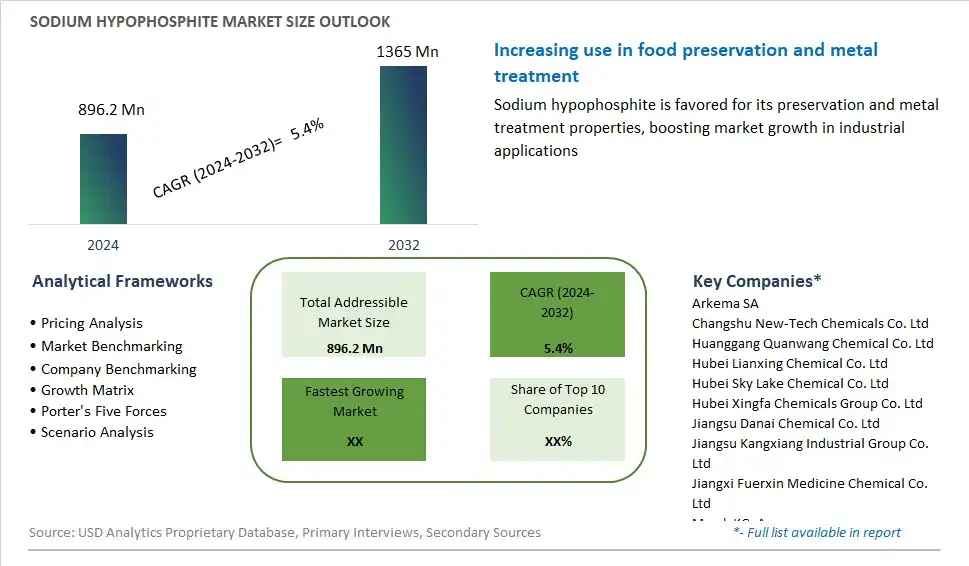
Global Sodium Hypophosphite Market Size is valued at $896.2 Million in 2024 and is forecast to register a growth rate (CAGR) of 5.4% to reach $1365 Million by 2032.
The global Sodium Hypophosphite Market Comprehensive Study analyzes and forecasts the market size across 6 regions and 24 countries for diverse segments -By Function (Reducing agents, Catalysts & stabilizers, Chemical intermediates, Others), By Grade (Electrical, Industrial, Others), By Application (Electroplating, Water treatment, Chemicals & pharmaceuticals, Others)
An Introduction to Sodium Hypophosphite Market
Sodium hypophosphite is an inorganic compound used in various industrial applications, including electroplating, flame retardants, and water treatment, in 2024. As a reducing agent, sodium hypophosphite is employed in electroless nickel plating processes to deposit a uniform layer of nickel onto metal substrates, providing corrosion resistance and wear protection. In flame retardant formulations, sodium hypophosphite acts as a flame suppressant, inhibiting the ignition and spread of fires in plastics, textiles, and building materials. Additionally, sodium hypophosphite is used in water treatment applications to remove heavy metals and cyanides from wastewater, contributing to environmental protection and regulatory compliance. With increasing demand for advanced materials, functional coatings, and environmental solutions, the market for sodium hypophosphite is expanding, driven by innovations in production methods, application technologies, and regulatory standards that enable manufacturers to meet industry requirements and customer needs for performance, safety, and sustainability.
Sodium Hypophosphite Competitive Landscape
The market report analyses the leading companies in the industry including Arkema SA, Changshu New-Tech Chemicals Co. Ltd, Huanggang Quanwang Chemical Co. Ltd, Hubei Lianxing Chemical Co. Ltd, Hubei Sky Lake Chemical Co. Ltd, Hubei Xingfa Chemicals Group Co. Ltd, Jiangsu Danai Chemical Co. Ltd, Jiangsu Kangxiang Industrial Group Co. Ltd, Jiangxi Fuerxin Medicine Chemical Co. Ltd, Merck KGaA, Nippon Chemical Industrial Co. Ltd, Solvay S.A., and Others.
Sodium Hypophosphite Market Dynamics
Sodium Hypophosphite Market Trend: Increased Demand for Sodium Hypophosphite in Various Industries
One of the most prominent market trends for sodium hypophosphite is the increased demand across various industries. Sodium hypophosphite is a versatile chemical compound widely used as a reducing agent, catalyst, and flame retardant in industries such as electronics, chemical manufacturing, water treatment, and agriculture. In recent years, there has been a growing need for sodium hypophosphite due to its diverse applications and beneficial properties. Industries are increasingly recognizing the value of sodium hypophosphite in processes such as electroless plating, flame retardant formulations, and as a source of phosphorus for plant nutrition. This trend is expected to continue as industries seek innovative solutions to enhance product performance, efficiency, and safety.
Market Driver: Growing Demand for Electroless Plating Applications
A significant market driver for sodium hypophosphite is the growing demand for electroless plating applications. Electroless plating is a widely used process in industries such as automotive, aerospace, electronics, and telecommunications for depositing uniform and adherent metal coatings onto various substrates. Sodium hypophosphite serves as a key component in the electroless plating process, functioning as a reducing agent to facilitate the deposition of metals such as nickel, copper, and palladium onto surfaces without the need for electrical current. With the increasing adoption of electroless plating for corrosion protection, surface finishing, and functional coatings, the demand for sodium hypophosphite as a vital ingredient in plating solutions is expected to rise significantly, driving market growth in the coming years.
Market Opportunity: Expansion of Flame Retardant Applications
An opportunity within the sodium hypophosphite market lies in the expansion of flame retardant applications. Sodium hypophosphite is widely utilized as a flame retardant additive in various materials such as plastics, polymers, textiles, and coatings to improve fire safety and meet stringent regulatory standards. As the emphasis on fire safety and sustainability continues to increase globally, there is a growing demand for innovative flame retardant solutions that offer effective fire protection while minimizing environmental impact. Sodium hypophosphite-based flame retardants have shown promise in providing superior flame inhibition properties, low toxicity, and environmental compatibility compared to conventional alternatives. The opportunity for sodium hypophosphite manufacturers lies in developing advanced flame retardant formulations and expanding their applications across industries such as construction, automotive, and electronics to address the growing need for fire-safe materials and comply with stringent safety regulations. By capitalizing on the expanding market for flame retardant solutions, sodium hypophosphite suppliers can unlock new growth opportunities and strengthen their position in the market.
Sodium Hypophosphite Market Share Analysis: Reducing Agents held the dominant market share in 2024
The reducing agents segment holds the largest share in the sodium hypophosphite market due to the extensive use of sodium hypophosphite as a reducing agent in various industrial processes. Sodium hypophosphite serves as a vital component in electroless plating processes, particularly in the metallurgical industry, where it is used to deposit metallic coatings on substrates without the need for electric current. Additionally, sodium hypophosphite functions as a reducing agent in the production of pharmaceuticals, chemicals, and agricultural products, where it facilitates the synthesis of organic compounds and the removal of oxygen from chemical reactions. Its role as a reducing agent offers numerous benefits, including controlled reduction reactions, high purity of deposited metals, and improved product quality. With its versatile applications and essential functions across multiple industries, the reducing agents segment continues to drive demand and dominance in the sodium hypophosphite market.
Sodium Hypophosphite Market Share Analysis: Industrial market is poised to register the fastest growth rae over the forecast period to 2032
The industrial grade segment is experiencing rapid growth in the sodium hypophosphite market due to its diverse applications across various industries. Industrial-grade sodium hypophosphite is widely used as a reducing agent, catalyst, and chemical intermediate in the production of plastics, polymers, flame retardants, water treatment chemicals, and agricultural products. Its role in these industries includes enhancing product performance, improving manufacturing processes, and facilitating the synthesis of complex chemical compounds. Additionally, industrial-grade sodium hypophosphite offers cost-effective solutions for industrial applications, making it increasingly attractive to manufacturers seeking to optimize production costs without compromising quality. With the expanding demand for industrial-grade sodium hypophosphite in key end-use sectors such as automotive, electronics, construction, and agriculture, driven by economic growth and technological advancements, the industrial grade segment is poised for continued growth in the sodium hypophosphite market.
Sodium Hypophosphite Market Share Analysis: Electroplating held the dominant market share in 2024
The electroplating segment holds the largest share in the sodium hypophosphite market due to the extensive use of sodium hypophosphite as a key component in electroless plating processes. Sodium hypophosphite serves as a crucial reducing agent in electroless nickel plating, where it facilitates the deposition of metallic coatings on various substrates without the need for an external electrical current. This application is widely utilized across industries such as automotive, electronics, aerospace, and metallurgy to enhance the corrosion resistance, wear resistance, and surface finish of components. Additionally, the electroplating industry's stringent quality standards and requirements for consistent plating performance further drive the demand for high-quality sodium hypophosphite. With the continuous expansion of industries requiring electroplated components and the ongoing technological advancements in electroless plating processes, the electroplating segment remains the dominant application in the sodium hypophosphite market.
Sodium Hypophosphite Market Segmentation
By Function
Reducing agents
Catalysts & stabilizers
Chemical intermediates
Others
By Grade
Electrical
Industrial
Others
By Application
Electroplating
Water treatment
Chemicals & pharmaceuticals
Others
Countries Analyzed
North America (US, Canada, Mexico)
Europe (Germany, UK, France, Spain, Italy, Russia, Rest of Europe)
Asia Pacific (China, India, Japan, South Korea, Australia, South East Asia, Rest of Asia)
South America (Brazil, Argentina, Rest of South America)
Middle East and Africa (Saudi Arabia, UAE, Rest of Middle East, South Africa, Egypt, Rest of Africa)
Sodium Hypophosphite Companies Profiled in the Study
Arkema SA
Changshu New-Tech Chemicals Co. Ltd
Huanggang Quanwang Chemical Co. Ltd
Hubei Lianxing Chemical Co. Ltd
Hubei Sky Lake Chemical Co. Ltd
Hubei Xingfa Chemicals Group Co. Ltd
Jiangsu Danai Chemical Co. Ltd
Jiangsu Kangxiang Industrial Group Co. Ltd
Jiangxi Fuerxin Medicine Chemical Co. Ltd
Merck KGaA
Nippon Chemical Industrial Co. Ltd
Solvay S.A.
*- List Not Exhaustive
Chapter 1. TABLE OF CONTENTS
Chapter 2. Introduction to Sodium Hypophosphite Market
2.1. Market Overview
2.2. Key Statistics and Report Highlights
2.3. Scope of the Comprehensive Study
2.3.1. Market Definition
2.3.2 Countries and Regions Covered
2.3.3 Research Objective
2.3.4 Units, Currency, and Conversions
2.3.5 Industry Value Chain
2.4. Key Market Segments
2.5. Key Companies
2.6. Study Period
Chapter 3. Strategic Analysis Review
3.1. Sodium Hypophosphite Pricing Analysis and Forecast
3.2. Porter’s Five Forces
3.3. Market Ecosystem
3.4. SWOT Analysis
3.5. Regulatory Scenario
3.3. Effects of Inflation, Russia-Ukraine War, moderating economic growth, and other macroeconomic factors
Chapter 4. Competitive Landscape
4.1. Market Share Analysis
4.1.1. Global Sodium Hypophosphite Market Share by Company, 2023
4.1.2. Product Offerings of Leading Sodium Hypophosphite Companies
4.2. Market Entropy
4.2.1. New Product Launches in the Industry
4.2.2. Mergers, Acquisitions, Joint ventures, and Partnerships
4.3. Key Strategies and Best Practices
Chapter 5. Global Market Projections: Best, Reference, and Low Case Scenarios
5.1. Growth Analysis- Case Scenario Definitions
5.2. Low Growth Case Scenario Forecasts
5.3. Reference Growth Case Scenario Forecasts
5.4. High Growth Case Scenario Forecasts
Chapter 6. Market Dynamics
6.1. Sodium Hypophosphite Market Drivers
6.2. Sodium Hypophosphite Market Challenges
6.6. Sodium Hypophosphite Market Opportunities
6.4. Sodium Hypophosphite Market Trends
Chapter 7. Global Sodium Hypophosphite Market Outlook Trends
7.1. Global Sodium Hypophosphite Revenue (USD Million) and CAGR (%) by Type (2021-2032)
7.2. Global Sodium Hypophosphite Revenue (USD Million) and CAGR (%) by Application (2021-2032)
7.3. Global Sodium Hypophosphite Revenue (USD Million) and CAGR (%) by Product (2021-2032)
By Function
Reducing agents
Catalysts & stabilizers
Chemical intermediates
Others
By Grade
Electrical
Industrial
Others
By Application
Electroplating
Water treatment
Chemicals & pharmaceuticals
Others
Chapter 8. Global Sodium Hypophosphite Regional Analysis and Outlook
8.1. Global Sodium Hypophosphite Revenue (USD Million) By Regions (2021- 2032)
8.2. North America Sodium Hypophosphite Revenue (USD Million) by Country (2021-2032)
8.2.1. United States Sodium Hypophosphite Regional Analysis and Outlook
8.2.2. Canada Sodium Hypophosphite Regional Analysis and Outlook
8.2.3. Mexico Sodium Hypophosphite Regional Analysis and Outlook
8.3. Europe Sodium Hypophosphite Revenue (USD Million), by Country (2021-2032)
8.3.1. Germany Sodium Hypophosphite Regional Analysis and Outlook
8.3.2. France Sodium Hypophosphite Regional Analysis and Outlook
8.3.3. United Kingdom Sodium Hypophosphite Regional Analysis and Outlook
8.3.4. Spain Sodium Hypophosphite Regional Analysis and Outlook
8.3.5. Italy Sodium Hypophosphite Regional Analysis and Outlook
8.3.6. Russia Sodium Hypophosphite Regional Analysis and Outlook
8.3.7. Rest of Europe Sodium Hypophosphite Regional Analysis and Outlook
8.4. Asia Pacific Sodium Hypophosphite Revenue (USD Million) by Country (2021-2032)
8.4.1. China Sodium Hypophosphite Regional Analysis and Outlook
8.4.2. Japan Sodium Hypophosphite Regional Analysis and Outlook
8.4.3. India Sodium Hypophosphite Regional Analysis and Outlook
8.4.4. South Korea Sodium Hypophosphite Regional Analysis and Outlook
8.4.5. Australia Sodium Hypophosphite Regional Analysis and Outlook
8.4.6. South East Asia Sodium Hypophosphite Regional Analysis and Outlook
8.4.7. Rest of Asia Pacific Sodium Hypophosphite Regional Analysis and Outlook
8.5. South America Sodium Hypophosphite Revenue (USD Million), by Country (2021-2032)
8.5.1. Brazil Sodium Hypophosphite Regional Analysis and Outlook
8.5.2. Argentina Sodium Hypophosphite Regional Analysis and Outlook
8.5.3. Rest of South America Sodium Hypophosphite Regional Analysis and Outlook
8.6. Middle East and Africa Sodium Hypophosphite Revenue (USD Million) by Country (2021-2032)
8.6.1. Middle East Sodium Hypophosphite Regional Analysis and Outlook
8.6.2. Africa Sodium Hypophosphite Regional Analysis and Outlook
Chapter 9. North America Sodium Hypophosphite Analysis and Outlook
9.1. North America Sodium Hypophosphite Revenue (USD Million) by Segments (2021-2032)
9.1.1. North America Sodium Hypophosphite Revenue (USD Million) by Type (2021-2032)
9.1.2. North America Sodium Hypophosphite Revenue (USD Million) by Application (2021-2032)
9.1.3. North America Sodium Hypophosphite Revenue (USD Million) by Product (2021-2032)
By Function
Reducing agents
Catalysts & stabilizers
Chemical intermediates
Others
By Grade
Electrical
Industrial
Others
By Application
Electroplating
Water treatment
Chemicals & pharmaceuticals
Others
Chapter 10. Europe Sodium Hypophosphite Analysis and Outlook
10.1. Europe Sodium Hypophosphite Revenue (USD Million), by Segments (USD Million) (2021-2032)
10.1.1. Europe Sodium Hypophosphite Revenue (USD Million) by Type (2021-2032)
10.1.2. Europe Sodium Hypophosphite Revenue (USD Million) by Application (2021-2032)
10.1.3. Europe Sodium Hypophosphite Revenue (USD Million) by Product (2021-2032)
By Function
Reducing agents
Catalysts & stabilizers
Chemical intermediates
Others
By Grade
Electrical
Industrial
Others
By Application
Electroplating
Water treatment
Chemicals & pharmaceuticals
Others
Chapter 11. Asia Pacific Sodium Hypophosphite Analysis and Outlook
11.1. Asia Pacific Sodium Hypophosphite Revenue (USD Million), and Revenue (USD Million) by Segments (2021-2032)
11.1.1. Asia Pacific Sodium Hypophosphite Revenue (USD Million) by Type (2021-2032)
11.1.2. Asia Pacific Sodium Hypophosphite Revenue (USD Million) by Application (2021-2032)
11.1.3. Asia Pacific Sodium Hypophosphite Revenue (USD Million) by Product (2021-2032)
By Function
Reducing agents
Catalysts & stabilizers
Chemical intermediates
Others
By Grade
Electrical
Industrial
Others
By Application
Electroplating
Water treatment
Chemicals & pharmaceuticals
Others
Chapter 12. South America Sodium Hypophosphite Analysis and Outlook
12.1. South America Sodium Hypophosphite Revenue (USD Million), by Segments (2021-2032)
12.1.1. South America Sodium Hypophosphite Revenue (USD Million) by Type (2021-2032)
12.1.2. South America Sodium Hypophosphite Revenue (USD Million) by Application (2021-2032)
12.1.3. South America Sodium Hypophosphite Revenue (USD Million) by Product (2021-2032)
By Function
Reducing agents
Catalysts & stabilizers
Chemical intermediates
Others
By Grade
Electrical
Industrial
Others
By Application
Electroplating
Water treatment
Chemicals & pharmaceuticals
Others
Chapter 13. Middle East and Africa Sodium Hypophosphite Analysis and Outlook
13.1. Middle East and Africa Sodium Hypophosphite Revenue (USD Million), by Segments (2021-2032)
13.1.1. Middle East and Africa Sodium Hypophosphite Revenue (USD Million) by Type (2021-2032)
13.1.2. Middle East and Africa Sodium Hypophosphite Revenue (USD Million) by Application (2021-2032)
13.1.3. Middle East and Africa Sodium Hypophosphite Revenue (USD Million) by Product (2021-2032)
By Function
Reducing agents
Catalysts & stabilizers
Chemical intermediates
Others
By Grade
Electrical
Industrial
Others
By Application
Electroplating
Water treatment
Chemicals & pharmaceuticals
Others
Chapter 14. Sodium Hypophosphite Company Profiles
14.1 Business Overview
14.2 Product Profiles
14.3 SWOT Profiles
14.5 Recent Developments
14.6 Financial Profile
List of Companies
Arkema SA
Changshu New-Tech Chemicals Co. Ltd
Huanggang Quanwang Chemical Co. Ltd
Hubei Lianxing Chemical Co. Ltd
Hubei Sky Lake Chemical Co. Ltd
Hubei Xingfa Chemicals Group Co. Ltd
Jiangsu Danai Chemical Co. Ltd
Jiangsu Kangxiang Industrial Group Co. Ltd
Jiangxi Fuerxin Medicine Chemical Co. Ltd
Merck KGaA
Nippon Chemical Industrial Co. Ltd
Solvay S.A.
15. Methodology and Data Sources
15.1 Customization Offerings
15.2 Subscription Services
15.3 Related Reports
15.4 Publisher Expertise
LIST OF TABLES
Table 1 Market Segmentation Analysis
Table 2 Global Sodium Hypophosphite Market Share of Leading Companies, 2023
Table 3 Product Offerings of Leading Companies
Table 4 Low Growth Scenario Forecasts
Table 5 Reference Case Growth Scenario
Table 6 High Growth Case Scenario
Table 7 Global Sodium Hypophosphite Revenue (USD Million) And CAGR (%) By Type (2021-2032)
Table 8 Global Sodium Hypophosphite Revenue (USD Million) And CAGR (%) By Application (2021-2032)
Table 9 Global Sodium Hypophosphite Revenue (USD Million) And CAGR (%) By Product (2021-2032)
Table 10 Global Sodium Hypophosphite Market Revenue (USD Million) By Regions (2021-2032)
Table 11 Global Sodium Hypophosphite Market Share (%) By Regions (2021-2032)
Table 12 North America Sodium Hypophosphite Revenue (USD Million) By Country (2021-2032)
Table 13 Europe Sodium Hypophosphite Revenue (USD Million) By Country (2021-2032)
Table 14 Asia Pacific Sodium Hypophosphite Revenue (USD Million) By Country (2021-2032)
Table 15 South America Sodium Hypophosphite Revenue (USD Million) By Country (2021-2032)
Table 16 Middle East and Africa Sodium Hypophosphite Revenue (USD Million) By Region (2021-2032)
Table 17 North America Sodium Hypophosphite Revenue (USD Million) By Type (2021-2032)
Table 18 North America Sodium Hypophosphite Revenue (USD Million) By Application (2021-2032)
Table 19 North America Sodium Hypophosphite Revenue (USD Million) By Product (2021-2032)
Table 20 Europe Sodium Hypophosphite Revenue (USD Million) By Type (2021-2032)
Table 21 Europe Sodium Hypophosphite Revenue (USD Million) By Application (2021-2032)
Table 22 Europe Sodium Hypophosphite Revenue (USD Million) By Product (2021-2032)
Table 23 Asia Pacific Sodium Hypophosphite Revenue (USD Million) By Type (2021-2032)
Table 24 Asia Pacific Sodium Hypophosphite Revenue (USD Million) By Application (2021-2032)
Table 25 Asia Pacific Sodium Hypophosphite Revenue (USD Million) By Product (2021-2032)
Table 26 South America Sodium Hypophosphite Revenue (USD Million) By Type (2021-2032)
Table 27 South America Sodium Hypophosphite Revenue (USD Million) By Application (2021-2032)
Table 28 South America Sodium Hypophosphite Revenue (USD Million) By Product (2021-2032)
Table 29 Middle East and Africa Sodium Hypophosphite Revenue (USD Million) By Type (2021-2032)
Table 30 Middle East and Africa Sodium Hypophosphite Revenue (USD Million) By Application (2021-2032)
Table 31 Middle East and Africa Sodium Hypophosphite Revenue (USD Million) By Product (2021-2032)
LIST OF FIGURES
Figure 1. Market Scope
Figure 2. Pricing Forecasts Per Unit, 2023- 2032
Figure 3. Porter’s Five Forces
Figure 4. Global Sodium Hypophosphite Market Revenue (USD Million) By Regions (2021-2032)
Figure 5. Global Sodium Hypophosphite Market Share (%) By Regions (2023)
Figure 6. North America Sodium Hypophosphite Revenue (USD Million) By Country (2021-2032)
Figure 7. United States Sodium Hypophosphite Revenue (USD Million) By Country (2021-2032)
Figure 8. Canada Sodium Hypophosphite Revenue (USD Million) By Country (2021-2032)
Figure 9. Mexico Sodium Hypophosphite Revenue (USD Million) By Country (2021-2032)
Figure 10. Europe Sodium Hypophosphite Revenue (USD Million) By Country (2021-2032)
Figure 11. Germany Sodium Hypophosphite Revenue (USD Million) By Country (2021-2032)
Figure 12. France Sodium Hypophosphite Revenue (USD Million) By Country (2021-2032)
Figure 13. United Kingdom Sodium Hypophosphite Revenue (USD Million) By Country (2021-2032)
Figure 14. Spain Sodium Hypophosphite Revenue (USD Million) By Country (2021-2032)
Figure 15. Italy Sodium Hypophosphite Revenue (USD Million) By Country (2021-2032)
Figure 16. Russia Sodium Hypophosphite Revenue (USD Million) By Country (2021-2032)
Figure 17. Rest of Europe Sodium Hypophosphite Revenue (USD Million) By Country (2021-2032)
Figure 11. Asia Pacific Sodium Hypophosphite Revenue (USD Million) By Country (2021-2032)
Figure 12. China Sodium Hypophosphite Revenue (USD Million) By Country (2021-2032)
Figure 13. Japan Sodium Hypophosphite Revenue (USD Million) By Country (2021-2032)
Figure 14. India Sodium Hypophosphite Revenue (USD Million) By Country (2021-2032)
Figure 15. South Korea Sodium Hypophosphite Revenue (USD Million) By Country (2021-2032)
Figure 16. Australia Sodium Hypophosphite Revenue (USD Million) By Country (2021-2032)
Figure 17. South East Asia Sodium Hypophosphite Revenue (USD Million) By Country (2021-2032)
Figure 18. South America Sodium Hypophosphite Revenue (USD Million) By Country (2021-2032)
Figure 19. Brazil Sodium Hypophosphite Revenue (USD Million) By Country (2021-2032)
Figure 20. Argentina Sodium Hypophosphite Revenue (USD Million) By Country (2021-2032)
Figure 21. Rest of Asia Pacific Sodium Hypophosphite Revenue (USD Million) By Country (2021-2032)
Figure 22. Middle East and Africa Sodium Hypophosphite Revenue (USD Million) By Region (2021-2032)
Figure 23. Saudi Arabia Sodium Hypophosphite Revenue (USD Million) By Region (2021-2032)
Figure 24. The UAE Sodium Hypophosphite Revenue (USD Million) By Region (2021-2032)
Figure 25. Rest of Middle East Sodium Hypophosphite Revenue (USD Million) By Region (2021-2032)
Figure 26. South Africa Sodium Hypophosphite Revenue (USD Million) By Region (2021-2032)
Figure 27. Africa Sodium Hypophosphite Revenue (USD Million) By Region (2021-2032)
Figure 28. North America Sodium Hypophosphite Revenue (USD Million) By Type (2021-2032)
Figure 29. North America Sodium Hypophosphite Revenue (USD Million) By Application (2021-2032)
Figure 30. North America Sodium Hypophosphite Revenue (USD Million) By Product (2021-2032)
Figure 31. Europe Sodium Hypophosphite Revenue (USD Million) By Type (2021-2032)
Figure 32. Europe Sodium Hypophosphite Revenue (USD Million) By Application (2021-2032)
Figure 33. Europe Sodium Hypophosphite Revenue (USD Million) By Product (2021-2032)
Figure 34. Asia Pacific Sodium Hypophosphite Revenue (USD Million) By Type (2021-2032)
Figure 35. Asia Pacific Sodium Hypophosphite Revenue (USD Million) By Application (2021-2032)
Figure 36. Asia Pacific Sodium Hypophosphite Revenue (USD Million) By Product (2021-2032)
Figure 37. South America Sodium Hypophosphite Revenue (USD Million) By Type (2021-2032)
Figure 38. South America Sodium Hypophosphite Revenue (USD Million) By Application (2021-2032)
Figure 39. South America Sodium Hypophosphite Revenue (USD Million) By Product (2021-2032)
Figure 40. Middle East and Africa Sodium Hypophosphite Revenue (USD Million) By Type (2021-2032)
Figure 41. Middle East and Africa Sodium Hypophosphite Revenue (USD Million) By Application (2021-2032)
Figure 42. Middle East and Africa Sodium Hypophosphite Revenue (USD Million) By Product (2021-2032)
By Function
Reducing agents
Catalysts & stabilizers
Chemical intermediates
Others
By Grade
Electrical
Industrial
Others
By Application
Electroplating
Water treatment
Chemicals & pharmaceuticals
Others
Countries Analyzed
North America (US, Canada, Mexico)
Europe (Germany, UK, France, Spain, Italy, Russia, Rest of Europe)
Asia Pacific (China, India, Japan, South Korea, Australia, South East Asia, Rest of Asia)
South America (Brazil, Argentina, Rest of South America)
Middle East and Africa (Saudi Arabia, UAE, Rest of Middle East, South Africa, Egypt, Rest of Africa)
