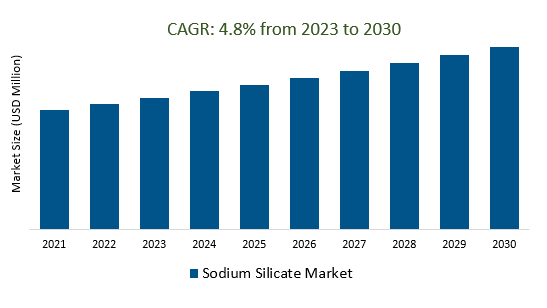
According to USD Analytics the Global Sodium Silicate Market is projected to register a 4.8% CAGR from 2025 to 2034.
The Sodium Silicate Market is driven by various factors, including growing industrial applications, environmental concerns, water treatment demand, manufacturing innovations, customization, digitalization, sustainability, circular economy, collaborations, quality control, market expansion, and product innovation. Sodium silicate is used in various industries, such as detergents, construction materials, and water treatment. It is also used in water treatment processes, where it helps reduce waste and energy consumption. Advances in manufacturing technologies, such as Industry 4.0 and automation, are driving the adoption of intelligent solutions. Additionally, the market is expanding geographically, with growing demand in regions like Asia-Pacific. Continuous research and development efforts are leading to product innovations that offer improved performance and versatility for various applications.
Rising Demand for Smart Sodium Silicate in Expanding Industrial Sectors is boosting the market.
The sodium silicate market is experiencing a significant upswing in demand due to its utilization in expanding industrial sectors. As industries evolve and grow, there is a rising need for smart sodium silicate solutions. This versatile compound finds applications in a wide array of sectors, including manufacturing, construction, and the automotive industry. Its role as a binding agent, adhesive, and corrosion inhibitor has made it a key player in ensuring product integrity and durability. The expanding industrial landscape is driving innovation in sodium silicate products, further fuelling market growth. Consequently, the sodium silicate market is poised for continued expansion and diversification, catering to the ever-evolving needs of industrial sectors.
Surging Demand for Sodium Silicate in Water Treatment for Clean and Safe Water Sources.
The sodium silicate market is experiencing a remarkable surge in demand, primarily driven by its crucial role in water treatment. With growing concerns about clean and safe water sources, sodium silicate has become an essential component in the treatment process. Its chemical properties enable it to effectively bind to impurities and contaminants, facilitating their removal. This increasing reliance on sodium silicate has led to a substantial expansion in its market share, with water treatment facilities and industries recognizing its significance in ensuring access to pure and safe drinking water. As environmental and health concerns intensify, the sodium silicate market's growth trajectory is expected to persist, further establishing its pivotal role in maintaining water quality standards.
Sodium Silicate Production with Industry 4.0 and Automation Innovations is creating a demand in the market.
The integration of Industry 4.0 and automation innovations into sodium silicate production processes has brought about a remarkable transformation in the industry. This synergy of cutting-edge technology is streamlining manufacturing operations, enhancing efficiency, and reducing human intervention. As a result, the sodium silicate market is experiencing a surge in demand, driven by these advancements. Industry 4.0 technologies, such as IoT sensors and data analytics, enable real-time monitoring of production parameters, ensuring consistent quality. Automation innovations have optimized resource utilization and minimized wastage, making sodium silicate production more sustainable. This growing demand signifies the increasing importance of smart manufacturing solutions in shaping the future of the chemical industry.
Market Share Analysis:
Liquid sodium silicate holds a preeminent position within the sodium silicate market due to its wide-ranging applications and versatile properties.
The clear and viscous solution, composed of sodium oxide and silica, boasts exceptional chemical stability, making it indispensable across various industries. It serves as a fundamental raw material in the manufacturing of detergents, adhesives, and catalysts. Its adhesive qualities make it a critical component in the construction and automotive sectors, contributing to its widespread use in cement production, metal casting, and even the formation of fire-resistant coatings. Furthermore, its integral role in wastewater treatment and as a binder in foundry operations solidify its status as the market leader. Liquid sodium silicate's unrivalled versatility and economic viability continue to drive its dominance in the sodium silicate landscape.
Detergents is the most dominant application in the sodium silicate market.
In the vast landscape of the sodium silicate market, one application reigns supreme - detergents. This versatile chemical compound finds its most dominant role in the formulation of detergents, where its unique properties are harnessed to tackle a myriad of cleaning challenges. Sodium silicate, commonly known as liquid glass, serves as a binding and stabilizing agent in detergent formulations, enhancing their cleaning efficacy. Its alkaline nature makes it ideal for breaking down stubborn stains, grease, and grime, while its water-softening capabilities enable it to boost detergent performance in hard water areas. The widespread use of sodium silicate in laundry and dishwashing detergents underscores its indispensability in our daily lives, ensuring cleaner, brighter, and more sanitary households.
Crystalline sodium silicate stands as the reigning force within the sodium silicate market, holding a preeminent position in its chemical composition.
The distinctive crystalline structure sets it apart, offering exceptional versatility and performance across various industrial applications. This crystalline form boasts remarkable stability, making it a preferred choice for numerous sectors such as detergents, construction, and metallurgy. Its widespread usage can be attributed to its excellent binding properties, contributing to the strength and durability of products where it is employed. In addition to its remarkable structural attributes, crystalline sodium silicate also serves as an essential ingredient in the manufacturing of adhesives, catalysts, and coatings, further solidifying its pivotal role in the global market. With its remarkable properties and diverse applications, crystalline sodium silicate continues to reign supreme as a cornerstone of the sodium silicate industry, shaping the landscape of modern manufacturing and technology.
The Asia Pacific region stands as the undisputed leader in the sodium silicate market.
With its robust industrial base and expanding manufacturing sector, this region exerts a significant influence on global sodium silicate production and consumption. Countries such as China and India, known for their burgeoning industries, contribute substantially to this dominance. The availability of abundant raw materials, coupled with a skilled labour force, positions the Asia Pacific region as a primary hub for sodium silicate manufacturing. Furthermore, the growing demand for sodium silicate in various applications, including detergents, cement, and water treatment, bolsters its prominence in the Asia Pacific. This region's strategic location and trade partnerships also facilitate its role as a central player in the global sodium silicate market, making it a focal point for industry stakeholders and investors worldwide.
Sodium Silicate Market Segmentation
By Type
By Application
- Adhesives and Paints
- Detergents
- Food Preservation
- Precipitated Silica
- Paper Production
- Water Treatment
- Others
By Form
By Region
- North America (United States, Canada, Mexico)
- Europe (Germany, France, United Kingdom, Spain, Italy, Others)
- Asia Pacific (China, India, Japan, South Korea, Australia, Others)
- Latin America (Brazil, Argentina, Others)
- Middle East and Africa (Saudi Arabia, UAE, Kuwait, Other Middle East, South Africa, Nigeria, Other Africa)
Sodium Silicate Market companies
- Evonik Industries AG
- PQ Corporation
- CIECH Group
- BASF SE
- Solvay S.A
- PPG Industries Inc
- W.R. Grace & Company
- IQE Group
- Tokuyama Corporation
- Occidental Petroleum Corporation
- Sinchem Silica Gel Co Ltd
- Shangyu Huachang Industrial Co Ltd
- Nippon Chemical Industrial Co Ltd
- Huber Engineered Materials
- Shijiazhuang Shuanglian Chemical Industry Co Ltd
* List not exhaustive
Sodium Silicate Market Outlook 2025
1 Market Overview
1.1 Introduction to the Sodium Silicate Market
1.2 Scope of the Study
1.3 Research Objective
1.3.1 Key Market Scope and Segments
1.3.2 Players Covered
1.3.3 Years Considered
2 Executive Summary
2.1 2023 Sodium Silicate Industry- Market Statistics
3 Market Dynamics
3.1 Market Drivers
3.2 Market Challenges
3.3 Market Opportunities
3.4 Market Trends
4 Market Factor Analysis
4.1 Porter’s Five Forces
4.2 Market Entropy
4.2.1 Global Sodium Silicate Market Companies with Area Served
4.2.2 Products Offerings Global Sodium Silicate Market
5 COVID-19 Impact Analysis and Outlook Scenarios
5.1.1 Covid-19 Impact Analysis
5.1.2 post-COVID-19 Scenario- Low Growth Case
5.1.3 post-COVID-19 Scenario- Reference Growth Case
5.1.4 post-COVID-19 Scenario- Low Growth Case
6 Global Sodium Silicate Market Trends
6.1 Global Sodium Silicate Revenue (USD Million) and CAGR (%) by Type (2018-2030)
6.2 Global Sodium Silicate Revenue (USD Million) and CAGR (%) by Applications (2018-2030)
6.3 Global Sodium Silicate Revenue (USD Million) and CAGR (%) by regions (2018-2030)
7 Global Sodium Silicate Market Revenue (USD Million) by Type, and Applications (2019-2024)
7.1 Global Sodium Silicate Revenue (USD Million) by Type (2019-2024)
7.1.1 Global Sodium Silicate Revenue (USD Million), Market Share (%) by Type (2019-2024)
7.2 Global Sodium Silicate Revenue (USD Million) by Applications (2019-2024)
7.2.1 Global Sodium Silicate Revenue (USD Million), Market Share (%) by Applications (2019-2024)
8 Global Sodium Silicate Development Regional Status and Outlook
8.1 Global Sodium Silicate Revenue (USD Million) By Regions (2019-2024)
8.2 North America Sodium Silicate Revenue (USD Million) by Type, and Application (2019-2024)
8.2.1 North America Sodium Silicate Revenue (USD Million) by Country (2019-2024)
8.2.2 North America Sodium Silicate Revenue (USD Million) by Type (2019-2024)
8.2.3 North America Sodium Silicate Revenue (USD Million) by Applications (2019-2024)
8.3 Europe Sodium Silicate Revenue (USD Million), by Type, and Applications (USD Million) (2019-2024)
8.3.1 Europe Sodium Silicate Revenue (USD Million), by Country (2019-2024)
8.3.2 Europe Sodium Silicate Revenue (USD Million) by Type (2019-2024)
8.3.3 Europe Sodium Silicate Revenue (USD Million) by Applications (2019-2024)
8.4 Asia Pacific Sodium Silicate Revenue (USD Million), and Revenue (USD Million) by Type, and Applications (2019-2024)
8.4.1 Asia Pacific Sodium Silicate Revenue (USD Million) by Country (2019-2024)
8.4.2 Asia Pacific Sodium Silicate Revenue (USD Million) by Type (2019-2024)
8.4.3 Asia Pacific Sodium Silicate Revenue (USD Million) by Applications (2019-2024)
8.5 South America Sodium Silicate Revenue (USD Million), by Type, and Applications (2019-2024)
8.5.1 South America Sodium Silicate Revenue (USD Million), by Country (2019-2024)
8.5.2 South America Sodium Silicate Revenue (USD Million) by Type (2019-2024)
8.5.3 South America Sodium Silicate Revenue (USD Million) by Applications (2019-2024)
8.6 Middle East and Africa Sodium Silicate Revenue (USD Million), by Type, Technology, Application, Thickness (2019-2024)
8.6.1 Middle East and Africa Sodium Silicate Revenue (USD Million) by Country (2019-2024)
8.6.2 Middle East and Africa Sodium Silicate Revenue (USD Million) by Type (2019-2024)
8.6.3 Middle East and Africa Sodium Silicate Revenue (USD Million) by Applications (2019-2024)
9 Company Profiles
10 Global Sodium Silicate Market Revenue (USD Million), by Type, and Applications (2025-2034)
10.1 Global Sodium Silicate Revenue (USD Million) and Market Share (%) by Type (2025-2034)
10.1.1 Global Sodium Silicate Revenue (USD Million), and Market Share (%) by Type (2025-2034)
10.2 Global Sodium Silicate Revenue (USD Million) and Market Share (%) by Applications (2025-2034)
10.2.1 Global Sodium Silicate Revenue (USD Million), and Market Share (%) by Applications (2025-2034)
11 Global Sodium Silicate Development Regional Status and Outlook Forecast
11.1 Global Sodium Silicate Revenue (USD Million) By Regions (2025-2034)
11.2 North America Sodium Silicate Revenue (USD Million) by Type, and Applications (2025-2034)
11.2.1 North America Sodium Silicate Revenue (USD) Million by Country (2025-2034)
11.2.2 North America Sodium Silicate Revenue (USD Million), by Type (2025-2034)
11.2.3 North America Sodium Silicate Revenue (USD Million), Market Share (%) by Applications (2025-2034)
11.3 Europe Sodium Silicate Revenue (USD Million), by Type, and Applications (2025-2034)
11.3.1 Europe Sodium Silicate Revenue (USD Million), by Country (2025-2034)
11.3.2 Europe Sodium Silicate Revenue (USD Million), by Type (2025-2034)
11.3.3 Europe Sodium Silicate Revenue (USD Million), by Applications (2025-2034)
11.4 Asia Pacific Sodium Silicate Revenue (USD Million) by Type, and Applications (2025-2034)
11.4.1 Asia Pacific Sodium Silicate Revenue (USD Million), by Country (2025-2034)
11.4.2 Asia Pacific Sodium Silicate Revenue (USD Million), by Type (2025-2034)
11.4.3 Asia Pacific Sodium Silicate Revenue (USD Million), by Applications (2025-2034)
11.5 South America Sodium Silicate Revenue (USD Million), by Type, and Applications (2025-2034)
11.5.1 South America Sodium Silicate Revenue (USD Million), by Country (2025-2034)
11.5.2 South America Sodium Silicate Revenue (USD Million), by Type (2025-2034)
11.5.3 South America Sodium Silicate Revenue (USD Million), by Applications (2025-2034)
11.6 Middle East and Africa Sodium Silicate Revenue (USD Million), by Type, and Applications (2025-2034)
11.6.1 Middle East and Africa Sodium Silicate Revenue (USD Million), by region (2025-2034)
11.6.2 Middle East and Africa Sodium Silicate Revenue (USD Million), by Type (2025-2034)
11.6.3 Middle East and Africa Sodium Silicate Revenue (USD Million), by Applications (2025-2034)
12 Methodology and Data Sources
12.1 Methodology/Research Approach
12.1.1 Research Programs/Design
12.1.2 Market Size Estimation
12.1.3 Market Breakdown and Data Triangulation
12.2 Data Sources
12.2.1 Secondary Sources
12.2.2 Primary Sources
12.3 Disclaimer
List of Tables
Table 1 Market Segmentation Analysis
Table 2 Global Sodium Silicate Market Companies with Areas Served
Table 3 Products Offerings Global Sodium Silicate Market
Table 4 Low Growth Scenario Forecasts
Table 5 Reference Case Growth Scenario
Table 6 High Growth Case Scenario
Table 7 Global Sodium Silicate Revenue (USD Million) And CAGR (%) By Type (2018-2030)
Table 8 Global Sodium Silicate Revenue (USD Million) And CAGR (%) By Applications (2018-2030)
Table 9 Global Sodium Silicate Revenue (USD Million) And CAGR (%) By Regions (2018-2030)
Table 10 Global Sodium Silicate Revenue (USD Million) By Type (2019-2024)
Table 11 Global Sodium Silicate Revenue Market Share (%) By Type (2019-2024)
Table 12 Global Sodium Silicate Revenue (USD Million) By Applications (2019-2024)
Table 13 Global Sodium Silicate Revenue Market Share (%) By Applications (2019-2024)
Table 14 Global Sodium Silicate Market Revenue (USD Million) By Regions (2019-2024)
Table 15 Global Sodium Silicate Market Share (%) By Regions (2019-2024)
Table 16 North America Sodium Silicate Revenue (USD Million) By Country (2019-2024)
Table 17 North America Sodium Silicate Revenue (USD Million) By Type (2019-2024)
Table 18 North America Sodium Silicate Revenue (USD Million) By Applications (2019-2024)
Table 19 Europe Sodium Silicate Revenue (USD Million) By Country (2019-2024)
Table 20 Europe Sodium Silicate Revenue (USD Million) By Type (2019-2024)
Table 21 Europe Sodium Silicate Revenue (USD Million) By Applications (2019-2024)
Table 22 Asia Pacific Sodium Silicate Revenue (USD Million) By Country (2019-2024)
Table 23 Asia Pacific Sodium Silicate Revenue (USD Million) By Type (2019-2024)
Table 24 Asia Pacific Sodium Silicate Revenue (USD Million) By Applications (2019-2024)
Table 25 South America Sodium Silicate Revenue (USD Million) By Country (2019-2024)
Table 26 South America Sodium Silicate Revenue (USD Million) By Type (2019-2024)
Table 27 South America Sodium Silicate Revenue (USD Million) By Applications (2019-2024)
Table 28 Middle East and Africa Sodium Silicate Revenue (USD Million) By Region (2019-2024)
Table 29 Middle East and Africa Sodium Silicate Revenue (USD Million) By Type (2019-2024)
Table 30 Middle East and Africa Sodium Silicate Revenue (USD Million) By Applications (2019-2024)
Table 31 Financial Analysis
Table 32 Global Sodium Silicate Revenue (USD Million) By Type (2025-2034)
Table 33 Global Sodium Silicate Revenue Market Share (%) By Type (2025-2034)
Table 34 Global Sodium Silicate Revenue (USD Million) By Applications (2025-2034)
Table 35 Global Sodium Silicate Revenue Market Share (%) By Applications (2025-2034)
Table 36 Global Sodium Silicate Market Revenue (USD Million), And Revenue (USD Million) By Regions (2025-2034)
Table 37 North America Sodium Silicate Revenue (USD)By Country (2025-2034)
Table 38 North America Sodium Silicate Revenue (USD Million) By Type (2025-2034)
Table 39 North America Sodium Silicate Revenue (USD Million) By Applications (2025-2034)
Table 40 Europe Sodium Silicate Revenue (USD Million) By Country (2025-2034)
Table 41 Europe Sodium Silicate Revenue (USD Million) By Type (2025-2034)
Table 42 Europe Sodium Silicate Revenue (USD Million) By Applications (2025-2034)
Table 43 Asia Pacific Sodium Silicate Revenue (USD Million) By Country (2025-2034)
Table 44 Asia Pacific Sodium Silicate Revenue (USD Million) By Type (2025-2034)
Table 45 Asia Pacific Sodium Silicate Revenue (USD Million) By Applications (2025-2034)
Table 46 South America Sodium Silicate Revenue (USD Million) By Country (2025-2034)
Table 47 South America Sodium Silicate Revenue (USD Million) By Type (2025-2034)
Table 48 South America Sodium Silicate Revenue (USD Million) By Applications (2025-2034)
Table 49 Middle East and Africa Sodium Silicate Revenue (USD Million) By Region (2025-2034)
Table 50 Middle East and Africa Sodium Silicate Revenue (USD Million) By Region (2025-2034)
Table 51 Middle East and Africa Sodium Silicate Revenue (USD Million) By Type (2025-2034)
Table 52 Middle East and Africa Sodium Silicate Revenue (USD Million) By Applications (2025-2034)
Table 53 Research Programs/Design for This Report
Table 54 Key Data Information from Secondary Sources
Table 55 Key Data Information from Primary Sources
List of Figures
Figure 1 Market Scope
Figure 2 Porter’s Five Forces
Figure 3 Global Sodium Silicate Revenue (USD Million) By Type (2019-2024)
Figure 4 Global Sodium Silicate Revenue Market Share (%) By Type (2022)
Figure 5 Global Sodium Silicate Revenue (USD Million) By Applications (2019-2024)
Figure 6 Global Sodium Silicate Revenue Market Share (%) By Applications (2022)
Figure 7 Global Sodium Silicate Market Revenue (USD Million) By Regions (2019-2024)
Figure 8 Global Sodium Silicate Market Share (%) By Regions (2022)
Figure 9 North America Sodium Silicate Revenue (USD Million) By Country (2019-2024)
Figure 10 North America Sodium Silicate Revenue (USD Million) By Type (2019-2024)
Figure 11 North America Sodium Silicate Revenue (USD Million) By Applications (2019-2024)
Figure 12 Europe Sodium Silicate Revenue (USD Million) By Country (2019-2024)
Figure 13 Europe Sodium Silicate Revenue (USD Million) By Type (2019-2024)
Figure 14 Europe Sodium Silicate Revenue (USD Million) By Applications (2019-2024)
Figure 15 Asia Pacific Sodium Silicate Revenue (USD Million) By Country (2019-2024)
Figure 16 Asia Pacific Sodium Silicate Revenue (USD Million) By Type (2019-2024)
Figure 17 Asia Pacific Sodium Silicate Revenue (USD Million) By Applications (2019-2024)
Figure 18 South America Sodium Silicate Revenue (USD Million) By Country (2019-2024)
Figure 19 South America Sodium Silicate Revenue (USD Million) By Type (2019-2024)
Figure 20 South America Sodium Silicate Revenue (USD Million) By Applications (2019-2024)
Figure 21 Middle East and Africa Sodium Silicate Revenue (USD Million) By Region (2019-2024)
Figure 22 Middle East and Africa Sodium Silicate Revenue (USD Million) By Type (2019-2024)
Figure 23 Middle East and Africa Sodium Silicate Revenue (USD Million) By Applications (2019-2024)
Figure 24 Global Sodium Silicate Revenue (USD Million) By Type (2025-2034)
Figure 25 Global Sodium Silicate Revenue Market Share (%) By Type (2030)
Figure 26 Global Sodium Silicate Revenue (USD Million) By Applications (2025-2034)
Figure 27 Global Sodium Silicate Revenue Market Share (%) By Applications (2030)
Figure 28 Global Sodium Silicate Market Revenue (USD Million) By Regions (2025-2034)
Figure 29 North America Sodium Silicate Revenue (USD Million) By Country (2025-2034)
Figure 30 North America Sodium Silicate Revenue (USD Million) By Type (2025-2034)
Figure 31 North America Sodium Silicate Revenue (USD Million) By Applications (2025-2034)
Figure 32 Europe Sodium Silicate Revenue (USD Million) By Country (2025-2034)
Figure 33 Europe Sodium Silicate Revenue (USD Million) By Type (2025-2034)
Figure 34 Europe Sodium Silicate Revenue (USD Million) By Applications (2025-2034)
Figure 35 Asia Pacific Sodium Silicate Revenue (USD Million) By Country (2025-2034)
Figure 36 Asia Pacific Sodium Silicate Revenue (USD Million) By Type (2025-2034)
Figure 37 Asia Pacific Sodium Silicate Revenue (USD Million) By Applications (2025-2034)
Figure 38 South America Sodium Silicate Revenue (USD Million) By Country (2025-2034)
Figure 39 South America Sodium Silicate Revenue (USD Million) By Type (2025-2034)
Figure 40 South America Sodium Silicate Revenue (USD Million) By Applications (2025-2034)
Figure 41 Middle East and Africa Sodium Silicate Revenue (USD Million) By Region (2025-2034)
Figure 42 Middle East and Africa Sodium Silicate Revenue (USD Million) By Region (2025-2034)
Figure 43 Middle East and Africa Sodium Silicate Revenue (USD Million) By Type (2025-2034)
Figure 44 Middle East and Africa Sodium Silicate Revenue (USD Million) By Applications (2025-2034)
Figure 45 Bottom-Up and Top-Down Approaches for This Report
Figure 46 Data Triangulation
