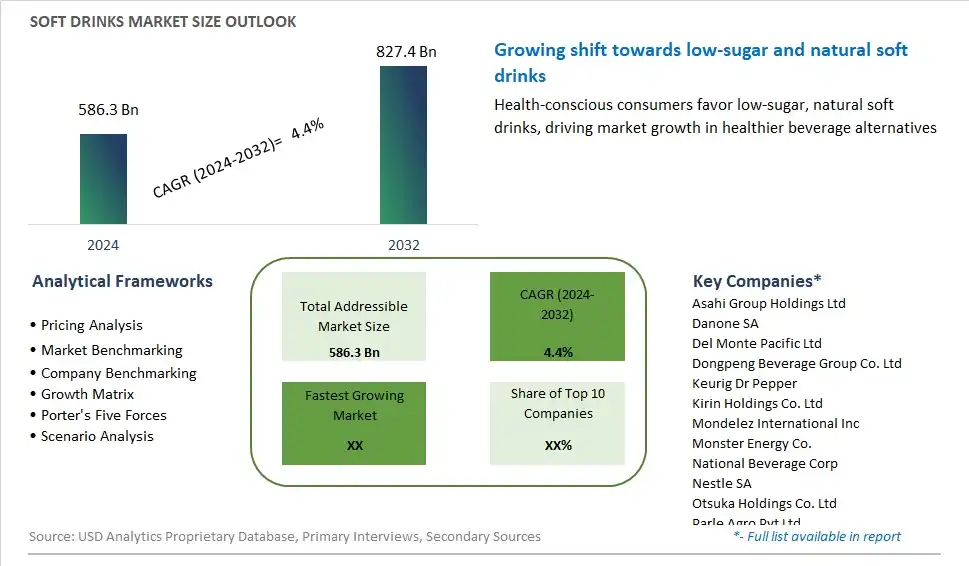
Global Soft Drinks Market Size is valued at $586.3 Billion in 2024 and is forecast to register a growth rate (CAGR) of 4.4% to reach $827.4 Billion by 2032.
The global Soft Drinks Market Comprehensive Study analyzes and forecasts the market size across 6 regions and 24 countries for diverse segments -By Product (Carbonated Soft Drinks, Juices and Juice Concentrates, Bottled Water, RTD Tea and Coffee, Others), By Distribution Channel (Hypermarkets/Supermarkets, Convenience Store, Online, Others)
An Introduction to Soft Drinks Market
In 2024, the soft drinks market is undergoing a transformation fueled by shifting consumer preferences towards healthier and more functional beverages. With growing concerns about sugar consumption and artificial ingredients, there is a rising demand for low-calorie, natural, and functional soft drinks. Manufacturers are responding to this demand by reformulating recipes, introducing innovative ingredients, and expanding their product portfolios to include options such as sparkling water, plant-based drinks, and functional beverages. As consumers seek refreshment without compromising on taste or health, the soft drinks market is witnessing a proliferation of options that cater to evolving lifestyle choices and wellness trends.
Soft Drinks Competitive Landscape
The market report analyses the leading companies in the industry including Asahi Group Holdings Ltd, Danone SA, Del Monte Pacific Ltd, Dongpeng Beverage Group Co. Ltd, Keurig Dr Pepper, Kirin Holdings Co. Ltd, Mondelez International Inc, Monster Energy Co., National Beverage Corp, Nestle SA, Otsuka Holdings Co. Ltd, Parle Agro Pvt Ltd, PepsiCo Inc, POSTOBON S.A, Purity Soft Drinks Ltd, Red Bull GmbH, Refresco Group BV, Starbucks Corp, Suntory Holdings Ltd, Tata Consumer Products Ltd, and Others.
Soft Drinks Market Dynamics
Soft Drinks Market Trend: Rising Demand for Healthier Alternatives
One prominent trend in the soft drinks market is the increasing demand for healthier alternatives. With growing concerns about sugar intake, obesity, and related health issues, consumers are seeking beverages that offer lower sugar content, natural ingredients, and functional benefits. This trend is driven by changing consumer preferences towards healthier lifestyles and dietary choices. As a result, there is a growing market for soft drinks with reduced sugar, natural sweeteners, and added functional ingredients such as vitamins, minerals, and antioxidants. Soft drink brands are responding to this trend by reformulating their existing products, introducing new low or no-sugar variants, and expanding their portfolios with healthier options like sparkling water, flavored water, herbal teas, and functional beverages.
Market Driver: Convenience and Accessibility
The main driver behind the soft drinks market's growth is the demand for convenience and accessibility. Soft drinks offer a convenient and refreshing beverage option that can be enjoyed on various occasions, including meals, social gatherings, and on-the-go activities. This driver is fueled by factors such as busy lifestyles, urbanization, and the rise of convenience stores, vending machines, and online delivery services. Soft drink brands capitalize on this trend by offering a wide range of packaging formats such as cans, bottles, pouches, and multipacks, catering to different consumer preferences and consumption occasions. Additionally, innovations in packaging technology, such as resealable caps and lightweight materials, enhance the convenience and portability of soft drinks, further driving their popularity among consumers.
Market Opportunity: Diversification into Functional and Premium Segments
One potential opportunity within the soft drinks market lies in diversification into functional and premium segments. As consumers become more health-conscious and discerning in their beverage choices, there is a growing demand for soft drinks that offer added value in terms of health benefits, unique flavors, and premium quality. This opportunity extends to categories such as functional beverages (e.g., energy drinks, sports drinks, and wellness drinks) and premium soft drinks (e.g., craft sodas, artisanal fruit sodas, and botanical-infused beverages). Soft drink brands can leverage this opportunity by introducing innovative products that address specific consumer needs and preferences, such as energy-boosting drinks, hydration-enhancing beverages, and indulgent yet healthier options. By tapping into the functional and premium segments, soft drink brands can attract new consumers, differentiate themselves in the market, and drive growth and profitability.
Soft Drinks Market Share Analysis: Bottled Water market is poised to register the fastest growth rae over the forecast period to 2032
Bottled water is the fastest-growing segment in the soft drinks market. This rapid growth is driven by increasing health consciousness among consumers, who are shifting away from sugary and carbonated beverages in favor of healthier hydration options. The rising awareness of the importance of hydration, coupled with the convenience and portability of bottled water, has significantly boosted its demand. Further, the trend towards premium and functional water, such as mineral, vitamin-enhanced, and alkaline water, is further propelling the market. Environmental concerns have also led to innovations in sustainable packaging solutions, such as recyclable and biodegradable bottles, attracting eco-conscious consumers. The global bottled water market is also expanding due to improved distribution channels and aggressive marketing strategies by major brands. These factors collectively make bottled water not only a popular choice but also a dynamically growing segment within the soft drinks industry.
Soft Drinks Market Share Analysis: Online market is poised to register the fastest growth rae over the forecast period to 2032
The online distribution channel is the fastest-growing segment in the soft drinks market. This growth is fueled by the increasing prevalence of e-commerce and the convenience it offers to consumers. With the rise of digital technology and internet penetration, more consumers are opting to purchase their beverages online, enjoying the benefits of home delivery and the ease of comparing prices and brands. The COVID-19 pandemic has further accelerated this shift, as many people have turned to online shopping to avoid physical stores. Additionally, online platforms often provide a wider variety of products, including niche and international brands that might not be available in local stores. The integration of personalized recommendations, subscription services, and frequent promotional discounts makes online shopping an attractive option. This trend is supported by advancements in logistics and supply chain management, ensuring timely and efficient delivery of products. As a result, the online distribution channel is experiencing robust growth, transforming how consumers purchase soft drinks.
Soft Drinks Market Segmentation
By Product
Carbonated Soft Drinks
Juices and Juice Concentrates
Bottled Water
RTD Tea and Coffee
Others
By Distribution Channel
Hypermarkets/Supermarkets
Convenience Store
Online
Others
Countries Analyzed
North America (US, Canada, Mexico)
Europe (Germany, UK, France, Spain, Italy, Russia, Rest of Europe)
Asia Pacific (China, India, Japan, South Korea, Australia, South East Asia, Rest of Asia)
South America (Brazil, Argentina, Rest of South America)
Middle East and Africa (Saudi Arabia, UAE, Rest of Middle East, South Africa, Egypt, Rest of Africa)
Soft Drinks Companies Profiled in the Study
Asahi Group Holdings Ltd
Danone SA
Del Monte Pacific Ltd
Dongpeng Beverage Group Co. Ltd
Keurig Dr Pepper
Kirin Holdings Co. Ltd
Mondelez International Inc
Monster Energy Co.
National Beverage Corp
Nestle SA
Otsuka Holdings Co. Ltd
Parle Agro Pvt Ltd
PepsiCo Inc
POSTOBON S.A
Purity Soft Drinks Ltd
Red Bull GmbH
Refresco Group BV
Starbucks Corp
Suntory Holdings Ltd
Tata Consumer Products Ltd
*- List Not Exhaustive
Chapter 1. TABLE OF CONTENTS
Chapter 2. Introduction to Soft Drinks Market
2.1. Market Overview
2.2. Key Statistics and Report Highlights
2.3. Scope of the Comprehensive Study
2.3.1. Market Definition
2.3.2 Countries and Regions Covered
2.3.3 Research Objective
2.3.4 Units, Currency, and Conversions
2.3.5 Industry Value Chain
2.4. Key Market Segments
2.5. Key Companies
2.6. Study Period
Chapter 3. Strategic Analysis Review
3.1. Soft Drinks Pricing Analysis and Forecast
3.2. Porter’s Five Forces
3.3. Market Ecosystem
3.4. SWOT Analysis
3.5. Regulatory Scenario
3.3. Effects of Inflation, Russia-Ukraine War, moderating economic growth, and other macroeconomic factors
Chapter 4. Competitive Landscape
4.1. Market Share Analysis
4.1.1. Global Soft Drinks Market Share by Company, 2023
4.1.2. Product Offerings of Leading Soft Drinks Companies
4.2. Market Entropy
4.2.1. New Product Launches in the Industry
4.2.2. Mergers, Acquisitions, Joint ventures, and Partnerships
4.3. Key Strategies and Best Practices
Chapter 5. Global Market Projections: Best, Reference, and Low Case Scenarios
5.1. Growth Analysis- Case Scenario Definitions
5.2. Low Growth Case Scenario Forecasts
5.3. Reference Growth Case Scenario Forecasts
5.4. High Growth Case Scenario Forecasts
Chapter 6. Market Dynamics
6.1. Soft Drinks Market Drivers
6.2. Soft Drinks Market Challenges
6.6. Soft Drinks Market Opportunities
6.4. Soft Drinks Market Trends
Chapter 7. Global Soft Drinks Market Outlook Trends
7.1. Global Soft Drinks Revenue (USD Million) and CAGR (%) by Type (2021-2032)
7.2. Global Soft Drinks Revenue (USD Million) and CAGR (%) by Application (2021-2032)
7.3. Global Soft Drinks Revenue (USD Million) and CAGR (%) by Product (2021-2032)
By Product
Carbonated Soft Drinks
Juices and Juice Concentrates
Bottled Water
RTD Tea and Coffee
Others
By Distribution Channel
Hypermarkets/Supermarkets
Convenience Store
Online
Others
Chapter 8. Global Soft Drinks Regional Analysis and Outlook
8.1. Global Soft Drinks Revenue (USD Million) By Regions (2021- 2032)
8.2. North America Soft Drinks Revenue (USD Million) by Country (2021-2032)
8.2.1. United States Soft Drinks Regional Analysis and Outlook
8.2.2. Canada Soft Drinks Regional Analysis and Outlook
8.2.3. Mexico Soft Drinks Regional Analysis and Outlook
8.3. Europe Soft Drinks Revenue (USD Million), by Country (2021-2032)
8.3.1. Germany Soft Drinks Regional Analysis and Outlook
8.3.2. France Soft Drinks Regional Analysis and Outlook
8.3.3. United Kingdom Soft Drinks Regional Analysis and Outlook
8.3.4. Spain Soft Drinks Regional Analysis and Outlook
8.3.5. Italy Soft Drinks Regional Analysis and Outlook
8.3.6. Russia Soft Drinks Regional Analysis and Outlook
8.3.7. Rest of Europe Soft Drinks Regional Analysis and Outlook
8.4. Asia Pacific Soft Drinks Revenue (USD Million) by Country (2021-2032)
8.4.1. China Soft Drinks Regional Analysis and Outlook
8.4.2. Japan Soft Drinks Regional Analysis and Outlook
8.4.3. India Soft Drinks Regional Analysis and Outlook
8.4.4. South Korea Soft Drinks Regional Analysis and Outlook
8.4.5. Australia Soft Drinks Regional Analysis and Outlook
8.4.6. South East Asia Soft Drinks Regional Analysis and Outlook
8.4.7. Rest of Asia Pacific Soft Drinks Regional Analysis and Outlook
8.5. South America Soft Drinks Revenue (USD Million), by Country (2021-2032)
8.5.1. Brazil Soft Drinks Regional Analysis and Outlook
8.5.2. Argentina Soft Drinks Regional Analysis and Outlook
8.5.3. Rest of South America Soft Drinks Regional Analysis and Outlook
8.6. Middle East and Africa Soft Drinks Revenue (USD Million) by Country (2021-2032)
8.6.1. Middle East Soft Drinks Regional Analysis and Outlook
8.6.2. Africa Soft Drinks Regional Analysis and Outlook
Chapter 9. North America Soft Drinks Analysis and Outlook
9.1. North America Soft Drinks Revenue (USD Million) by Segments (2021-2032)
9.1.1. North America Soft Drinks Revenue (USD Million) by Type (2021-2032)
9.1.2. North America Soft Drinks Revenue (USD Million) by Application (2021-2032)
9.1.3. North America Soft Drinks Revenue (USD Million) by Product (2021-2032)
By Product
Carbonated Soft Drinks
Juices and Juice Concentrates
Bottled Water
RTD Tea and Coffee
Others
By Distribution Channel
Hypermarkets/Supermarkets
Convenience Store
Online
Others
Chapter 10. Europe Soft Drinks Analysis and Outlook
10.1. Europe Soft Drinks Revenue (USD Million), by Segments (USD Million) (2021-2032)
10.1.1. Europe Soft Drinks Revenue (USD Million) by Type (2021-2032)
10.1.2. Europe Soft Drinks Revenue (USD Million) by Application (2021-2032)
10.1.3. Europe Soft Drinks Revenue (USD Million) by Product (2021-2032)
By Product
Carbonated Soft Drinks
Juices and Juice Concentrates
Bottled Water
RTD Tea and Coffee
Others
By Distribution Channel
Hypermarkets/Supermarkets
Convenience Store
Online
Others
Chapter 11. Asia Pacific Soft Drinks Analysis and Outlook
11.1. Asia Pacific Soft Drinks Revenue (USD Million), and Revenue (USD Million) by Segments (2021-2032)
11.1.1. Asia Pacific Soft Drinks Revenue (USD Million) by Type (2021-2032)
11.1.2. Asia Pacific Soft Drinks Revenue (USD Million) by Application (2021-2032)
11.1.3. Asia Pacific Soft Drinks Revenue (USD Million) by Product (2021-2032)
By Product
Carbonated Soft Drinks
Juices and Juice Concentrates
Bottled Water
RTD Tea and Coffee
Others
By Distribution Channel
Hypermarkets/Supermarkets
Convenience Store
Online
Others
Chapter 12. South America Soft Drinks Analysis and Outlook
12.1. South America Soft Drinks Revenue (USD Million), by Segments (2021-2032)
12.1.1. South America Soft Drinks Revenue (USD Million) by Type (2021-2032)
12.1.2. South America Soft Drinks Revenue (USD Million) by Application (2021-2032)
12.1.3. South America Soft Drinks Revenue (USD Million) by Product (2021-2032)
By Product
Carbonated Soft Drinks
Juices and Juice Concentrates
Bottled Water
RTD Tea and Coffee
Others
By Distribution Channel
Hypermarkets/Supermarkets
Convenience Store
Online
Others
Chapter 13. Middle East and Africa Soft Drinks Analysis and Outlook
13.1. Middle East and Africa Soft Drinks Revenue (USD Million), by Segments (2021-2032)
13.1.1. Middle East and Africa Soft Drinks Revenue (USD Million) by Type (2021-2032)
13.1.2. Middle East and Africa Soft Drinks Revenue (USD Million) by Application (2021-2032)
13.1.3. Middle East and Africa Soft Drinks Revenue (USD Million) by Product (2021-2032)
By Product
Carbonated Soft Drinks
Juices and Juice Concentrates
Bottled Water
RTD Tea and Coffee
Others
By Distribution Channel
Hypermarkets/Supermarkets
Convenience Store
Online
Others
Chapter 14. Soft Drinks Company Profiles
14.1 Business Overview
14.2 Product Profiles
14.3 SWOT Profiles
14.5 Recent Developments
14.6 Financial Profile
List of Companies
Asahi Group Holdings Ltd
Danone SA
Del Monte Pacific Ltd
Dongpeng Beverage Group Co. Ltd
Keurig Dr Pepper
Kirin Holdings Co. Ltd
Mondelez International Inc
Monster Energy Co.
National Beverage Corp
Nestle SA
Otsuka Holdings Co. Ltd
Parle Agro Pvt Ltd
PepsiCo Inc
POSTOBON S.A
Purity Soft Drinks Ltd
Red Bull GmbH
Refresco Group BV
Starbucks Corp
Suntory Holdings Ltd
Tata Consumer Products Ltd
15. Methodology and Data Sources
15.1 Customization Offerings
15.2 Subscription Services
15.3 Related Reports
15.4 Publisher Expertise
LIST OF TABLES
Table 1 Market Segmentation Analysis
Table 2 Global Soft Drinks Market Share of Leading Companies, 2023
Table 3 Product Offerings of Leading Companies
Table 4 Low Growth Scenario Forecasts
Table 5 Reference Case Growth Scenario
Table 6 High Growth Case Scenario
Table 7 Global Soft Drinks Revenue (USD Million) And CAGR (%) By Type (2021-2032)
Table 8 Global Soft Drinks Revenue (USD Million) And CAGR (%) By Application (2021-2032)
Table 9 Global Soft Drinks Revenue (USD Million) And CAGR (%) By Product (2021-2032)
Table 10 Global Soft Drinks Market Revenue (USD Million) By Regions (2021-2032)
Table 11 Global Soft Drinks Market Share (%) By Regions (2021-2032)
Table 12 North America Soft Drinks Revenue (USD Million) By Country (2021-2032)
Table 13 Europe Soft Drinks Revenue (USD Million) By Country (2021-2032)
Table 14 Asia Pacific Soft Drinks Revenue (USD Million) By Country (2021-2032)
Table 15 South America Soft Drinks Revenue (USD Million) By Country (2021-2032)
Table 16 Middle East and Africa Soft Drinks Revenue (USD Million) By Region (2021-2032)
Table 17 North America Soft Drinks Revenue (USD Million) By Type (2021-2032)
Table 18 North America Soft Drinks Revenue (USD Million) By Application (2021-2032)
Table 19 North America Soft Drinks Revenue (USD Million) By Product (2021-2032)
Table 20 Europe Soft Drinks Revenue (USD Million) By Type (2021-2032)
Table 21 Europe Soft Drinks Revenue (USD Million) By Application (2021-2032)
Table 22 Europe Soft Drinks Revenue (USD Million) By Product (2021-2032)
Table 23 Asia Pacific Soft Drinks Revenue (USD Million) By Type (2021-2032)
Table 24 Asia Pacific Soft Drinks Revenue (USD Million) By Application (2021-2032)
Table 25 Asia Pacific Soft Drinks Revenue (USD Million) By Product (2021-2032)
Table 26 South America Soft Drinks Revenue (USD Million) By Type (2021-2032)
Table 27 South America Soft Drinks Revenue (USD Million) By Application (2021-2032)
Table 28 South America Soft Drinks Revenue (USD Million) By Product (2021-2032)
Table 29 Middle East and Africa Soft Drinks Revenue (USD Million) By Type (2021-2032)
Table 30 Middle East and Africa Soft Drinks Revenue (USD Million) By Application (2021-2032)
Table 31 Middle East and Africa Soft Drinks Revenue (USD Million) By Product (2021-2032)
LIST OF FIGURES
Figure 1. Market Scope
Figure 2. Pricing Forecasts Per Unit, 2023- 2032
Figure 3. Porter’s Five Forces
Figure 4. Global Soft Drinks Market Revenue (USD Million) By Regions (2021-2032)
Figure 5. Global Soft Drinks Market Share (%) By Regions (2023)
Figure 6. North America Soft Drinks Revenue (USD Million) By Country (2021-2032)
Figure 7. United States Soft Drinks Revenue (USD Million) By Country (2021-2032)
Figure 8. Canada Soft Drinks Revenue (USD Million) By Country (2021-2032)
Figure 9. Mexico Soft Drinks Revenue (USD Million) By Country (2021-2032)
Figure 10. Europe Soft Drinks Revenue (USD Million) By Country (2021-2032)
Figure 11. Germany Soft Drinks Revenue (USD Million) By Country (2021-2032)
Figure 12. France Soft Drinks Revenue (USD Million) By Country (2021-2032)
Figure 13. United Kingdom Soft Drinks Revenue (USD Million) By Country (2021-2032)
Figure 14. Spain Soft Drinks Revenue (USD Million) By Country (2021-2032)
Figure 15. Italy Soft Drinks Revenue (USD Million) By Country (2021-2032)
Figure 16. Russia Soft Drinks Revenue (USD Million) By Country (2021-2032)
Figure 17. Rest of Europe Soft Drinks Revenue (USD Million) By Country (2021-2032)
Figure 11. Asia Pacific Soft Drinks Revenue (USD Million) By Country (2021-2032)
Figure 12. China Soft Drinks Revenue (USD Million) By Country (2021-2032)
Figure 13. Japan Soft Drinks Revenue (USD Million) By Country (2021-2032)
Figure 14. India Soft Drinks Revenue (USD Million) By Country (2021-2032)
Figure 15. South Korea Soft Drinks Revenue (USD Million) By Country (2021-2032)
Figure 16. Australia Soft Drinks Revenue (USD Million) By Country (2021-2032)
Figure 17. South East Asia Soft Drinks Revenue (USD Million) By Country (2021-2032)
Figure 18. South America Soft Drinks Revenue (USD Million) By Country (2021-2032)
Figure 19. Brazil Soft Drinks Revenue (USD Million) By Country (2021-2032)
Figure 20. Argentina Soft Drinks Revenue (USD Million) By Country (2021-2032)
Figure 21. Rest of Asia Pacific Soft Drinks Revenue (USD Million) By Country (2021-2032)
Figure 22. Middle East and Africa Soft Drinks Revenue (USD Million) By Region (2021-2032)
Figure 23. Saudi Arabia Soft Drinks Revenue (USD Million) By Region (2021-2032)
Figure 24. The UAE Soft Drinks Revenue (USD Million) By Region (2021-2032)
Figure 25. Rest of Middle East Soft Drinks Revenue (USD Million) By Region (2021-2032)
Figure 26. South Africa Soft Drinks Revenue (USD Million) By Region (2021-2032)
Figure 27. Africa Soft Drinks Revenue (USD Million) By Region (2021-2032)
Figure 28. North America Soft Drinks Revenue (USD Million) By Type (2021-2032)
Figure 29. North America Soft Drinks Revenue (USD Million) By Application (2021-2032)
Figure 30. North America Soft Drinks Revenue (USD Million) By Product (2021-2032)
Figure 31. Europe Soft Drinks Revenue (USD Million) By Type (2021-2032)
Figure 32. Europe Soft Drinks Revenue (USD Million) By Application (2021-2032)
Figure 33. Europe Soft Drinks Revenue (USD Million) By Product (2021-2032)
Figure 34. Asia Pacific Soft Drinks Revenue (USD Million) By Type (2021-2032)
Figure 35. Asia Pacific Soft Drinks Revenue (USD Million) By Application (2021-2032)
Figure 36. Asia Pacific Soft Drinks Revenue (USD Million) By Product (2021-2032)
Figure 37. South America Soft Drinks Revenue (USD Million) By Type (2021-2032)
Figure 38. South America Soft Drinks Revenue (USD Million) By Application (2021-2032)
Figure 39. South America Soft Drinks Revenue (USD Million) By Product (2021-2032)
Figure 40. Middle East and Africa Soft Drinks Revenue (USD Million) By Type (2021-2032)
Figure 41. Middle East and Africa Soft Drinks Revenue (USD Million) By Application (2021-2032)
Figure 42. Middle East and Africa Soft Drinks Revenue (USD Million) By Product (2021-2032)
By Product
Carbonated Soft Drinks
Juices and Juice Concentrates
Bottled Water
RTD Tea and Coffee
Others
By Distribution Channel
Hypermarkets/Supermarkets
Convenience Store
Online
Others
Countries Analyzed
North America (US, Canada, Mexico)
Europe (Germany, UK, France, Spain, Italy, Russia, Rest of Europe)
Asia Pacific (China, India, Japan, South Korea, Australia, South East Asia, Rest of Asia)
South America (Brazil, Argentina, Rest of South America)
Middle East and Africa (Saudi Arabia, UAE, Rest of Middle East, South Africa, Egypt, Rest of Africa)
