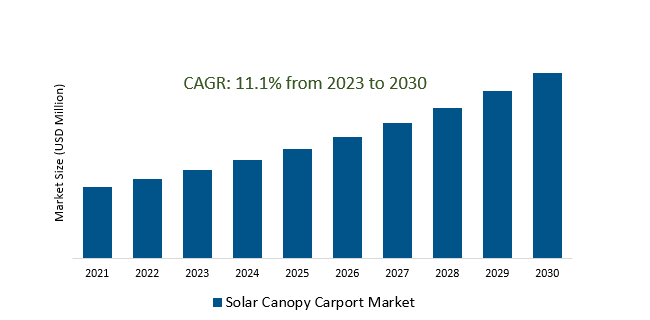
The Solar Canopy Carport Market Size is estimated to register 11.1% growth over the forecast period from 2023 to 2030.
Solar Canopy Carport Market Overview
The increasing global emphasis on sustainability and the shift towards renewable energy sources are driving the adoption of solar canopy carports. Businesses and public spaces are leveraging these structures to provide shaded parking spaces equipped with EV charging capabilities, catering to the growing EV market. Businesses and organizations are investing in solar canopy carports as a means to generate clean energy and reduce utility expenses. Continuous advancements in solar technology, including improvements in photovoltaic panels' efficiency, energy storage systems, and installation methods, are contributing to the increased raise in the market demand. Companies are offering designs that blend well with existing architecture and landscaping, enhancing their visual appeal.
Solar Canopy Carport Market Dynamics
Market Trends- Growing Adoption of Solar Energy Solutions in the Solar Canopy Carport Market.
Businesses, institutions, and communities are increasingly turning to solar canopy carports as a strategic means to harness renewable energy. Further, this aligns with the global shift towards sustainable practices and the rising demand for clean energy sources.
The integration of solar panels into carport structures not only optimizes space utilization but also addresses the growing need for energy-efficient infrastructure leading to the market growth.
Carport structures are being designed with multifunctional capabilities, providing both covered parking and renewable energy generation, optimizing land use, and offering added value leading to market growth.
Market Driver- Growing demand for electric vehicles (EVs) in Solar Canopy Carport Market.
As the automotive industry undergoes a transformative shift towards sustainability, the increased adoption of EVs plays a pivotal role in driving the demand for solar canopy carports.
Businesses and institutions are recognizing the synergy between EVs and solar canopy carports as a holistic solution contributing to their sustainability goals.
Further, subsidies, tax credits, and incentives for both EVs and solar energy solutions incentivize businesses to invest in sustainable infrastructure are amplifying the demand.
Market Opportunity- Growing popularity of sustainable building design drives Solar Canopy Carport Market.
Businesses, driven by environmental consciousness and sustainability goals, are opting for eco-friendly solutions that promote renewable energy generation and reduce their carbon footprint.
Additionally, the growing preference among consumers and stakeholders for environmentally friendly structures and businesses that champion sustainability influences the uptake of solar canopy carports.
Further, drivers such as regulatory mandates and incentives promoting sustainable building practices are fostering the adoption of solar canopy carports.
Market Share Analysis- 2-Row Single Slope Vehicle Arrangement will register the fastest growth
The Solar Canopy Carport Market is analyzed across 1- Row Vehicle Arrangement Carport, 2-Row Single Slope Vehicle Arrangement & 2-Row Dual Slope Vehicle Arrangement. 2-Row Single Slope Vehicle Arrangement is poised to register the fastest growth. The 2-Row Dual Slope Vehicle Arrangement carport design often offered higher energy generation potential due to its configuration, allowing for increased solar panel installation while providing covered parking for multiple vehicles. Its design provided an optimal balance between space utilization, energy output, and parking capacity, making it an attractive choice for commercial and larger-scale installations. This design optimizes space utilization while providing covered parking for multiple vehicles. Further, Businesses and organizations opt for the 2-Row Single Slope Vehicle Arrangement carport design as part of their sustainability initiatives and energy-efficient infrastructure projects.
Market Share Analysis- Mono-pitch held a significant market share in 2023
The Solar Canopy Carport Market is analyzed across various Canopys including Mono-pitch, Duo-pitch & Barrel arch. Of these, Mono-pitch held a significant market share in 2023. This type of canopy is widely favored for its simplicity, ease of installation, and efficient accommodation of solar photovoltaic (PV) panels. Its streamlined design allows for an optimal angle for solar panel installation, maximizing exposure to sunlight and facilitating efficient energy generation. They are recognized for their versatility and cost-effectiveness, making them popular choices for various applications, including commercial parking lots, industrial facilities, and other outdoor areas where covered parking and renewable energy generation are desired. Additionally, practicality and functionality of the mono-pitch canopy lie in its ability to combine the benefits of covered parking with solar energy generation, offering a dual-purpose solution for businesses and institutions aiming to embrace sustainability.
Solar Canopy Carport Market Segmentation
By Design
- Single Column Cantilever Styles
- Two Column Styles
- Louvered Styles
By Carport
- 1-Row Vehicle Arrangement Carport
- 2-Row Single Slope Vehicle Arrangement
- 2-Row Dual Slope Vehicle Arrangement
By Canopy
- Mono-pitch
- Duo-pitch
- Barrel arch
By End-User
- Residential
- Commercial
- Industrial
- Others
By Region
- North America (United States, Canada, Mexico)
- Europe (Germany, France, United Kingdom, Spain, Italy, Others)
- Asia Pacific (China, India, Japan, South Korea, Australia, Others)
- Latin America (Brazil, Argentina, Others)
- Middle East and Africa (Saudi Arabia, UAE, Kuwait, Other Middle East, South Africa, Nigeria, Other Africa)
Solar Canopy Carport Market Companies
- SunPower
- Distributed Solar Development LLC
- JinkoSolar
- Trina Solar
- Steag
- Schletter
- FlexiSolar and Inovateus Solar
- Carport Structures Corp
- Quest Renewables INC
- RBI Solar
- Ameresco
*List not exhaustive
Solar Canopy Carport Market Outlook 2023
1 Market Overview
1.1 Introduction to the Solar Canopy Carport Market
1.2 Scope of the Study
1.3 Research Objective
1.3.1 Key Market Scope and Segments
1.3.2 Players Covered
1.3.3 Years Considered
2 Executive Summary
2.1 2023 Solar Canopy Carport Industry- Market Statistics
3 Market Dynamics
3.1 Market Drivers
3.2 Market Challenges
3.3 Market Opportunities
3.4 Market Trends
4 Market Factor Analysis
4.1 Porter’s Five Forces
4.2 Market Entropy
4.2.1 Global Solar Canopy Carport Market Companies with Area Served
4.2.2 Products Offerings Global Solar Canopy Carport Market
5 COVID-19 Impact Analysis and Outlook Scenarios
5.1.1 Covid-19 Impact Analysis
5.1.2 post-COVID-19 Scenario- Low Growth Case
5.1.3 post-COVID-19 Scenario- Reference Growth Case
5.1.4 post-COVID-19 Scenario- Low Growth Case
6 Global Solar Canopy Carport Market Trends
6.1 Global Solar Canopy Carport Revenue (USD Million) and CAGR (%) by Type (2018-2030)
6.2 Global Solar Canopy Carport Revenue (USD Million) and CAGR (%) by Applications (2018-2030)
6.3 Global Solar Canopy Carport Revenue (USD Million) and CAGR (%) by regions (2018-2030)
7 Global Solar Canopy Carport Market Revenue (USD Million) by Type, and Applications (2018-2022)
7.1 Global Solar Canopy Carport Revenue (USD Million) by Type (2018-2022)
7.1.1 Global Solar Canopy Carport Revenue (USD Million), Market Share (%) by Type (2018-2022)
7.2 Global Solar Canopy Carport Revenue (USD Million) by Applications (2018-2022)
7.2.1 Global Solar Canopy Carport Revenue (USD Million), Market Share (%) by Applications (2018-2022)
8 Global Solar Canopy Carport Development Regional Status and Outlook
8.1 Global Solar Canopy Carport Revenue (USD Million) By Regions (2018-2022)
8.2 North America Solar Canopy Carport Revenue (USD Million) by Type, and Application (2018-2022)
8.2.1 North America Solar Canopy Carport Revenue (USD Million) by Country (2018-2022)
8.2.2 North America Solar Canopy Carport Revenue (USD Million) by Type (2018-2022)
8.2.3 North America Solar Canopy Carport Revenue (USD Million) by Applications (2018-2022)
8.3 Europe Solar Canopy Carport Revenue (USD Million), by Type, and Applications (USD Million) (2018-2022)
8.3.1 Europe Solar Canopy Carport Revenue (USD Million), by Country (2018-2022)
8.3.2 Europe Solar Canopy Carport Revenue (USD Million) by Type (2018-2022)
8.3.3 Europe Solar Canopy Carport Revenue (USD Million) by Applications (2018-2022)
8.4 Asia Pacific Solar Canopy Carport Revenue (USD Million), and Revenue (USD Million) by Type, and Applications (2018-2022)
8.4.1 Asia Pacific Solar Canopy Carport Revenue (USD Million) by Country (2018-2022)
8.4.2 Asia Pacific Solar Canopy Carport Revenue (USD Million) by Type (2018-2022)
8.4.3 Asia Pacific Solar Canopy Carport Revenue (USD Million) by Applications (2018-2022)
8.5 South America Solar Canopy Carport Revenue (USD Million), by Type, and Applications (2018-2022)
8.5.1 South America Solar Canopy Carport Revenue (USD Million), by Country (2018-2022)
8.5.2 South America Solar Canopy Carport Revenue (USD Million) by Type (2018-2022)
8.5.3 South America Solar Canopy Carport Revenue (USD Million) by Applications (2018-2022)
8.6 Middle East and Africa Solar Canopy Carport Revenue (USD Million), by Type, Technology, Application, Thickness (2018-2022)
8.6.1 Middle East and Africa Solar Canopy Carport Revenue (USD Million) by Country (2018-2022)
8.6.2 Middle East and Africa Solar Canopy Carport Revenue (USD Million) by Type (2018-2022)
8.6.3 Middle East and Africa Solar Canopy Carport Revenue (USD Million) by Applications (2018-2022)
9 Company Profiles
10 Global Solar Canopy Carport Market Revenue (USD Million), by Type, and Applications (2023-2030)
10.1 Global Solar Canopy Carport Revenue (USD Million) and Market Share (%) by Type (2023-2030)
10.1.1 Global Solar Canopy Carport Revenue (USD Million), and Market Share (%) by Type (2023-2030)
10.2 Global Solar Canopy Carport Revenue (USD Million) and Market Share (%) by Applications (2023-2030)
10.2.1 Global Solar Canopy Carport Revenue (USD Million), and Market Share (%) by Applications (2023-2030)
11 Global Solar Canopy Carport Development Regional Status and Outlook Forecast
11.1 Global Solar Canopy Carport Revenue (USD Million) By Regions (2023-2030)
11.2 North America Solar Canopy Carport Revenue (USD Million) by Type, and Applications (2023-2030)
11.2.1 North America Solar Canopy Carport Revenue (USD) Million by Country (2023-2030)
11.2.2 North America Solar Canopy Carport Revenue (USD Million), by Type (2023-2030)
11.2.3 North America Solar Canopy Carport Revenue (USD Million), Market Share (%) by Applications (2023-2030)
11.3 Europe Solar Canopy Carport Revenue (USD Million), by Type, and Applications (2023-2030)
11.3.1 Europe Solar Canopy Carport Revenue (USD Million), by Country (2023-2030)
11.3.2 Europe Solar Canopy Carport Revenue (USD Million), by Type (2023-2030)
11.3.3 Europe Solar Canopy Carport Revenue (USD Million), by Applications (2023-2030)
11.4 Asia Pacific Solar Canopy Carport Revenue (USD Million) by Type, and Applications (2023-2030)
11.4.1 Asia Pacific Solar Canopy Carport Revenue (USD Million), by Country (2023-2030)
11.4.2 Asia Pacific Solar Canopy Carport Revenue (USD Million), by Type (2023-2030)
11.4.3 Asia Pacific Solar Canopy Carport Revenue (USD Million), by Applications (2023-2030)
11.5 South America Solar Canopy Carport Revenue (USD Million), by Type, and Applications (2023-2030)
11.5.1 South America Solar Canopy Carport Revenue (USD Million), by Country (2023-2030)
11.5.2 South America Solar Canopy Carport Revenue (USD Million), by Type (2023-2030)
11.5.3 South America Solar Canopy Carport Revenue (USD Million), by Applications (2023-2030)
11.6 Middle East and Africa Solar Canopy Carport Revenue (USD Million), by Type, and Applications (2023-2030)
11.6.1 Middle East and Africa Solar Canopy Carport Revenue (USD Million), by region (2023-2030)
11.6.2 Middle East and Africa Solar Canopy Carport Revenue (USD Million), by Type (2023-2030)
11.6.3 Middle East and Africa Solar Canopy Carport Revenue (USD Million), by Applications (2023-2030)
12 Methodology and Data Sources
12.1 Methodology/Research Approach
12.1.1 Research Programs/Design
12.1.2 Market Size Estimation
12.1.3 Market Breakdown and Data Triangulation
12.2 Data Sources
12.2.1 Secondary Sources
12.2.2 Primary Sources
12.3 Disclaimer
List of Tables
Table 1 Market Segmentation Analysis
Table 2 Global Solar Canopy Carport Market Companies with Areas Served
Table 3 Products Offerings Global Solar Canopy Carport Market
Table 4 Low Growth Scenario Forecasts
Table 5 Reference Case Growth Scenario
Table 6 High Growth Case Scenario
Table 7 Global Solar Canopy Carport Revenue (USD Million) And CAGR (%) By Type (2018-2030)
Table 8 Global Solar Canopy Carport Revenue (USD Million) And CAGR (%) By Applications (2018-2030)
Table 9 Global Solar Canopy Carport Revenue (USD Million) And CAGR (%) By Regions (2018-2030)
Table 10 Global Solar Canopy Carport Revenue (USD Million) By Type (2018-2022)
Table 11 Global Solar Canopy Carport Revenue Market Share (%) By Type (2018-2022)
Table 12 Global Solar Canopy Carport Revenue (USD Million) By Applications (2018-2022)
Table 13 Global Solar Canopy Carport Revenue Market Share (%) By Applications (2018-2022)
Table 14 Global Solar Canopy Carport Market Revenue (USD Million) By Regions (2018-2022)
Table 15 Global Solar Canopy Carport Market Share (%) By Regions (2018-2022)
Table 16 North America Solar Canopy Carport Revenue (USD Million) By Country (2018-2022)
Table 17 North America Solar Canopy Carport Revenue (USD Million) By Type (2018-2022)
Table 18 North America Solar Canopy Carport Revenue (USD Million) By Applications (2018-2022)
Table 19 Europe Solar Canopy Carport Revenue (USD Million) By Country (2018-2022)
Table 20 Europe Solar Canopy Carport Revenue (USD Million) By Type (2018-2022)
Table 21 Europe Solar Canopy Carport Revenue (USD Million) By Applications (2018-2022)
Table 22 Asia Pacific Solar Canopy Carport Revenue (USD Million) By Country (2018-2022)
Table 23 Asia Pacific Solar Canopy Carport Revenue (USD Million) By Type (2018-2022)
Table 24 Asia Pacific Solar Canopy Carport Revenue (USD Million) By Applications (2018-2022)
Table 25 South America Solar Canopy Carport Revenue (USD Million) By Country (2018-2022)
Table 26 South America Solar Canopy Carport Revenue (USD Million) By Type (2018-2022)
Table 27 South America Solar Canopy Carport Revenue (USD Million) By Applications (2018-2022)
Table 28 Middle East and Africa Solar Canopy Carport Revenue (USD Million) By Region (2018-2022)
Table 29 Middle East and Africa Solar Canopy Carport Revenue (USD Million) By Type (2018-2022)
Table 30 Middle East and Africa Solar Canopy Carport Revenue (USD Million) By Applications (2018-2022)
Table 31 Financial Analysis
Table 32 Global Solar Canopy Carport Revenue (USD Million) By Type (2023-2030)
Table 33 Global Solar Canopy Carport Revenue Market Share (%) By Type (2023-2030)
Table 34 Global Solar Canopy Carport Revenue (USD Million) By Applications (2023-2030)
Table 35 Global Solar Canopy Carport Revenue Market Share (%) By Applications (2023-2030)
Table 36 Global Solar Canopy Carport Market Revenue (USD Million), And Revenue (USD Million) By Regions (2023-2030)
Table 37 North America Solar Canopy Carport Revenue (USD)By Country (2023-2030)
Table 38 North America Solar Canopy Carport Revenue (USD Million) By Type (2023-2030)
Table 39 North America Solar Canopy Carport Revenue (USD Million) By Applications (2023-2030)
Table 40 Europe Solar Canopy Carport Revenue (USD Million) By Country (2023-2030)
Table 41 Europe Solar Canopy Carport Revenue (USD Million) By Type (2023-2030)
Table 42 Europe Solar Canopy Carport Revenue (USD Million) By Applications (2023-2030)
Table 43 Asia Pacific Solar Canopy Carport Revenue (USD Million) By Country (2023-2030)
Table 44 Asia Pacific Solar Canopy Carport Revenue (USD Million) By Type (2023-2030)
Table 45 Asia Pacific Solar Canopy Carport Revenue (USD Million) By Applications (2023-2030)
Table 46 South America Solar Canopy Carport Revenue (USD Million) By Country (2023-2030)
Table 47 South America Solar Canopy Carport Revenue (USD Million) By Type (2023-2030)
Table 48 South America Solar Canopy Carport Revenue (USD Million) By Applications (2023-2030)
Table 49 Middle East and Africa Solar Canopy Carport Revenue (USD Million) By Region (2023-2030)
Table 50 Middle East and Africa Solar Canopy Carport Revenue (USD Million) By Region (2023-2030)
Table 51 Middle East and Africa Solar Canopy Carport Revenue (USD Million) By Type (2023-2030)
Table 52 Middle East and Africa Solar Canopy Carport Revenue (USD Million) By Applications (2023-2030)
Table 53 Research Programs/Design for This Report
Table 54 Key Data Information from Secondary Sources
Table 55 Key Data Information from Primary Sources
List of Figures
Figure 1 Market Scope
Figure 2 Porter’s Five Forces
Figure 3 Global Solar Canopy Carport Revenue (USD Million) By Type (2018-2022)
Figure 4 Global Solar Canopy Carport Revenue Market Share (%) By Type (2022)
Figure 5 Global Solar Canopy Carport Revenue (USD Million) By Applications (2018-2022)
Figure 6 Global Solar Canopy Carport Revenue Market Share (%) By Applications (2022)
Figure 7 Global Solar Canopy Carport Market Revenue (USD Million) By Regions (2018-2022)
Figure 8 Global Solar Canopy Carport Market Share (%) By Regions (2022)
Figure 9 North America Solar Canopy Carport Revenue (USD Million) By Country (2018-2022)
Figure 10 North America Solar Canopy Carport Revenue (USD Million) By Type (2018-2022)
Figure 11 North America Solar Canopy Carport Revenue (USD Million) By Applications (2018-2022)
Figure 12 Europe Solar Canopy Carport Revenue (USD Million) By Country (2018-2022)
Figure 13 Europe Solar Canopy Carport Revenue (USD Million) By Type (2018-2022)
Figure 14 Europe Solar Canopy Carport Revenue (USD Million) By Applications (2018-2022)
Figure 15 Asia Pacific Solar Canopy Carport Revenue (USD Million) By Country (2018-2022)
Figure 16 Asia Pacific Solar Canopy Carport Revenue (USD Million) By Type (2018-2022)
Figure 17 Asia Pacific Solar Canopy Carport Revenue (USD Million) By Applications (2018-2022)
Figure 18 South America Solar Canopy Carport Revenue (USD Million) By Country (2018-2022)
Figure 19 South America Solar Canopy Carport Revenue (USD Million) By Type (2018-2022)
Figure 20 South America Solar Canopy Carport Revenue (USD Million) By Applications (2018-2022)
Figure 21 Middle East and Africa Solar Canopy Carport Revenue (USD Million) By Region (2018-2022)
Figure 22 Middle East and Africa Solar Canopy Carport Revenue (USD Million) By Type (2018-2022)
Figure 23 Middle East and Africa Solar Canopy Carport Revenue (USD Million) By Applications (2018-2022)
Figure 24 Global Solar Canopy Carport Revenue (USD Million) By Type (2023-2030)
Figure 25 Global Solar Canopy Carport Revenue Market Share (%) By Type (2030)
Figure 26 Global Solar Canopy Carport Revenue (USD Million) By Applications (2023-2030)
Figure 27 Global Solar Canopy Carport Revenue Market Share (%) By Applications (2030)
Figure 28 Global Solar Canopy Carport Market Revenue (USD Million) By Regions (2023-2030)
Figure 29 North America Solar Canopy Carport Revenue (USD Million) By Country (2023-2030)
Figure 30 North America Solar Canopy Carport Revenue (USD Million) By Type (2023-2030)
Figure 31 North America Solar Canopy Carport Revenue (USD Million) By Applications (2023-2030)
Figure 32 Europe Solar Canopy Carport Revenue (USD Million) By Country (2023-2030)
Figure 33 Europe Solar Canopy Carport Revenue (USD Million) By Type (2023-2030)
Figure 34 Europe Solar Canopy Carport Revenue (USD Million) By Applications (2023-2030)
Figure 35 Asia Pacific Solar Canopy Carport Revenue (USD Million) By Country (2023-2030)
Figure 36 Asia Pacific Solar Canopy Carport Revenue (USD Million) By Type (2023-2030)
Figure 37 Asia Pacific Solar Canopy Carport Revenue (USD Million) By Applications (2023-2030)
Figure 38 South America Solar Canopy Carport Revenue (USD Million) By Country (2023-2030)
Figure 39 South America Solar Canopy Carport Revenue (USD Million) By Type (2023-2030)
Figure 40 South America Solar Canopy Carport Revenue (USD Million) By Applications (2023-2030)
Figure 41 Middle East and Africa Solar Canopy Carport Revenue (USD Million) By Region (2023-2030)
Figure 42 Middle East and Africa Solar Canopy Carport Revenue (USD Million) By Region (2023-2030)
Figure 43 Middle East and Africa Solar Canopy Carport Revenue (USD Million) By Type (2023-2030)
Figure 44 Middle East and Africa Solar Canopy Carport Revenue (USD Million) By Applications (2023-2030)
Figure 45 Bottom-Up and Top-Down Approaches for This Report
Figure 46 Data Triangulation
