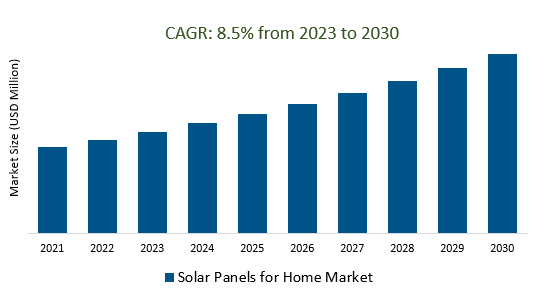
The Global Solar Panels for Home Market Size is estimated to register 8.5% growth over the forecast period from 2023 to 2030.
The Solar Panels for Home Market is driven by government incentives, environmental awareness, decreasing costs, energy independence, technological advancements, and the rise of electric vehicles. Homeowners are increasingly integrating energy storage systems like lithium-ion batteries with solar panels, integrating solar systems with smart home technology, and participating in community solar programs. The solar industry offers flexible financing options, emerging solar technologies, energy efficiency, consumer education, and global expansion. These factors make solar panels more affordable, environmentally friendly, and accessible to a wider range of homeowners. The market is also expanding globally, with increased adoption in regions beyond traditional solar leaders like the US and Europe.
Embracing Solar Panels as a Sustainable Solution for Climate-Conscious Homeowners is boosting the market.
The growing awareness of environmental concerns has led to an increasing number of climate-conscious homeowners embracing solar panels as a sustainable and eco-friendly solution for their energy needs. This shift in consumer preferences and the adoption of renewable energy technologies is having a significant impact on the Solar Panels for Home Market. As more individuals recognize the benefits of harnessing solar power, the market is experiencing a remarkable surge in demand. Solar panels not only offer homeowners a chance to reduce their carbon footprint but also provide long-term cost savings through reduced electricity bills. As government incentives and subsidies for solar installation continue to proliferate, this trend is expected to persist and drive further growth in the solar panels market. Homeowners are now keen to invest in a greener future, making solar panels an increasingly attractive choice for both sustainability and financial reasons. This shift towards solar solutions is a promising sign in the battle against climate change, contributing to a more sustainable and environmentally conscious future.
The Declining Costs of Solar Panels and Technology are attracting a wide customer base.
The continuous reduction in the costs of solar panels and advancements in solar technology have significantly widened the appeal of the Solar Panels for the Home Market. As prices continue to drop, more homeowners are finding it increasingly affordable to invest in solar energy solutions for their residences. This trend is not only fostering a sense of eco-consciousness but also enabling considerable savings on electricity bills. Furthermore, the attractive return on investment and government incentives for renewable energy adoption are further incentivizing homeowners to make the transition to solar power. With this growing customer base, solar panels for the home market are poised for substantial growth, contributing to a more sustainable and energy-efficient future.
Harnessing Sunlight and Battery Technology for Energy Solutions is creating a demand in the market.
The increasing emphasis on harnessing the power of sunlight and advancements in battery technology have ignited a significant surge in the demand for solar panels within the residential sector. As the world grapples with the urgent need for sustainable energy solutions, solar panels for home applications have emerged as a pivotal player in this transformation. Homeowners are now seeking ways to reduce their carbon footprint and energy bills simultaneously, and solar panels offer an efficient means to achieve this dual goal. This growing demand has led to remarkable innovations in the solar panel industry, making these systems more affordable, efficient, and aesthetically pleasing for residential use. In addition to lowering electricity costs, the adoption of solar panels can contribute to a greener and more sustainable environment, ushering in a cleaner and brighter future for our homes and the planet. As the solar panels for the home market continue to expand, it paves the way for a cleaner and more sustainable future, as well as exciting opportunities for homeowners to embrace renewable energy solutions.
Market Share Analysis:
Monocrystalline solar panels stand as the prevailing choice in the residential solar market due to their exceptional efficiency and long-lasting performance.
Monocrystalline solar panels are distinguished by their construction from a single, pure silicon crystal structure, which enables them to convert sunlight into electricity with great efficiency. Homeowners opt for monocrystalline panels because they offer a high-power output relative to their size, making them ideal for installations with limited roof space. Their durability is a noteworthy attribute, as they often come with extensive warranties, ensuring reliable and consistent energy generation for decades. With their sleek, black appearance and superior performance, monocrystalline solar panels are a popular choice for those seeking a cost-effective and environmentally friendly energy solution for their homes.
Online sales channels have emerged as the dominant force in the residential solar panel market, reshaping the way consumers access and purchase solar energy solutions.
With the convenience of e-commerce platforms, prospective homeowners can explore a wide range of solar panel options from the comfort of their homes. This shift towards online sales has not only democratized the market but also fostered greater competition among solar panel providers. Customers now have access to a wealth of information, enabling them to make well-informed decisions about the type of solar panels that best suit their needs. The rise of online sales channels also promotes sustainability, as it aligns with the eco-friendly nature of solar power. Overall, this trend signifies a transformative shift in the way people harness solar energy for their homes, making it more accessible and efficient than ever before.
The Asia Pacific region has emerged as the unequivocal leader in solar panels for the home market, firmly establishing its dominance in the renewable energy sector.
The meteoric rise can be attributed to several key factors. First and foremost, the region's growing population and rapid urbanization have created an ever-increasing demand for sustainable energy sources. Furthermore, governments in many Asia Pacific countries have implemented robust incentives and policies to promote solar energy adoption, further propelling the market's growth. Additionally, advancements in solar technology and manufacturing capabilities within the region have led to a significant reduction in the cost of solar panels, making them more accessible to homeowners. As a result, the Asia Pacific region continues to play a pivotal role in shaping the global solar panels market, paving the way for a greener and more sustainable future.
Solar Panels for Home Market Segmentation
By Type
- Monocrystalline Solar Panels
- Polycrystalline Solar Panels
- Thin-Film Amorphous Solar Panels
- Others
By Sales Channel
By Region
- North America (United States, Canada, Mexico)
- Europe (Germany, France, United Kingdom, Spain, Italy, Others)
- Asia Pacific (China, India, Japan, South Korea, Australia, Others)
- Latin America (Brazil, Argentina, Others)
- Middle East and Africa (Saudi Arabia, UAE, Kuwait, Other Middle East, South Africa, Nigeria, Other Africa)
Solar Panels for Home Market Companies
- DelSolar Co Ltd
- Juwi AG
- Renesola Zhejiang Ltd
- Evergreen Solar Inc
- CSUN Solar Tech Co Ltd
- SunEdison Inc
- Hanwha Corp
- Motech Industries Inc
- Neo Solar Power Corp
- Zhongli Talesun Solar Co Ltd
- Allpowers Industrial International Ltd
- Risen Energy Co Ltd
- Sharp Corp
- Shenzhen Portable Electronic Technology Co Ltd
- Shunfeng International Clean Energy Ltd (SFCE)
- Yingli Green Energy Holding Company Ltd
- Tata Power Solar Systems Ltd
- Trina Solar Energy Co Ltd
- Wuxi Suntech Power Co Ltd
- SoloPower Systems Inc
*List not exhaustive
Solar Panels for Home Market Outlook 2023
1 Market Overview
1.1 Introduction to the Solar Panels for Home Market
1.2 Scope of the Study
1.3 Research Objective
1.3.1 Key Market Scope and Segments
1.3.2 Players Covered
1.3.3 Years Considered
2 Executive Summary
2.1 2023 Solar Panels for Home Industry- Market Statistics
3 Market Dynamics
3.1 Market Drivers
3.2 Market Challenges
3.3 Market Opportunities
3.4 Market Trends
4 Market Factor Analysis
4.1 Porter’s Five Forces
4.2 Market Entropy
4.2.1 Global Solar Panels for Home Market Companies with Area Served
4.2.2 Products Offerings Global Solar Panels for Home Market
5 COVID-19 Impact Analysis and Outlook Scenarios
5.1.1 Covid-19 Impact Analysis
5.1.2 post-COVID-19 Scenario- Low Growth Case
5.1.3 post-COVID-19 Scenario- Reference Growth Case
5.1.4 post-COVID-19 Scenario- Low Growth Case
6 Global Solar Panels for Home Market Trends
6.1 Global Solar Panels for Home Revenue (USD Million) and CAGR (%) by Type (2018-2030)
6.2 Global Solar Panels for Home Revenue (USD Million) and CAGR (%) by Applications (2018-2030)
6.3 Global Solar Panels for Home Revenue (USD Million) and CAGR (%) by regions (2018-2030)
7 Global Solar Panels for Home Market Revenue (USD Million) by Type, and Applications (2018-2022)
7.1 Global Solar Panels for Home Revenue (USD Million) by Type (2018-2022)
7.1.1 Global Solar Panels for Home Revenue (USD Million), Market Share (%) by Type (2018-2022)
7.2 Global Solar Panels for Home Revenue (USD Million) by Applications (2018-2022)
7.2.1 Global Solar Panels for Home Revenue (USD Million), Market Share (%) by Applications (2018-2022)
8 Global Solar Panels for Home Development Regional Status and Outlook
8.1 Global Solar Panels for Home Revenue (USD Million) By Regions (2018-2022)
8.2 North America Solar Panels for Home Revenue (USD Million) by Type, and Application (2018-2022)
8.2.1 North America Solar Panels for Home Revenue (USD Million) by Country (2018-2022)
8.2.2 North America Solar Panels for Home Revenue (USD Million) by Type (2018-2022)
8.2.3 North America Solar Panels for Home Revenue (USD Million) by Applications (2018-2022)
8.3 Europe Solar Panels for Home Revenue (USD Million), by Type, and Applications (USD Million) (2018-2022)
8.3.1 Europe Solar Panels for Home Revenue (USD Million), by Country (2018-2022)
8.3.2 Europe Solar Panels for Home Revenue (USD Million) by Type (2018-2022)
8.3.3 Europe Solar Panels for Home Revenue (USD Million) by Applications (2018-2022)
8.4 Asia Pacific Solar Panels for Home Revenue (USD Million), and Revenue (USD Million) by Type, and Applications (2018-2022)
8.4.1 Asia Pacific Solar Panels for Home Revenue (USD Million) by Country (2018-2022)
8.4.2 Asia Pacific Solar Panels for Home Revenue (USD Million) by Type (2018-2022)
8.4.3 Asia Pacific Solar Panels for Home Revenue (USD Million) by Applications (2018-2022)
8.5 South America Solar Panels for Home Revenue (USD Million), by Type, and Applications (2018-2022)
8.5.1 South America Solar Panels for Home Revenue (USD Million), by Country (2018-2022)
8.5.2 South America Solar Panels for Home Revenue (USD Million) by Type (2018-2022)
8.5.3 South America Solar Panels for Home Revenue (USD Million) by Applications (2018-2022)
8.6 Middle East and Africa Solar Panels for Home Revenue (USD Million), by Type, Technology, Application, Thickness (2018-2022)
8.6.1 Middle East and Africa Solar Panels for Home Revenue (USD Million) by Country (2018-2022)
8.6.2 Middle East and Africa Solar Panels for Home Revenue (USD Million) by Type (2018-2022)
8.6.3 Middle East and Africa Solar Panels for Home Revenue (USD Million) by Applications (2018-2022)
9 Company Profiles
10 Global Solar Panels for Home Market Revenue (USD Million), by Type, and Applications (2023-2030)
10.1 Global Solar Panels for Home Revenue (USD Million) and Market Share (%) by Type (2023-2030)
10.1.1 Global Solar Panels for Home Revenue (USD Million), and Market Share (%) by Type (2023-2030)
10.2 Global Solar Panels for Home Revenue (USD Million) and Market Share (%) by Applications (2023-2030)
10.2.1 Global Solar Panels for Home Revenue (USD Million), and Market Share (%) by Applications (2023-2030)
11 Global Solar Panels for Home Development Regional Status and Outlook Forecast
11.1 Global Solar Panels for Home Revenue (USD Million) By Regions (2023-2030)
11.2 North America Solar Panels for Home Revenue (USD Million) by Type, and Applications (2023-2030)
11.2.1 North America Solar Panels for Home Revenue (USD) Million by Country (2023-2030)
11.2.2 North America Solar Panels for Home Revenue (USD Million), by Type (2023-2030)
11.2.3 North America Solar Panels for Home Revenue (USD Million), Market Share (%) by Applications (2023-2030)
11.3 Europe Solar Panels for Home Revenue (USD Million), by Type, and Applications (2023-2030)
11.3.1 Europe Solar Panels for Home Revenue (USD Million), by Country (2023-2030)
11.3.2 Europe Solar Panels for Home Revenue (USD Million), by Type (2023-2030)
11.3.3 Europe Solar Panels for Home Revenue (USD Million), by Applications (2023-2030)
11.4 Asia Pacific Solar Panels for Home Revenue (USD Million) by Type, and Applications (2023-2030)
11.4.1 Asia Pacific Solar Panels for Home Revenue (USD Million), by Country (2023-2030)
11.4.2 Asia Pacific Solar Panels for Home Revenue (USD Million), by Type (2023-2030)
11.4.3 Asia Pacific Solar Panels for Home Revenue (USD Million), by Applications (2023-2030)
11.5 South America Solar Panels for Home Revenue (USD Million), by Type, and Applications (2023-2030)
11.5.1 South America Solar Panels for Home Revenue (USD Million), by Country (2023-2030)
11.5.2 South America Solar Panels for Home Revenue (USD Million), by Type (2023-2030)
11.5.3 South America Solar Panels for Home Revenue (USD Million), by Applications (2023-2030)
11.6 Middle East and Africa Solar Panels for Home Revenue (USD Million), by Type, and Applications (2023-2030)
11.6.1 Middle East and Africa Solar Panels for Home Revenue (USD Million), by region (2023-2030)
11.6.2 Middle East and Africa Solar Panels for Home Revenue (USD Million), by Type (2023-2030)
11.6.3 Middle East and Africa Solar Panels for Home Revenue (USD Million), by Applications (2023-2030)
12 Methodology and Data Sources
12.1 Methodology/Research Approach
12.1.1 Research Programs/Design
12.1.2 Market Size Estimation
12.1.3 Market Breakdown and Data Triangulation
12.2 Data Sources
12.2.1 Secondary Sources
12.2.2 Primary Sources
12.3 Disclaimer
List of Tables
Table 1 Market Segmentation Analysis
Table 2 Global Solar Panels for Home Market Companies with Areas Served
Table 3 Products Offerings Global Solar Panels for Home Market
Table 4 Low Growth Scenario Forecasts
Table 5 Reference Case Growth Scenario
Table 6 High Growth Case Scenario
Table 7 Global Solar Panels for Home Revenue (USD Million) And CAGR (%) By Type (2018-2030)
Table 8 Global Solar Panels for Home Revenue (USD Million) And CAGR (%) By Applications (2018-2030)
Table 9 Global Solar Panels for Home Revenue (USD Million) And CAGR (%) By Regions (2018-2030)
Table 10 Global Solar Panels for Home Revenue (USD Million) By Type (2018-2022)
Table 11 Global Solar Panels for Home Revenue Market Share (%) By Type (2018-2022)
Table 12 Global Solar Panels for Home Revenue (USD Million) By Applications (2018-2022)
Table 13 Global Solar Panels for Home Revenue Market Share (%) By Applications (2018-2022)
Table 14 Global Solar Panels for Home Market Revenue (USD Million) By Regions (2018-2022)
Table 15 Global Solar Panels for Home Market Share (%) By Regions (2018-2022)
Table 16 North America Solar Panels for Home Revenue (USD Million) By Country (2018-2022)
Table 17 North America Solar Panels for Home Revenue (USD Million) By Type (2018-2022)
Table 18 North America Solar Panels for Home Revenue (USD Million) By Applications (2018-2022)
Table 19 Europe Solar Panels for Home Revenue (USD Million) By Country (2018-2022)
Table 20 Europe Solar Panels for Home Revenue (USD Million) By Type (2018-2022)
Table 21 Europe Solar Panels for Home Revenue (USD Million) By Applications (2018-2022)
Table 22 Asia Pacific Solar Panels for Home Revenue (USD Million) By Country (2018-2022)
Table 23 Asia Pacific Solar Panels for Home Revenue (USD Million) By Type (2018-2022)
Table 24 Asia Pacific Solar Panels for Home Revenue (USD Million) By Applications (2018-2022)
Table 25 South America Solar Panels for Home Revenue (USD Million) By Country (2018-2022)
Table 26 South America Solar Panels for Home Revenue (USD Million) By Type (2018-2022)
Table 27 South America Solar Panels for Home Revenue (USD Million) By Applications (2018-2022)
Table 28 Middle East and Africa Solar Panels for Home Revenue (USD Million) By Region (2018-2022)
Table 29 Middle East and Africa Solar Panels for Home Revenue (USD Million) By Type (2018-2022)
Table 30 Middle East and Africa Solar Panels for Home Revenue (USD Million) By Applications (2018-2022)
Table 31 Financial Analysis
Table 32 Global Solar Panels for Home Revenue (USD Million) By Type (2023-2030)
Table 33 Global Solar Panels for Home Revenue Market Share (%) By Type (2023-2030)
Table 34 Global Solar Panels for Home Revenue (USD Million) By Applications (2023-2030)
Table 35 Global Solar Panels for Home Revenue Market Share (%) By Applications (2023-2030)
Table 36 Global Solar Panels for Home Market Revenue (USD Million), And Revenue (USD Million) By Regions (2023-2030)
Table 37 North America Solar Panels for Home Revenue (USD)By Country (2023-2030)
Table 38 North America Solar Panels for Home Revenue (USD Million) By Type (2023-2030)
Table 39 North America Solar Panels for Home Revenue (USD Million) By Applications (2023-2030)
Table 40 Europe Solar Panels for Home Revenue (USD Million) By Country (2023-2030)
Table 41 Europe Solar Panels for Home Revenue (USD Million) By Type (2023-2030)
Table 42 Europe Solar Panels for Home Revenue (USD Million) By Applications (2023-2030)
Table 43 Asia Pacific Solar Panels for Home Revenue (USD Million) By Country (2023-2030)
Table 44 Asia Pacific Solar Panels for Home Revenue (USD Million) By Type (2023-2030)
Table 45 Asia Pacific Solar Panels for Home Revenue (USD Million) By Applications (2023-2030)
Table 46 South America Solar Panels for Home Revenue (USD Million) By Country (2023-2030)
Table 47 South America Solar Panels for Home Revenue (USD Million) By Type (2023-2030)
Table 48 South America Solar Panels for Home Revenue (USD Million) By Applications (2023-2030)
Table 49 Middle East and Africa Solar Panels for Home Revenue (USD Million) By Region (2023-2030)
Table 50 Middle East and Africa Solar Panels for Home Revenue (USD Million) By Region (2023-2030)
Table 51 Middle East and Africa Solar Panels for Home Revenue (USD Million) By Type (2023-2030)
Table 52 Middle East and Africa Solar Panels for Home Revenue (USD Million) By Applications (2023-2030)
Table 53 Research Programs/Design for This Report
Table 54 Key Data Information from Secondary Sources
Table 55 Key Data Information from Primary Sources
List of Figures
Figure 1 Market Scope
Figure 2 Porter’s Five Forces
Figure 3 Global Solar Panels for Home Revenue (USD Million) By Type (2018-2022)
Figure 4 Global Solar Panels for Home Revenue Market Share (%) By Type (2022)
Figure 5 Global Solar Panels for Home Revenue (USD Million) By Applications (2018-2022)
Figure 6 Global Solar Panels for Home Revenue Market Share (%) By Applications (2022)
Figure 7 Global Solar Panels for Home Market Revenue (USD Million) By Regions (2018-2022)
Figure 8 Global Solar Panels for Home Market Share (%) By Regions (2022)
Figure 9 North America Solar Panels for Home Revenue (USD Million) By Country (2018-2022)
Figure 10 North America Solar Panels for Home Revenue (USD Million) By Type (2018-2022)
Figure 11 North America Solar Panels for Home Revenue (USD Million) By Applications (2018-2022)
Figure 12 Europe Solar Panels for Home Revenue (USD Million) By Country (2018-2022)
Figure 13 Europe Solar Panels for Home Revenue (USD Million) By Type (2018-2022)
Figure 14 Europe Solar Panels for Home Revenue (USD Million) By Applications (2018-2022)
Figure 15 Asia Pacific Solar Panels for Home Revenue (USD Million) By Country (2018-2022)
Figure 16 Asia Pacific Solar Panels for Home Revenue (USD Million) By Type (2018-2022)
Figure 17 Asia Pacific Solar Panels for Home Revenue (USD Million) By Applications (2018-2022)
Figure 18 South America Solar Panels for Home Revenue (USD Million) By Country (2018-2022)
Figure 19 South America Solar Panels for Home Revenue (USD Million) By Type (2018-2022)
Figure 20 South America Solar Panels for Home Revenue (USD Million) By Applications (2018-2022)
Figure 21 Middle East and Africa Solar Panels for Home Revenue (USD Million) By Region (2018-2022)
Figure 22 Middle East and Africa Solar Panels for Home Revenue (USD Million) By Type (2018-2022)
Figure 23 Middle East and Africa Solar Panels for Home Revenue (USD Million) By Applications (2018-2022)
Figure 24 Global Solar Panels for Home Revenue (USD Million) By Type (2023-2030)
Figure 25 Global Solar Panels for Home Revenue Market Share (%) By Type (2030)
Figure 26 Global Solar Panels for Home Revenue (USD Million) By Applications (2023-2030)
Figure 27 Global Solar Panels for Home Revenue Market Share (%) By Applications (2030)
Figure 28 Global Solar Panels for Home Market Revenue (USD Million) By Regions (2023-2030)
Figure 29 North America Solar Panels for Home Revenue (USD Million) By Country (2023-2030)
Figure 30 North America Solar Panels for Home Revenue (USD Million) By Type (2023-2030)
Figure 31 North America Solar Panels for Home Revenue (USD Million) By Applications (2023-2030)
Figure 32 Europe Solar Panels for Home Revenue (USD Million) By Country (2023-2030)
Figure 33 Europe Solar Panels for Home Revenue (USD Million) By Type (2023-2030)
Figure 34 Europe Solar Panels for Home Revenue (USD Million) By Applications (2023-2030)
Figure 35 Asia Pacific Solar Panels for Home Revenue (USD Million) By Country (2023-2030)
Figure 36 Asia Pacific Solar Panels for Home Revenue (USD Million) By Type (2023-2030)
Figure 37 Asia Pacific Solar Panels for Home Revenue (USD Million) By Applications (2023-2030)
Figure 38 South America Solar Panels for Home Revenue (USD Million) By Country (2023-2030)
Figure 39 South America Solar Panels for Home Revenue (USD Million) By Type (2023-2030)
Figure 40 South America Solar Panels for Home Revenue (USD Million) By Applications (2023-2030)
Figure 41 Middle East and Africa Solar Panels for Home Revenue (USD Million) By Region (2023-2030)
Figure 42 Middle East and Africa Solar Panels for Home Revenue (USD Million) By Region (2023-2030)
Figure 43 Middle East and Africa Solar Panels for Home Revenue (USD Million) By Type (2023-2030)
Figure 44 Middle East and Africa Solar Panels for Home Revenue (USD Million) By Applications (2023-2030)
Figure 45 Bottom-Up and Top-Down Approaches for This Report
Figure 46 Data Triangulation
