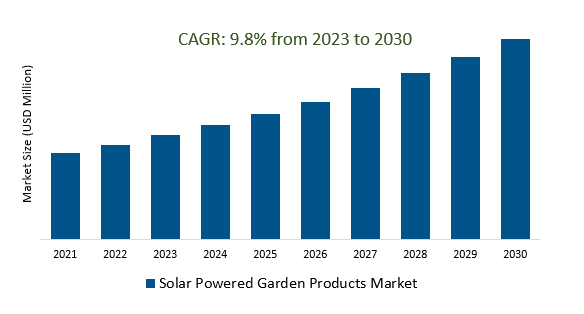
The Global Solar Powered Garden Products Market Size is estimated to register 9.8% growth over the forecast period from 2023 to 2030.
The market growth is driven by the increasing Integration of smart technology into garden products, such as solar-powered lights with remote control or smartphone connectivity, which is gaining popularity. Leading companies that are focused on Technological Advancements, Smart and Connected Products, Energy Storage Solutions, Customization and Design, Global Expansion, Education and awareness, and others to boost market shares in the industry.
Market Overview
The Solar Powered Garden Products Market consists of solar-powered outdoor items like lights, water features, and decorative products, driven by a surge in environmental awareness, advancements in solar technology, and government incentives. While these products offer energy savings and aesthetics, challenges include initial costs, weather dependency, and battery lifespan concerns. Opportunities lie in smart integration, global expansion, diversification, and education efforts to promote solar power adoption.
Market Dynamics
Market Trends - Solar-Powered Garden Product Innovations
Recent innovations in solar-powered garden products include integrated solar panels for aesthetics and efficiency, advanced batteries for prolonged operation, smart connectivity with IoT and apps, multi-functionality combining lighting with features like speakers or cameras, customizable designs, motion sensors for security and energy conservation, color-changing LED lighting, solar-powered water features, flexible panels for unique designs, charging stations, weather-resistant construction, and educational kits. These innovations cater to the growing demand for eco-friendly, versatile, and efficient outdoor products, with continued advancements expected in the future.
Market Driver- Growing Home Improvement Market Demand Solar Powered Garden Products Market
The growing home improvement market is driving increased demand for solar-powered garden products as homeowners seek eco-friendly and energy-efficient solutions to enhance their outdoor spaces. Solar garden products, including lights, water features, and decorative items, align with this trend, offering a sustainable way to beautify gardens while saving on energy costs. This synergy between the home improvement and solar garden product markets is expected to persist as sustainability and energy efficiency remain top priorities for homeowners.
Market Opportunity-Introduction of Technological Innovation
Technological innovation in the Solar Powered Garden Products Market includes enhancements in solar panel efficiency, advanced batteries for extended operation, smart controls via IoT and apps, multi-functionality combining lighting with other features, customizable designs, improved energy storage, durability in various weather conditions, flexible solar panels for unique designs, and educational kits for learning about solar energy. These innovations enhance solar garden products' performance, aesthetics, and functionality, making them more appealing and efficient for consumers while promoting sustainability.
Market Share Analysis- The lamps and Lanterns Solar Powered Garden Products Market will register the fastest growth
The Global Solar Powered Garden Products Market is analyzed across Lamps Lanterns, Fountain, and others. Lamps and Lanterns are poised to register the fastest growth. Solar-powered lamps and lanterns play a crucial role in the Solar Powered Garden Products Market by providing energy-efficient illumination and aesthetic enhancement to outdoor spaces. These products utilize solar panels to collect sunlight during the day and emit light during the night, with various styles such as hanging lanterns, pathway lights, and table lamps. Equipped with LED bulbs and often featuring smart controls, they offer eco-friendly and cost-effective lighting solutions, aligning with the growing demand for sustainable outdoor living.
Market Share Analysis- Offline Sales held a significant market share in 2023
The Global Solar Powered Garden Products Market is analyzed across various applications including Online Sales, Offline Sales, and others. Of these, Offline Sales held a significant market share in 2023. Offline sales in the Solar Powered Garden Products Market involve the physical retail distribution and purchase of solar garden products through channels such as home improvement stores, specialty garden retailers, department stores, local garden centers, furniture and decor stores, outdoor markets, and electronics stores. These brick-and-mortar outlets offer a hands-on shopping experience, guidance, and immediate product availability, complementing the online sales channels that have also gained prominence in this market.
Solar Powered Garden Products Market Segmentation
By Type
- Lamps and Lanterns
- Fountain
- Others
By Application
- Online Sales
- Offline Sales
By Region
- North America (United States, Canada, Mexico)
- Europe (Germany, France, United Kingdom, Spain, Italy, Others)
- Asia Pacific (China, India, Japan, South Korea, Australia, Others)
- Latin America (Brazil, Argentina, Others)
- Middle East and Africa (Saudi Arabia, UAE, Kuwait, Other Middle East, South Africa, Nigeria, Other Africa)
Solar Powered Garden Products Market Companies
- Bunnings Australia
- Anern
- BLUE CARBON
- HeiSolar
- PowerBee Ltd
- RPS
- Silicon Sola
- Smart Garden Products
- Sun Master
- Touch Of ECO
- Solar Bird Bath
*List not exhaustive
Solar Powered Garden Products Market Outlook 2023
1 Market Overview
1.1 Introduction to the Solar Powered Garden Products Market
1.2 Scope of the Study
1.3 Research Objective
1.3.1 Key Market Scope and Segments
1.3.2 Players Covered
1.3.3 Years Considered
2 Executive Summary
2.1 2023 Solar Powered Garden Products Industry- Market Statistics
3 Market Dynamics
3.1 Market Drivers
3.2 Market Challenges
3.3 Market Opportunities
3.4 Market Trends
4 Market Factor Analysis
4.1 Porter’s Five Forces
4.2 Market Entropy
4.2.1 Global Solar Powered Garden Products Market Companies with Area Served
4.2.2 Products Offerings Global Solar Powered Garden Products Market
5 COVID-19 Impact Analysis and Outlook Scenarios
5.1.1 Covid-19 Impact Analysis
5.1.2 post-COVID-19 Scenario- Low Growth Case
5.1.3 post-COVID-19 Scenario- Reference Growth Case
5.1.4 post-COVID-19 Scenario- Low Growth Case
6 Global Solar Powered Garden Products Market Trends
6.1 Global Solar Powered Garden Products Revenue (USD Million) and CAGR (%) by Type (2018-2030)
6.2 Global Solar Powered Garden Products Revenue (USD Million) and CAGR (%) by Applications (2018-2030)
6.3 Global Solar Powered Garden Products Revenue (USD Million) and CAGR (%) by regions (2018-2030)
7 Global Solar Powered Garden Products Market Revenue (USD Million) by Type, and Applications (2018-2022)
7.1 Global Solar Powered Garden Products Revenue (USD Million) by Type (2018-2022)
7.1.1 Global Solar Powered Garden Products Revenue (USD Million), Market Share (%) by Type (2018-2022)
7.2 Global Solar Powered Garden Products Revenue (USD Million) by Applications (2018-2022)
7.2.1 Global Solar Powered Garden Products Revenue (USD Million), Market Share (%) by Applications (2018-2022)
8 Global Solar Powered Garden Products Development Regional Status and Outlook
8.1 Global Solar Powered Garden Products Revenue (USD Million) By Regions (2018-2022)
8.2 North America Solar Powered Garden Products Revenue (USD Million) by Type, and Application (2018-2022)
8.2.1 North America Solar Powered Garden Products Revenue (USD Million) by Country (2018-2022)
8.2.2 North America Solar Powered Garden Products Revenue (USD Million) by Type (2018-2022)
8.2.3 North America Solar Powered Garden Products Revenue (USD Million) by Applications (2018-2022)
8.3 Europe Solar Powered Garden Products Revenue (USD Million), by Type, and Applications (USD Million) (2018-2022)
8.3.1 Europe Solar Powered Garden Products Revenue (USD Million), by Country (2018-2022)
8.3.2 Europe Solar Powered Garden Products Revenue (USD Million) by Type (2018-2022)
8.3.3 Europe Solar Powered Garden Products Revenue (USD Million) by Applications (2018-2022)
8.4 Asia Pacific Solar Powered Garden Products Revenue (USD Million), and Revenue (USD Million) by Type, and Applications (2018-2022)
8.4.1 Asia Pacific Solar Powered Garden Products Revenue (USD Million) by Country (2018-2022)
8.4.2 Asia Pacific Solar Powered Garden Products Revenue (USD Million) by Type (2018-2022)
8.4.3 Asia Pacific Solar Powered Garden Products Revenue (USD Million) by Applications (2018-2022)
8.5 South America Solar Powered Garden Products Revenue (USD Million), by Type, and Applications (2018-2022)
8.5.1 South America Solar Powered Garden Products Revenue (USD Million), by Country (2018-2022)
8.5.2 South America Solar Powered Garden Products Revenue (USD Million) by Type (2018-2022)
8.5.3 South America Solar Powered Garden Products Revenue (USD Million) by Applications (2018-2022)
8.6 Middle East and Africa Solar Powered Garden Products Revenue (USD Million), by Type, Technology, Application, Thickness (2018-2022)
8.6.1 Middle East and Africa Solar Powered Garden Products Revenue (USD Million) by Country (2018-2022)
8.6.2 Middle East and Africa Solar Powered Garden Products Revenue (USD Million) by Type (2018-2022)
8.6.3 Middle East and Africa Solar Powered Garden Products Revenue (USD Million) by Applications (2018-2022)
9 Company Profiles
10 Global Solar Powered Garden Products Market Revenue (USD Million), by Type, and Applications (2023-2030)
10.1 Global Solar Powered Garden Products Revenue (USD Million) and Market Share (%) by Type (2023-2030)
10.1.1 Global Solar Powered Garden Products Revenue (USD Million), and Market Share (%) by Type (2023-2030)
10.2 Global Solar Powered Garden Products Revenue (USD Million) and Market Share (%) by Applications (2023-2030)
10.2.1 Global Solar Powered Garden Products Revenue (USD Million), and Market Share (%) by Applications (2023-2030)
11 Global Solar Powered Garden Products Development Regional Status and Outlook Forecast
11.1 Global Solar Powered Garden Products Revenue (USD Million) By Regions (2023-2030)
11.2 North America Solar Powered Garden Products Revenue (USD Million) by Type, and Applications (2023-2030)
11.2.1 North America Solar Powered Garden Products Revenue (USD) Million by Country (2023-2030)
11.2.2 North America Solar Powered Garden Products Revenue (USD Million), by Type (2023-2030)
11.2.3 North America Solar Powered Garden Products Revenue (USD Million), Market Share (%) by Applications (2023-2030)
11.3 Europe Solar Powered Garden Products Revenue (USD Million), by Type, and Applications (2023-2030)
11.3.1 Europe Solar Powered Garden Products Revenue (USD Million), by Country (2023-2030)
11.3.2 Europe Solar Powered Garden Products Revenue (USD Million), by Type (2023-2030)
11.3.3 Europe Solar Powered Garden Products Revenue (USD Million), by Applications (2023-2030)
11.4 Asia Pacific Solar Powered Garden Products Revenue (USD Million) by Type, and Applications (2023-2030)
11.4.1 Asia Pacific Solar Powered Garden Products Revenue (USD Million), by Country (2023-2030)
11.4.2 Asia Pacific Solar Powered Garden Products Revenue (USD Million), by Type (2023-2030)
11.4.3 Asia Pacific Solar Powered Garden Products Revenue (USD Million), by Applications (2023-2030)
11.5 South America Solar Powered Garden Products Revenue (USD Million), by Type, and Applications (2023-2030)
11.5.1 South America Solar Powered Garden Products Revenue (USD Million), by Country (2023-2030)
11.5.2 South America Solar Powered Garden Products Revenue (USD Million), by Type (2023-2030)
11.5.3 South America Solar Powered Garden Products Revenue (USD Million), by Applications (2023-2030)
11.6 Middle East and Africa Solar Powered Garden Products Revenue (USD Million), by Type, and Applications (2023-2030)
11.6.1 Middle East and Africa Solar Powered Garden Products Revenue (USD Million), by region (2023-2030)
11.6.2 Middle East and Africa Solar Powered Garden Products Revenue (USD Million), by Type (2023-2030)
11.6.3 Middle East and Africa Solar Powered Garden Products Revenue (USD Million), by Applications (2023-2030)
12 Methodology and Data Sources
12.1 Methodology/Research Approach
12.1.1 Research Programs/Design
12.1.2 Market Size Estimation
12.1.3 Market Breakdown and Data Triangulation
12.2 Data Sources
12.2.1 Secondary Sources
12.2.2 Primary Sources
12.3 Disclaimer
List of Tables
Table 1 Market Segmentation Analysis
Table 2 Global Solar Powered Garden Products Market Companies with Areas Served
Table 3 Products Offerings Global Solar Powered Garden Products Market
Table 4 Low Growth Scenario Forecasts
Table 5 Reference Case Growth Scenario
Table 6 High Growth Case Scenario
Table 7 Global Solar Powered Garden Products Revenue (USD Million) And CAGR (%) By Type (2018-2030)
Table 8 Global Solar Powered Garden Products Revenue (USD Million) And CAGR (%) By Applications (2018-2030)
Table 9 Global Solar Powered Garden Products Revenue (USD Million) And CAGR (%) By Regions (2018-2030)
Table 10 Global Solar Powered Garden Products Revenue (USD Million) By Type (2018-2022)
Table 11 Global Solar Powered Garden Products Revenue Market Share (%) By Type (2018-2022)
Table 12 Global Solar Powered Garden Products Revenue (USD Million) By Applications (2018-2022)
Table 13 Global Solar Powered Garden Products Revenue Market Share (%) By Applications (2018-2022)
Table 14 Global Solar Powered Garden Products Market Revenue (USD Million) By Regions (2018-2022)
Table 15 Global Solar Powered Garden Products Market Share (%) By Regions (2018-2022)
Table 16 North America Solar Powered Garden Products Revenue (USD Million) By Country (2018-2022)
Table 17 North America Solar Powered Garden Products Revenue (USD Million) By Type (2018-2022)
Table 18 North America Solar Powered Garden Products Revenue (USD Million) By Applications (2018-2022)
Table 19 Europe Solar Powered Garden Products Revenue (USD Million) By Country (2018-2022)
Table 20 Europe Solar Powered Garden Products Revenue (USD Million) By Type (2018-2022)
Table 21 Europe Solar Powered Garden Products Revenue (USD Million) By Applications (2018-2022)
Table 22 Asia Pacific Solar Powered Garden Products Revenue (USD Million) By Country (2018-2022)
Table 23 Asia Pacific Solar Powered Garden Products Revenue (USD Million) By Type (2018-2022)
Table 24 Asia Pacific Solar Powered Garden Products Revenue (USD Million) By Applications (2018-2022)
Table 25 South America Solar Powered Garden Products Revenue (USD Million) By Country (2018-2022)
Table 26 South America Solar Powered Garden Products Revenue (USD Million) By Type (2018-2022)
Table 27 South America Solar Powered Garden Products Revenue (USD Million) By Applications (2018-2022)
Table 28 Middle East and Africa Solar Powered Garden Products Revenue (USD Million) By Region (2018-2022)
Table 29 Middle East and Africa Solar Powered Garden Products Revenue (USD Million) By Type (2018-2022)
Table 30 Middle East and Africa Solar Powered Garden Products Revenue (USD Million) By Applications (2018-2022)
Table 31 Financial Analysis
Table 32 Global Solar Powered Garden Products Revenue (USD Million) By Type (2023-2030)
Table 33 Global Solar Powered Garden Products Revenue Market Share (%) By Type (2023-2030)
Table 34 Global Solar Powered Garden Products Revenue (USD Million) By Applications (2023-2030)
Table 35 Global Solar Powered Garden Products Revenue Market Share (%) By Applications (2023-2030)
Table 36 Global Solar Powered Garden Products Market Revenue (USD Million), And Revenue (USD Million) By Regions (2023-2030)
Table 37 North America Solar Powered Garden Products Revenue (USD)By Country (2023-2030)
Table 38 North America Solar Powered Garden Products Revenue (USD Million) By Type (2023-2030)
Table 39 North America Solar Powered Garden Products Revenue (USD Million) By Applications (2023-2030)
Table 40 Europe Solar Powered Garden Products Revenue (USD Million) By Country (2023-2030)
Table 41 Europe Solar Powered Garden Products Revenue (USD Million) By Type (2023-2030)
Table 42 Europe Solar Powered Garden Products Revenue (USD Million) By Applications (2023-2030)
Table 43 Asia Pacific Solar Powered Garden Products Revenue (USD Million) By Country (2023-2030)
Table 44 Asia Pacific Solar Powered Garden Products Revenue (USD Million) By Type (2023-2030)
Table 45 Asia Pacific Solar Powered Garden Products Revenue (USD Million) By Applications (2023-2030)
Table 46 South America Solar Powered Garden Products Revenue (USD Million) By Country (2023-2030)
Table 47 South America Solar Powered Garden Products Revenue (USD Million) By Type (2023-2030)
Table 48 South America Solar Powered Garden Products Revenue (USD Million) By Applications (2023-2030)
Table 49 Middle East and Africa Solar Powered Garden Products Revenue (USD Million) By Region (2023-2030)
Table 50 Middle East and Africa Solar Powered Garden Products Revenue (USD Million) By Region (2023-2030)
Table 51 Middle East and Africa Solar Powered Garden Products Revenue (USD Million) By Type (2023-2030)
Table 52 Middle East and Africa Solar Powered Garden Products Revenue (USD Million) By Applications (2023-2030)
Table 53 Research Programs/Design for This Report
Table 54 Key Data Information from Secondary Sources
Table 55 Key Data Information from Primary Sources
List of Figures
Figure 1 Market Scope
Figure 2 Porter’s Five Forces
Figure 3 Global Solar Powered Garden Products Revenue (USD Million) By Type (2018-2022)
Figure 4 Global Solar Powered Garden Products Revenue Market Share (%) By Type (2022)
Figure 5 Global Solar Powered Garden Products Revenue (USD Million) By Applications (2018-2022)
Figure 6 Global Solar Powered Garden Products Revenue Market Share (%) By Applications (2022)
Figure 7 Global Solar Powered Garden Products Market Revenue (USD Million) By Regions (2018-2022)
Figure 8 Global Solar Powered Garden Products Market Share (%) By Regions (2022)
Figure 9 North America Solar Powered Garden Products Revenue (USD Million) By Country (2018-2022)
Figure 10 North America Solar Powered Garden Products Revenue (USD Million) By Type (2018-2022)
Figure 11 North America Solar Powered Garden Products Revenue (USD Million) By Applications (2018-2022)
Figure 12 Europe Solar Powered Garden Products Revenue (USD Million) By Country (2018-2022)
Figure 13 Europe Solar Powered Garden Products Revenue (USD Million) By Type (2018-2022)
Figure 14 Europe Solar Powered Garden Products Revenue (USD Million) By Applications (2018-2022)
Figure 15 Asia Pacific Solar Powered Garden Products Revenue (USD Million) By Country (2018-2022)
Figure 16 Asia Pacific Solar Powered Garden Products Revenue (USD Million) By Type (2018-2022)
Figure 17 Asia Pacific Solar Powered Garden Products Revenue (USD Million) By Applications (2018-2022)
Figure 18 South America Solar Powered Garden Products Revenue (USD Million) By Country (2018-2022)
Figure 19 South America Solar Powered Garden Products Revenue (USD Million) By Type (2018-2022)
Figure 20 South America Solar Powered Garden Products Revenue (USD Million) By Applications (2018-2022)
Figure 21 Middle East and Africa Solar Powered Garden Products Revenue (USD Million) By Region (2018-2022)
Figure 22 Middle East and Africa Solar Powered Garden Products Revenue (USD Million) By Type (2018-2022)
Figure 23 Middle East and Africa Solar Powered Garden Products Revenue (USD Million) By Applications (2018-2022)
Figure 24 Global Solar Powered Garden Products Revenue (USD Million) By Type (2023-2030)
Figure 25 Global Solar Powered Garden Products Revenue Market Share (%) By Type (2030)
Figure 26 Global Solar Powered Garden Products Revenue (USD Million) By Applications (2023-2030)
Figure 27 Global Solar Powered Garden Products Revenue Market Share (%) By Applications (2030)
Figure 28 Global Solar Powered Garden Products Market Revenue (USD Million) By Regions (2023-2030)
Figure 29 North America Solar Powered Garden Products Revenue (USD Million) By Country (2023-2030)
Figure 30 North America Solar Powered Garden Products Revenue (USD Million) By Type (2023-2030)
Figure 31 North America Solar Powered Garden Products Revenue (USD Million) By Applications (2023-2030)
Figure 32 Europe Solar Powered Garden Products Revenue (USD Million) By Country (2023-2030)
Figure 33 Europe Solar Powered Garden Products Revenue (USD Million) By Type (2023-2030)
Figure 34 Europe Solar Powered Garden Products Revenue (USD Million) By Applications (2023-2030)
Figure 35 Asia Pacific Solar Powered Garden Products Revenue (USD Million) By Country (2023-2030)
Figure 36 Asia Pacific Solar Powered Garden Products Revenue (USD Million) By Type (2023-2030)
Figure 37 Asia Pacific Solar Powered Garden Products Revenue (USD Million) By Applications (2023-2030)
Figure 38 South America Solar Powered Garden Products Revenue (USD Million) By Country (2023-2030)
Figure 39 South America Solar Powered Garden Products Revenue (USD Million) By Type (2023-2030)
Figure 40 South America Solar Powered Garden Products Revenue (USD Million) By Applications (2023-2030)
Figure 41 Middle East and Africa Solar Powered Garden Products Revenue (USD Million) By Region (2023-2030)
Figure 42 Middle East and Africa Solar Powered Garden Products Revenue (USD Million) By Region (2023-2030)
Figure 43 Middle East and Africa Solar Powered Garden Products Revenue (USD Million) By Type (2023-2030)
Figure 44 Middle East and Africa Solar Powered Garden Products Revenue (USD Million) By Applications (2023-2030)
Figure 45 Bottom-Up and Top-Down Approaches for This Report
Figure 46 Data Triangulation
