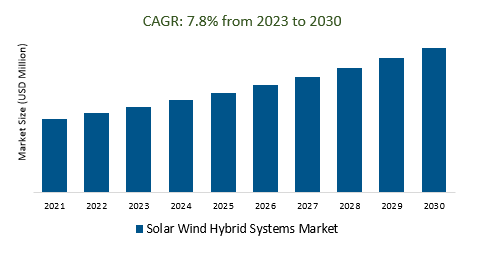
The Global Solar Wind Hybrid Systems Market Size is estimated to register 7.8% growth over the forecast period from 2023 to 2030.
The market growth is driven by increasing environmental awareness and the need to reduce carbon emissions were strong drivers for the adoption of solar-wind hybrid systems as they produce clean energy. Leading Companies focusing on Increased Renewable Energy Integration, Grid Modernization, Hybridization with Other Technologies, Industrial and Commercial Applications, Environmental and Energy Security Concerns, and others to boost market shares in the industry.
Market Overview
The solar-wind hybrid systems market involves combining solar panels and wind turbines to create a reliable and sustainable energy source that compensates for the intermittent nature of each technology. These systems find applications in grid integration, off-grid and rural electrification, industrial, commercial, and residential settings, offering clean energy, cost savings, and some degree of energy independence. Challenges include managing intermittency and initial investment costs, while government incentives drive adoption. The market's future growth is tied to advancements in renewable energy technology, energy storage, and grid infrastructure.
Market Dynamics
Market Trends- Integrating solar and wind energy offers a number of benefits, including increased reliability, reduced costs, and environmental benefits
Integrating solar and wind energy in hybrid systems presents numerous advantages. Firstly, the combination enhances energy reliability, as it offsets the intermittent nature of each source, ensuring a more consistent power supply. Moreover, this synergy results in cost reductions over time, as energy production becomes more efficient and less reliant on traditional power sources, thereby leading to substantial savings. Notably, solar-wind hybrids also yield significant environmental benefits, as they generate clean, renewable energy, reducing carbon emissions and diminishing the overall environmental footprint.
Market Driver- The demand for energy storage integration in solar-wind hybrid systems is increasing, as it can help to improve the reliability and efficiency of these systems.
The demand for energy storage integration in solar-wind hybrid systems is increasing to enhance efficiency and reliability. Integrating advanced battery systems helps balance intermittent energy production, ensuring a consistent power supply, and boosting the appeal of these systems for various applications, including grid integration, off-grid setups, and microgrids, which is expected to drive further growth in the renewable energy market.
Market Opportunity- Technological advancements in solar-wind hybrid systems are making them more efficient, reliable, and cost-effective
Technological advancements are reshaping the solar-wind hybrid systems market, resulting in systems that are more efficient, reliable, and cost-effective. These improvements encompass a wide range of innovations, including the development of more efficient photovoltaic panels and wind turbines, advanced energy storage solutions, and cutting-edge control systems. These enhancements not only maximize the utilization of solar and wind resources but also significantly reduce system maintenance and operational costs. The integration of more intelligent control systems is improving the coordination between solar and wind components, optimizing energy production, and ensuring a smooth transition from one energy source to the other.
Market Share Analysis- On-grid system Solar Wind Hybrid Systems Market will register the fastest growth
The Global Solar Wind Hybrid Systems Market is analyzed across On-Grid Systems, Stand-Alone Systems, and others. On-Grid System is poised to register the fastest growth. On-grid solar-wind hybrid systems are integrated with the electrical grid, offering advantages such as grid stability, energy cost reduction, and environmental benefits through the generation of clean, renewable energy. These systems incorporate advanced energy management and control systems, enabling automatic switching between solar and wind sources for a steady power supply. Government incentives and scalability make on-grid systems appealing to various applications, from residential to industrial, in the pursuit of clean energy solutions.
Market Share Analysis- Commercial held a significant market share in 2023
The Global Solar Wind Hybrid Systems Market is analyzed across various End Users including Residential, Commercial, Industrial, and others. Of these, Commercial held a significant market share in 2023. Unlock the future of clean energy with Wind Hybrid Systems for your commercial needs. Our cutting-edge solutions harness wind power, delivering reliable energy production, cost savings, and a significant reduction in carbon emissions. Join the green energy revolution and secure a more sustainable future for your business. Contact us today to explore customized solutions that drive your company's success.
Solar Wind Hybrid Systems Market Segmentation
By Type
- On-Grid System
- Stand-Alone System
By End-User
- Residential
- Commercial
- Industrial
By Region
- North America (United States, Canada, Mexico)
- Europe (Germany, France, United Kingdom, Spain, Italy, Others)
- Asia Pacific (China, India, Japan, South Korea, Australia, Others)
- Latin America (Brazil, Argentina, Others)
- Middle East and Africa (Saudi Arabia, UAE, Kuwait, Other Middle East, South Africa, Nigeria, Other Africa)
Solar Wind Hybrid Systems Market Companies
- ReGen Powertech
- Alpha Windmills
- Blue Pacific Solar Product Inc
- UNITRON Energy System Pvt Ltd
- Supernova Technologies Pvt Ltd
- Gamesa
- Grupo Dragon
- Alternate Energy Company
- Polar Power Inc
*List not exhaustive
Solar Wind Hybrid Systems Market Outlook 2023
1 Market Overview
1.1 Introduction to the Solar Wind Hybrid Systems Market
1.2 Scope of the Study
1.3 Research Objective
1.3.1 Key Market Scope and Segments
1.3.2 Players Covered
1.3.3 Years Considered
2 Executive Summary
2.1 2023 Solar Wind Hybrid Systems Industry- Market Statistics
3 Market Dynamics
3.1 Market Drivers
3.2 Market Challenges
3.3 Market Opportunities
3.4 Market Trends
4 Market Factor Analysis
4.1 Porter’s Five Forces
4.2 Market Entropy
4.2.1 Global Solar Wind Hybrid Systems Market Companies with Area Served
4.2.2 Products Offerings Global Solar Wind Hybrid Systems Market
5 COVID-19 Impact Analysis and Outlook Scenarios
5.1.1 Covid-19 Impact Analysis
5.1.2 post-COVID-19 Scenario- Low Growth Case
5.1.3 post-COVID-19 Scenario- Reference Growth Case
5.1.4 post-COVID-19 Scenario- Low Growth Case
6 Global Solar Wind Hybrid Systems Market Trends
6.1 Global Solar Wind Hybrid Systems Revenue (USD Million) and CAGR (%) by Type (2018-2030)
6.2 Global Solar Wind Hybrid Systems Revenue (USD Million) and CAGR (%) by Applications (2018-2030)
6.3 Global Solar Wind Hybrid Systems Revenue (USD Million) and CAGR (%) by regions (2018-2030)
7 Global Solar Wind Hybrid Systems Market Revenue (USD Million) by Type, and Applications (2018-2022)
7.1 Global Solar Wind Hybrid Systems Revenue (USD Million) by Type (2018-2022)
7.1.1 Global Solar Wind Hybrid Systems Revenue (USD Million), Market Share (%) by Type (2018-2022)
7.2 Global Solar Wind Hybrid Systems Revenue (USD Million) by Applications (2018-2022)
7.2.1 Global Solar Wind Hybrid Systems Revenue (USD Million), Market Share (%) by Applications (2018-2022)
8 Global Solar Wind Hybrid Systems Development Regional Status and Outlook
8.1 Global Solar Wind Hybrid Systems Revenue (USD Million) By Regions (2018-2022)
8.2 North America Solar Wind Hybrid Systems Revenue (USD Million) by Type, and Application (2018-2022)
8.2.1 North America Solar Wind Hybrid Systems Revenue (USD Million) by Country (2018-2022)
8.2.2 North America Solar Wind Hybrid Systems Revenue (USD Million) by Type (2018-2022)
8.2.3 North America Solar Wind Hybrid Systems Revenue (USD Million) by Applications (2018-2022)
8.3 Europe Solar Wind Hybrid Systems Revenue (USD Million), by Type, and Applications (USD Million) (2018-2022)
8.3.1 Europe Solar Wind Hybrid Systems Revenue (USD Million), by Country (2018-2022)
8.3.2 Europe Solar Wind Hybrid Systems Revenue (USD Million) by Type (2018-2022)
8.3.3 Europe Solar Wind Hybrid Systems Revenue (USD Million) by Applications (2018-2022)
8.4 Asia Pacific Solar Wind Hybrid Systems Revenue (USD Million), and Revenue (USD Million) by Type, and Applications (2018-2022)
8.4.1 Asia Pacific Solar Wind Hybrid Systems Revenue (USD Million) by Country (2018-2022)
8.4.2 Asia Pacific Solar Wind Hybrid Systems Revenue (USD Million) by Type (2018-2022)
8.4.3 Asia Pacific Solar Wind Hybrid Systems Revenue (USD Million) by Applications (2018-2022)
8.5 South America Solar Wind Hybrid Systems Revenue (USD Million), by Type, and Applications (2018-2022)
8.5.1 South America Solar Wind Hybrid Systems Revenue (USD Million), by Country (2018-2022)
8.5.2 South America Solar Wind Hybrid Systems Revenue (USD Million) by Type (2018-2022)
8.5.3 South America Solar Wind Hybrid Systems Revenue (USD Million) by Applications (2018-2022)
8.6 Middle East and Africa Solar Wind Hybrid Systems Revenue (USD Million), by Type, Technology, Application, Thickness (2018-2022)
8.6.1 Middle East and Africa Solar Wind Hybrid Systems Revenue (USD Million) by Country (2018-2022)
8.6.2 Middle East and Africa Solar Wind Hybrid Systems Revenue (USD Million) by Type (2018-2022)
8.6.3 Middle East and Africa Solar Wind Hybrid Systems Revenue (USD Million) by Applications (2018-2022)
9 Company Profiles
10 Global Solar Wind Hybrid Systems Market Revenue (USD Million), by Type, and Applications (2023-2030)
10.1 Global Solar Wind Hybrid Systems Revenue (USD Million) and Market Share (%) by Type (2023-2030)
10.1.1 Global Solar Wind Hybrid Systems Revenue (USD Million), and Market Share (%) by Type (2023-2030)
10.2 Global Solar Wind Hybrid Systems Revenue (USD Million) and Market Share (%) by Applications (2023-2030)
10.2.1 Global Solar Wind Hybrid Systems Revenue (USD Million), and Market Share (%) by Applications (2023-2030)
11 Global Solar Wind Hybrid Systems Development Regional Status and Outlook Forecast
11.1 Global Solar Wind Hybrid Systems Revenue (USD Million) By Regions (2023-2030)
11.2 North America Solar Wind Hybrid Systems Revenue (USD Million) by Type, and Applications (2023-2030)
11.2.1 North America Solar Wind Hybrid Systems Revenue (USD) Million by Country (2023-2030)
11.2.2 North America Solar Wind Hybrid Systems Revenue (USD Million), by Type (2023-2030)
11.2.3 North America Solar Wind Hybrid Systems Revenue (USD Million), Market Share (%) by Applications (2023-2030)
11.3 Europe Solar Wind Hybrid Systems Revenue (USD Million), by Type, and Applications (2023-2030)
11.3.1 Europe Solar Wind Hybrid Systems Revenue (USD Million), by Country (2023-2030)
11.3.2 Europe Solar Wind Hybrid Systems Revenue (USD Million), by Type (2023-2030)
11.3.3 Europe Solar Wind Hybrid Systems Revenue (USD Million), by Applications (2023-2030)
11.4 Asia Pacific Solar Wind Hybrid Systems Revenue (USD Million) by Type, and Applications (2023-2030)
11.4.1 Asia Pacific Solar Wind Hybrid Systems Revenue (USD Million), by Country (2023-2030)
11.4.2 Asia Pacific Solar Wind Hybrid Systems Revenue (USD Million), by Type (2023-2030)
11.4.3 Asia Pacific Solar Wind Hybrid Systems Revenue (USD Million), by Applications (2023-2030)
11.5 South America Solar Wind Hybrid Systems Revenue (USD Million), by Type, and Applications (2023-2030)
11.5.1 South America Solar Wind Hybrid Systems Revenue (USD Million), by Country (2023-2030)
11.5.2 South America Solar Wind Hybrid Systems Revenue (USD Million), by Type (2023-2030)
11.5.3 South America Solar Wind Hybrid Systems Revenue (USD Million), by Applications (2023-2030)
11.6 Middle East and Africa Solar Wind Hybrid Systems Revenue (USD Million), by Type, and Applications (2023-2030)
11.6.1 Middle East and Africa Solar Wind Hybrid Systems Revenue (USD Million), by region (2023-2030)
11.6.2 Middle East and Africa Solar Wind Hybrid Systems Revenue (USD Million), by Type (2023-2030)
11.6.3 Middle East and Africa Solar Wind Hybrid Systems Revenue (USD Million), by Applications (2023-2030)
12 Methodology and Data Sources
12.1 Methodology/Research Approach
12.1.1 Research Programs/Design
12.1.2 Market Size Estimation
12.1.3 Market Breakdown and Data Triangulation
12.2 Data Sources
12.2.1 Secondary Sources
12.2.2 Primary Sources
12.3 Disclaimer
List of Tables
Table 1 Market Segmentation Analysis
Table 2 Global Solar Wind Hybrid Systems Market Companies with Areas Served
Table 3 Products Offerings Global Solar Wind Hybrid Systems Market
Table 4 Low Growth Scenario Forecasts
Table 5 Reference Case Growth Scenario
Table 6 High Growth Case Scenario
Table 7 Global Solar Wind Hybrid Systems Revenue (USD Million) And CAGR (%) By Type (2018-2030)
Table 8 Global Solar Wind Hybrid Systems Revenue (USD Million) And CAGR (%) By Applications (2018-2030)
Table 9 Global Solar Wind Hybrid Systems Revenue (USD Million) And CAGR (%) By Regions (2018-2030)
Table 10 Global Solar Wind Hybrid Systems Revenue (USD Million) By Type (2018-2022)
Table 11 Global Solar Wind Hybrid Systems Revenue Market Share (%) By Type (2018-2022)
Table 12 Global Solar Wind Hybrid Systems Revenue (USD Million) By Applications (2018-2022)
Table 13 Global Solar Wind Hybrid Systems Revenue Market Share (%) By Applications (2018-2022)
Table 14 Global Solar Wind Hybrid Systems Market Revenue (USD Million) By Regions (2018-2022)
Table 15 Global Solar Wind Hybrid Systems Market Share (%) By Regions (2018-2022)
Table 16 North America Solar Wind Hybrid Systems Revenue (USD Million) By Country (2018-2022)
Table 17 North America Solar Wind Hybrid Systems Revenue (USD Million) By Type (2018-2022)
Table 18 North America Solar Wind Hybrid Systems Revenue (USD Million) By Applications (2018-2022)
Table 19 Europe Solar Wind Hybrid Systems Revenue (USD Million) By Country (2018-2022)
Table 20 Europe Solar Wind Hybrid Systems Revenue (USD Million) By Type (2018-2022)
Table 21 Europe Solar Wind Hybrid Systems Revenue (USD Million) By Applications (2018-2022)
Table 22 Asia Pacific Solar Wind Hybrid Systems Revenue (USD Million) By Country (2018-2022)
Table 23 Asia Pacific Solar Wind Hybrid Systems Revenue (USD Million) By Type (2018-2022)
Table 24 Asia Pacific Solar Wind Hybrid Systems Revenue (USD Million) By Applications (2018-2022)
Table 25 South America Solar Wind Hybrid Systems Revenue (USD Million) By Country (2018-2022)
Table 26 South America Solar Wind Hybrid Systems Revenue (USD Million) By Type (2018-2022)
Table 27 South America Solar Wind Hybrid Systems Revenue (USD Million) By Applications (2018-2022)
Table 28 Middle East and Africa Solar Wind Hybrid Systems Revenue (USD Million) By Region (2018-2022)
Table 29 Middle East and Africa Solar Wind Hybrid Systems Revenue (USD Million) By Type (2018-2022)
Table 30 Middle East and Africa Solar Wind Hybrid Systems Revenue (USD Million) By Applications (2018-2022)
Table 31 Financial Analysis
Table 32 Global Solar Wind Hybrid Systems Revenue (USD Million) By Type (2023-2030)
Table 33 Global Solar Wind Hybrid Systems Revenue Market Share (%) By Type (2023-2030)
Table 34 Global Solar Wind Hybrid Systems Revenue (USD Million) By Applications (2023-2030)
Table 35 Global Solar Wind Hybrid Systems Revenue Market Share (%) By Applications (2023-2030)
Table 36 Global Solar Wind Hybrid Systems Market Revenue (USD Million), And Revenue (USD Million) By Regions (2023-2030)
Table 37 North America Solar Wind Hybrid Systems Revenue (USD)By Country (2023-2030)
Table 38 North America Solar Wind Hybrid Systems Revenue (USD Million) By Type (2023-2030)
Table 39 North America Solar Wind Hybrid Systems Revenue (USD Million) By Applications (2023-2030)
Table 40 Europe Solar Wind Hybrid Systems Revenue (USD Million) By Country (2023-2030)
Table 41 Europe Solar Wind Hybrid Systems Revenue (USD Million) By Type (2023-2030)
Table 42 Europe Solar Wind Hybrid Systems Revenue (USD Million) By Applications (2023-2030)
Table 43 Asia Pacific Solar Wind Hybrid Systems Revenue (USD Million) By Country (2023-2030)
Table 44 Asia Pacific Solar Wind Hybrid Systems Revenue (USD Million) By Type (2023-2030)
Table 45 Asia Pacific Solar Wind Hybrid Systems Revenue (USD Million) By Applications (2023-2030)
Table 46 South America Solar Wind Hybrid Systems Revenue (USD Million) By Country (2023-2030)
Table 47 South America Solar Wind Hybrid Systems Revenue (USD Million) By Type (2023-2030)
Table 48 South America Solar Wind Hybrid Systems Revenue (USD Million) By Applications (2023-2030)
Table 49 Middle East and Africa Solar Wind Hybrid Systems Revenue (USD Million) By Region (2023-2030)
Table 50 Middle East and Africa Solar Wind Hybrid Systems Revenue (USD Million) By Region (2023-2030)
Table 51 Middle East and Africa Solar Wind Hybrid Systems Revenue (USD Million) By Type (2023-2030)
Table 52 Middle East and Africa Solar Wind Hybrid Systems Revenue (USD Million) By Applications (2023-2030)
Table 53 Research Programs/Design for This Report
Table 54 Key Data Information from Secondary Sources
Table 55 Key Data Information from Primary Sources
List of Figures
Figure 1 Market Scope
Figure 2 Porter’s Five Forces
Figure 3 Global Solar Wind Hybrid Systems Revenue (USD Million) By Type (2018-2022)
Figure 4 Global Solar Wind Hybrid Systems Revenue Market Share (%) By Type (2022)
Figure 5 Global Solar Wind Hybrid Systems Revenue (USD Million) By Applications (2018-2022)
Figure 6 Global Solar Wind Hybrid Systems Revenue Market Share (%) By Applications (2022)
Figure 7 Global Solar Wind Hybrid Systems Market Revenue (USD Million) By Regions (2018-2022)
Figure 8 Global Solar Wind Hybrid Systems Market Share (%) By Regions (2022)
Figure 9 North America Solar Wind Hybrid Systems Revenue (USD Million) By Country (2018-2022)
Figure 10 North America Solar Wind Hybrid Systems Revenue (USD Million) By Type (2018-2022)
Figure 11 North America Solar Wind Hybrid Systems Revenue (USD Million) By Applications (2018-2022)
Figure 12 Europe Solar Wind Hybrid Systems Revenue (USD Million) By Country (2018-2022)
Figure 13 Europe Solar Wind Hybrid Systems Revenue (USD Million) By Type (2018-2022)
Figure 14 Europe Solar Wind Hybrid Systems Revenue (USD Million) By Applications (2018-2022)
Figure 15 Asia Pacific Solar Wind Hybrid Systems Revenue (USD Million) By Country (2018-2022)
Figure 16 Asia Pacific Solar Wind Hybrid Systems Revenue (USD Million) By Type (2018-2022)
Figure 17 Asia Pacific Solar Wind Hybrid Systems Revenue (USD Million) By Applications (2018-2022)
Figure 18 South America Solar Wind Hybrid Systems Revenue (USD Million) By Country (2018-2022)
Figure 19 South America Solar Wind Hybrid Systems Revenue (USD Million) By Type (2018-2022)
Figure 20 South America Solar Wind Hybrid Systems Revenue (USD Million) By Applications (2018-2022)
Figure 21 Middle East and Africa Solar Wind Hybrid Systems Revenue (USD Million) By Region (2018-2022)
Figure 22 Middle East and Africa Solar Wind Hybrid Systems Revenue (USD Million) By Type (2018-2022)
Figure 23 Middle East and Africa Solar Wind Hybrid Systems Revenue (USD Million) By Applications (2018-2022)
Figure 24 Global Solar Wind Hybrid Systems Revenue (USD Million) By Type (2023-2030)
Figure 25 Global Solar Wind Hybrid Systems Revenue Market Share (%) By Type (2030)
Figure 26 Global Solar Wind Hybrid Systems Revenue (USD Million) By Applications (2023-2030)
Figure 27 Global Solar Wind Hybrid Systems Revenue Market Share (%) By Applications (2030)
Figure 28 Global Solar Wind Hybrid Systems Market Revenue (USD Million) By Regions (2023-2030)
Figure 29 North America Solar Wind Hybrid Systems Revenue (USD Million) By Country (2023-2030)
Figure 30 North America Solar Wind Hybrid Systems Revenue (USD Million) By Type (2023-2030)
Figure 31 North America Solar Wind Hybrid Systems Revenue (USD Million) By Applications (2023-2030)
Figure 32 Europe Solar Wind Hybrid Systems Revenue (USD Million) By Country (2023-2030)
Figure 33 Europe Solar Wind Hybrid Systems Revenue (USD Million) By Type (2023-2030)
Figure 34 Europe Solar Wind Hybrid Systems Revenue (USD Million) By Applications (2023-2030)
Figure 35 Asia Pacific Solar Wind Hybrid Systems Revenue (USD Million) By Country (2023-2030)
Figure 36 Asia Pacific Solar Wind Hybrid Systems Revenue (USD Million) By Type (2023-2030)
Figure 37 Asia Pacific Solar Wind Hybrid Systems Revenue (USD Million) By Applications (2023-2030)
Figure 38 South America Solar Wind Hybrid Systems Revenue (USD Million) By Country (2023-2030)
Figure 39 South America Solar Wind Hybrid Systems Revenue (USD Million) By Type (2023-2030)
Figure 40 South America Solar Wind Hybrid Systems Revenue (USD Million) By Applications (2023-2030)
Figure 41 Middle East and Africa Solar Wind Hybrid Systems Revenue (USD Million) By Region (2023-2030)
Figure 42 Middle East and Africa Solar Wind Hybrid Systems Revenue (USD Million) By Region (2023-2030)
Figure 43 Middle East and Africa Solar Wind Hybrid Systems Revenue (USD Million) By Type (2023-2030)
Figure 44 Middle East and Africa Solar Wind Hybrid Systems Revenue (USD Million) By Applications (2023-2030)
Figure 45 Bottom-Up and Top-Down Approaches for This Report
Figure 46 Data Triangulation
