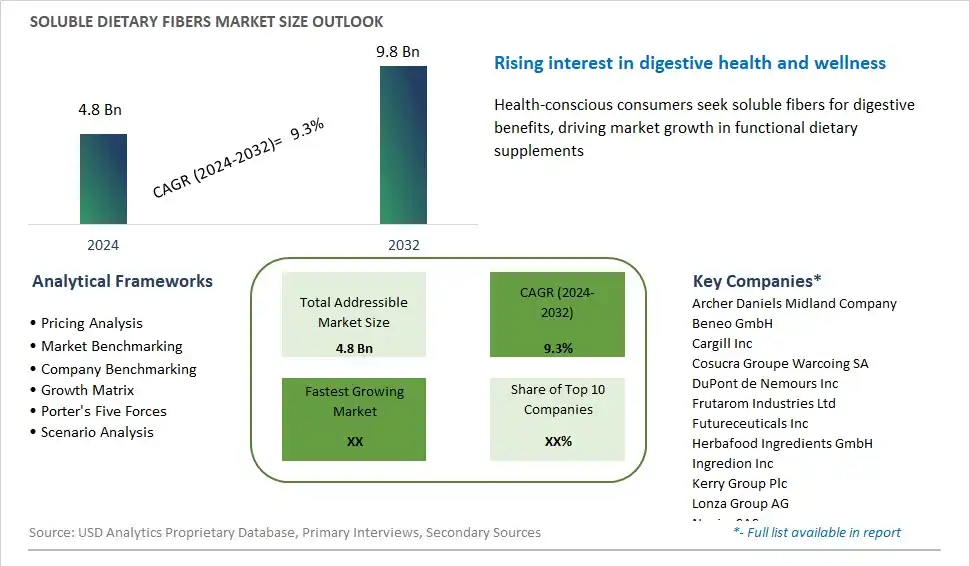
Global Soluble Dietary Fibers Market Size is valued at $4.8 Billion in 2024 and is forecast to register a growth rate (CAGR) of 9.3% to reach $9.8 Billion by 2032.
The global Soluble Dietary Fibers Market Comprehensive Study analyzes and forecasts the market size across 6 regions and 24 countries for diverse segments -By Source (Fruits and Vegetables, Grains and Cereals, Nuts and Seeds, Others), By Type (Inulin, Pectin, Others), By Application (Functional Foods & Beverages, Animal Feed, Pharmaceuticals, Others)
An Introduction to Soluble Dietary Fibers Market
Soluble dietary fibers are plant-based carbohydrates that dissolve or swell in water, forming viscous gels or solutions, used to promote digestive health and satiety in 2024. These fibers include substances such as inulin, pectin, beta-glucan, and resistant starch, which are found naturally in fruits, vegetables, grains, and legumes, as well as in processed foods and dietary supplements. Soluble dietary fibers play a crucial role in maintaining digestive regularity, lowering cholesterol levels, and regulating blood sugar levels by slowing the absorption of glucose and cholesterol in the digestive tract. With increasing consumer interest in gut health, weight management, and functional foods, the market for soluble dietary fibers is growing, driven by innovations in ingredient technology, formulation science, and health claims that highlight the benefits of fiber-rich diets for overall wellness and disease prevention.
Soluble Dietary Fibers Competitive Landscape
The market report analyses the leading companies in the industry including Archer Daniels Midland Company, Beneo GmbH, Cargill Inc, Cosucra Groupe Warcoing SA, DuPont de Nemours Inc, Frutarom Industries Ltd, Futureceuticals Inc, Herbafood Ingredients GmbH, Ingredion Inc, Kerry Group Plc, Lonza Group AG, Nexira SAS, Roquette Freres Le Romarin, Sensus B.V., Tate and Lyle Plc, Tereos S.A., and Others.
Soluble Dietary Fibers Market Dynamics
Soluble Dietary Fibers Market Trend: Growing Demand for Functional Foods and Health Supplements
A prominent market trend for soluble dietary fibers is the growing demand for functional foods and health supplements. As consumers become more health-conscious and seek products that promote digestive health, weight management, and overall well-being, the demand for soluble dietary fibers has been steadily increasing. Soluble fibers, such as inulin, oligosaccharides, and psyllium, are known for their ability to improve digestive function, regulate blood sugar levels, and promote satiety, making them popular ingredients in a wide range of food and beverage products, including cereal bars, yogurts, and dietary supplements. This trend is expected to continue as consumers prioritize preventative health measures and seek out products that offer functional benefits beyond basic nutrition.
Market Driver: Rising Incidence of Chronic Diseases and Obesity
A key market driver for soluble dietary fibers is the rising incidence of chronic diseases and obesity worldwide. As lifestyles become increasingly sedentary and diets more reliant on processed and high-calorie foods, there has been a surge in health issues such as diabetes, cardiovascular diseases, and obesity. Soluble dietary fibers play a crucial role in managing these health conditions by improving glycemic control, reducing cholesterol levels, and aiding in weight management. As a result, healthcare professionals, nutritionists, and consumers are increasingly recognizing the importance of incorporating soluble fibers into daily diets to promote better health outcomes. This heightened awareness of the health benefits of soluble dietary fibers is driving the demand for products fortified with these ingredients, creating opportunities for manufacturers to develop innovative functional foods and supplements tailored to address specific health concerns.
Market Opportunity: Expansion into Functional Food and Beverage Applications
An opportunity within the soluble dietary fibers market lies in the expansion into functional food and beverage applications. While soluble fibers are commonly used as bulking agents and thickeners in food manufacturing, there is untapped potential to incorporate them into a wider range of functional products targeting various health benefits. Manufacturers can capitalize on this opportunity by developing innovative formulations that combine soluble fibers with other bioactive ingredients to create functional foods and beverages tailored to address specific health concerns, such as gut health, immune support, and weight management. By leveraging the functional properties of soluble dietary fibers and tapping into the growing demand for health-enhancing products, companies can differentiate themselves in the market and capture a larger share of the rapidly expanding functional food and beverage segment.
Soluble Dietary Fibers Market Share Analysis: Soluble Dietary Fibers Market from Grains and Cereals held the dominant market share in 2024
Within the Soluble Dietary Fibers Market, the segment sourced from grains and cereals stands out as the largest. This predominance is primarily due to the widespread availability and consumption of grains and cereals globally. These food sources, such as oats, barley, and wheat, are rich in soluble fibers, which offer various health benefits, including improved digestion, blood sugar regulation, and cholesterol management. Further, grains and cereals are integral components of staple diets across cultures and regions, further contributing to their significant market share. As consumer awareness regarding the importance of dietary fiber for overall health continues to grow, the demand for soluble fibers from grains and cereals is expected to remain robust, driving the segment's dominance in the market. Additionally, the versatility of grains and cereals in various food applications, including bakery, breakfast cereals, and snacks, enhances their attractiveness as sources of soluble dietary fibers, solidifying their position as the largest segment in the market.
Soluble Dietary Fibers Market Share Analysis: Soluble Dietary Fibers Market from Inulin market is poised to register the fastest growth rae over the forecast period to 2032
The Soluble Dietary Fibers Market, particularly the segment comprising inulin, is the fastest-growing segment. This acceleration can be attributed to several factors. Inulin, a type of soluble fiber derived from chicory roots, exhibits exceptional functional properties and health benefits, making it increasingly sought after in the food and beverage industry. Its ability to improve digestive health, promote satiety, and support weight management has fueled its demand among health-conscious consumers. Furthermore, inulin's natural origin and prebiotic properties align with growing consumer preferences for clean-label, natural ingredients. The versatility of inulin in various food and beverage applications, including dairy, bakery, and functional beverages, further contributes to its rapid growth. Additionally, the rising incidence of lifestyle-related diseases, coupled with increasing awareness about the importance of dietary fiber in preventing such ailments, propels the demand for inulin as a functional ingredient. With ongoing research and development efforts focusing on enhancing the functionality and applicability of inulin in food formulations, this segment is poised for sustained growth in the foreseeable future.
Soluble Dietary Fibers Market Share Analysis: Soluble Dietary Fibers Market in Functional Foods & Beverages held the dominant market share in 2024
Within the Soluble Dietary Fibers Market, the segment dedicated to functional foods and beverages is the largest. This predominance is primarily due to the growing consumer awareness and preference for products that offer additional health benefits beyond basic nutrition. Functional foods and beverages fortified with soluble dietary fibers cater to a diverse range of health-conscious consumers seeking solutions for digestive health, weight management, and overall well-being. Further, the versatility of soluble fibers allows their incorporation into a wide array of food and beverage applications, including yogurt, cereal bars, juices, and smoothies, enhancing their appeal among manufacturers and consumers alike. Additionally, regulatory support and labeling regulations promoting the health benefits of soluble dietary fibers in functional foods and beverages further drive the segment's growth. As the trend towards functional foods and beverages continues to rise globally, fueled by increasing health awareness and lifestyle changes, the demand for soluble dietary fibers in this segment is expected to remain robust, solidifying its position as the largest segment in the market.
Soluble Dietary Fibers Market Segmentation
By Source
Fruits and Vegetables
Grains and Cereals
Nuts and Seeds
Others
By Type
Inulin
Pectin
Others
By Application
Functional Foods & Beverages
Animal Feed
Pharmaceuticals
Others
Countries Analyzed
North America (US, Canada, Mexico)
Europe (Germany, UK, France, Spain, Italy, Russia, Rest of Europe)
Asia Pacific (China, India, Japan, South Korea, Australia, South East Asia, Rest of Asia)
South America (Brazil, Argentina, Rest of South America)
Middle East and Africa (Saudi Arabia, UAE, Rest of Middle East, South Africa, Egypt, Rest of Africa)
Soluble Dietary Fibers Companies Profiled in the Study
Archer Daniels Midland Company
Beneo GmbH
Cargill Inc
Cosucra Groupe Warcoing SA
DuPont de Nemours Inc
Frutarom Industries Ltd
Futureceuticals Inc
Herbafood Ingredients GmbH
Ingredion Inc
Kerry Group Plc
Lonza Group AG
Nexira SAS
Roquette Freres Le Romarin
Sensus B.V.
Tate and Lyle Plc
Tereos S.A.
*- List Not Exhaustive
Chapter 1. TABLE OF CONTENTS
Chapter 2. Introduction to Soluble Dietary Fibers Market
2.1. Market Overview
2.2. Key Statistics and Report Highlights
2.3. Scope of the Comprehensive Study
2.3.1. Market Definition
2.3.2 Countries and Regions Covered
2.3.3 Research Objective
2.3.4 Units, Currency, and Conversions
2.3.5 Industry Value Chain
2.4. Key Market Segments
2.5. Key Companies
2.6. Study Period
Chapter 3. Strategic Analysis Review
3.1. Soluble Dietary Fibers Pricing Analysis and Forecast
3.2. Porter’s Five Forces
3.3. Market Ecosystem
3.4. SWOT Analysis
3.5. Regulatory Scenario
3.3. Effects of Inflation, Russia-Ukraine War, moderating economic growth, and other macroeconomic factors
Chapter 4. Competitive Landscape
4.1. Market Share Analysis
4.1.1. Global Soluble Dietary Fibers Market Share by Company, 2023
4.1.2. Product Offerings of Leading Soluble Dietary Fibers Companies
4.2. Market Entropy
4.2.1. New Product Launches in the Industry
4.2.2. Mergers, Acquisitions, Joint ventures, and Partnerships
4.3. Key Strategies and Best Practices
Chapter 5. Global Market Projections: Best, Reference, and Low Case Scenarios
5.1. Growth Analysis- Case Scenario Definitions
5.2. Low Growth Case Scenario Forecasts
5.3. Reference Growth Case Scenario Forecasts
5.4. High Growth Case Scenario Forecasts
Chapter 6. Market Dynamics
6.1. Soluble Dietary Fibers Market Drivers
6.2. Soluble Dietary Fibers Market Challenges
6.6. Soluble Dietary Fibers Market Opportunities
6.4. Soluble Dietary Fibers Market Trends
Chapter 7. Global Soluble Dietary Fibers Market Outlook Trends
7.1. Global Soluble Dietary Fibers Revenue (USD Million) and CAGR (%) by Type (2021-2032)
7.2. Global Soluble Dietary Fibers Revenue (USD Million) and CAGR (%) by Application (2021-2032)
7.3. Global Soluble Dietary Fibers Revenue (USD Million) and CAGR (%) by Product (2021-2032)
By Source
Fruits and Vegetables
Grains and Cereals
Nuts and Seeds
Others
By Type
Inulin
Pectin
Others
By Application
Functional Foods & Beverages
Animal Feed
Pharmaceuticals
Others
Chapter 8. Global Soluble Dietary Fibers Regional Analysis and Outlook
8.1. Global Soluble Dietary Fibers Revenue (USD Million) By Regions (2021- 2032)
8.2. North America Soluble Dietary Fibers Revenue (USD Million) by Country (2021-2032)
8.2.1. United States Soluble Dietary Fibers Regional Analysis and Outlook
8.2.2. Canada Soluble Dietary Fibers Regional Analysis and Outlook
8.2.3. Mexico Soluble Dietary Fibers Regional Analysis and Outlook
8.3. Europe Soluble Dietary Fibers Revenue (USD Million), by Country (2021-2032)
8.3.1. Germany Soluble Dietary Fibers Regional Analysis and Outlook
8.3.2. France Soluble Dietary Fibers Regional Analysis and Outlook
8.3.3. United Kingdom Soluble Dietary Fibers Regional Analysis and Outlook
8.3.4. Spain Soluble Dietary Fibers Regional Analysis and Outlook
8.3.5. Italy Soluble Dietary Fibers Regional Analysis and Outlook
8.3.6. Russia Soluble Dietary Fibers Regional Analysis and Outlook
8.3.7. Rest of Europe Soluble Dietary Fibers Regional Analysis and Outlook
8.4. Asia Pacific Soluble Dietary Fibers Revenue (USD Million) by Country (2021-2032)
8.4.1. China Soluble Dietary Fibers Regional Analysis and Outlook
8.4.2. Japan Soluble Dietary Fibers Regional Analysis and Outlook
8.4.3. India Soluble Dietary Fibers Regional Analysis and Outlook
8.4.4. South Korea Soluble Dietary Fibers Regional Analysis and Outlook
8.4.5. Australia Soluble Dietary Fibers Regional Analysis and Outlook
8.4.6. South East Asia Soluble Dietary Fibers Regional Analysis and Outlook
8.4.7. Rest of Asia Pacific Soluble Dietary Fibers Regional Analysis and Outlook
8.5. South America Soluble Dietary Fibers Revenue (USD Million), by Country (2021-2032)
8.5.1. Brazil Soluble Dietary Fibers Regional Analysis and Outlook
8.5.2. Argentina Soluble Dietary Fibers Regional Analysis and Outlook
8.5.3. Rest of South America Soluble Dietary Fibers Regional Analysis and Outlook
8.6. Middle East and Africa Soluble Dietary Fibers Revenue (USD Million) by Country (2021-2032)
8.6.1. Middle East Soluble Dietary Fibers Regional Analysis and Outlook
8.6.2. Africa Soluble Dietary Fibers Regional Analysis and Outlook
Chapter 9. North America Soluble Dietary Fibers Analysis and Outlook
9.1. North America Soluble Dietary Fibers Revenue (USD Million) by Segments (2021-2032)
9.1.1. North America Soluble Dietary Fibers Revenue (USD Million) by Type (2021-2032)
9.1.2. North America Soluble Dietary Fibers Revenue (USD Million) by Application (2021-2032)
9.1.3. North America Soluble Dietary Fibers Revenue (USD Million) by Product (2021-2032)
By Source
Fruits and Vegetables
Grains and Cereals
Nuts and Seeds
Others
By Type
Inulin
Pectin
Others
By Application
Functional Foods & Beverages
Animal Feed
Pharmaceuticals
Others
Chapter 10. Europe Soluble Dietary Fibers Analysis and Outlook
10.1. Europe Soluble Dietary Fibers Revenue (USD Million), by Segments (USD Million) (2021-2032)
10.1.1. Europe Soluble Dietary Fibers Revenue (USD Million) by Type (2021-2032)
10.1.2. Europe Soluble Dietary Fibers Revenue (USD Million) by Application (2021-2032)
10.1.3. Europe Soluble Dietary Fibers Revenue (USD Million) by Product (2021-2032)
By Source
Fruits and Vegetables
Grains and Cereals
Nuts and Seeds
Others
By Type
Inulin
Pectin
Others
By Application
Functional Foods & Beverages
Animal Feed
Pharmaceuticals
Others
Chapter 11. Asia Pacific Soluble Dietary Fibers Analysis and Outlook
11.1. Asia Pacific Soluble Dietary Fibers Revenue (USD Million), and Revenue (USD Million) by Segments (2021-2032)
11.1.1. Asia Pacific Soluble Dietary Fibers Revenue (USD Million) by Type (2021-2032)
11.1.2. Asia Pacific Soluble Dietary Fibers Revenue (USD Million) by Application (2021-2032)
11.1.3. Asia Pacific Soluble Dietary Fibers Revenue (USD Million) by Product (2021-2032)
By Source
Fruits and Vegetables
Grains and Cereals
Nuts and Seeds
Others
By Type
Inulin
Pectin
Others
By Application
Functional Foods & Beverages
Animal Feed
Pharmaceuticals
Others
Chapter 12. South America Soluble Dietary Fibers Analysis and Outlook
12.1. South America Soluble Dietary Fibers Revenue (USD Million), by Segments (2021-2032)
12.1.1. South America Soluble Dietary Fibers Revenue (USD Million) by Type (2021-2032)
12.1.2. South America Soluble Dietary Fibers Revenue (USD Million) by Application (2021-2032)
12.1.3. South America Soluble Dietary Fibers Revenue (USD Million) by Product (2021-2032)
By Source
Fruits and Vegetables
Grains and Cereals
Nuts and Seeds
Others
By Type
Inulin
Pectin
Others
By Application
Functional Foods & Beverages
Animal Feed
Pharmaceuticals
Others
Chapter 13. Middle East and Africa Soluble Dietary Fibers Analysis and Outlook
13.1. Middle East and Africa Soluble Dietary Fibers Revenue (USD Million), by Segments (2021-2032)
13.1.1. Middle East and Africa Soluble Dietary Fibers Revenue (USD Million) by Type (2021-2032)
13.1.2. Middle East and Africa Soluble Dietary Fibers Revenue (USD Million) by Application (2021-2032)
13.1.3. Middle East and Africa Soluble Dietary Fibers Revenue (USD Million) by Product (2021-2032)
By Source
Fruits and Vegetables
Grains and Cereals
Nuts and Seeds
Others
By Type
Inulin
Pectin
Others
By Application
Functional Foods & Beverages
Animal Feed
Pharmaceuticals
Others
Chapter 14. Soluble Dietary Fibers Company Profiles
14.1 Business Overview
14.2 Product Profiles
14.3 SWOT Profiles
14.5 Recent Developments
14.6 Financial Profile
List of Companies
Archer Daniels Midland Company
Beneo GmbH
Cargill Inc
Cosucra Groupe Warcoing SA
DuPont de Nemours Inc
Frutarom Industries Ltd
Futureceuticals Inc
Herbafood Ingredients GmbH
Ingredion Inc
Kerry Group Plc
Lonza Group AG
Nexira SAS
Roquette Freres Le Romarin
Sensus B.V.
Tate and Lyle Plc
Tereos S.A.
15. Methodology and Data Sources
15.1 Customization Offerings
15.2 Subscription Services
15.3 Related Reports
15.4 Publisher Expertise
LIST OF TABLES
Table 1 Market Segmentation Analysis
Table 2 Global Soluble Dietary Fibers Market Share of Leading Companies, 2023
Table 3 Product Offerings of Leading Companies
Table 4 Low Growth Scenario Forecasts
Table 5 Reference Case Growth Scenario
Table 6 High Growth Case Scenario
Table 7 Global Soluble Dietary Fibers Revenue (USD Million) And CAGR (%) By Type (2021-2032)
Table 8 Global Soluble Dietary Fibers Revenue (USD Million) And CAGR (%) By Application (2021-2032)
Table 9 Global Soluble Dietary Fibers Revenue (USD Million) And CAGR (%) By Product (2021-2032)
Table 10 Global Soluble Dietary Fibers Market Revenue (USD Million) By Regions (2021-2032)
Table 11 Global Soluble Dietary Fibers Market Share (%) By Regions (2021-2032)
Table 12 North America Soluble Dietary Fibers Revenue (USD Million) By Country (2021-2032)
Table 13 Europe Soluble Dietary Fibers Revenue (USD Million) By Country (2021-2032)
Table 14 Asia Pacific Soluble Dietary Fibers Revenue (USD Million) By Country (2021-2032)
Table 15 South America Soluble Dietary Fibers Revenue (USD Million) By Country (2021-2032)
Table 16 Middle East and Africa Soluble Dietary Fibers Revenue (USD Million) By Region (2021-2032)
Table 17 North America Soluble Dietary Fibers Revenue (USD Million) By Type (2021-2032)
Table 18 North America Soluble Dietary Fibers Revenue (USD Million) By Application (2021-2032)
Table 19 North America Soluble Dietary Fibers Revenue (USD Million) By Product (2021-2032)
Table 20 Europe Soluble Dietary Fibers Revenue (USD Million) By Type (2021-2032)
Table 21 Europe Soluble Dietary Fibers Revenue (USD Million) By Application (2021-2032)
Table 22 Europe Soluble Dietary Fibers Revenue (USD Million) By Product (2021-2032)
Table 23 Asia Pacific Soluble Dietary Fibers Revenue (USD Million) By Type (2021-2032)
Table 24 Asia Pacific Soluble Dietary Fibers Revenue (USD Million) By Application (2021-2032)
Table 25 Asia Pacific Soluble Dietary Fibers Revenue (USD Million) By Product (2021-2032)
Table 26 South America Soluble Dietary Fibers Revenue (USD Million) By Type (2021-2032)
Table 27 South America Soluble Dietary Fibers Revenue (USD Million) By Application (2021-2032)
Table 28 South America Soluble Dietary Fibers Revenue (USD Million) By Product (2021-2032)
Table 29 Middle East and Africa Soluble Dietary Fibers Revenue (USD Million) By Type (2021-2032)
Table 30 Middle East and Africa Soluble Dietary Fibers Revenue (USD Million) By Application (2021-2032)
Table 31 Middle East and Africa Soluble Dietary Fibers Revenue (USD Million) By Product (2021-2032)
LIST OF FIGURES
Figure 1. Market Scope
Figure 2. Pricing Forecasts Per Unit, 2023- 2032
Figure 3. Porter’s Five Forces
Figure 4. Global Soluble Dietary Fibers Market Revenue (USD Million) By Regions (2021-2032)
Figure 5. Global Soluble Dietary Fibers Market Share (%) By Regions (2023)
Figure 6. North America Soluble Dietary Fibers Revenue (USD Million) By Country (2021-2032)
Figure 7. United States Soluble Dietary Fibers Revenue (USD Million) By Country (2021-2032)
Figure 8. Canada Soluble Dietary Fibers Revenue (USD Million) By Country (2021-2032)
Figure 9. Mexico Soluble Dietary Fibers Revenue (USD Million) By Country (2021-2032)
Figure 10. Europe Soluble Dietary Fibers Revenue (USD Million) By Country (2021-2032)
Figure 11. Germany Soluble Dietary Fibers Revenue (USD Million) By Country (2021-2032)
Figure 12. France Soluble Dietary Fibers Revenue (USD Million) By Country (2021-2032)
Figure 13. United Kingdom Soluble Dietary Fibers Revenue (USD Million) By Country (2021-2032)
Figure 14. Spain Soluble Dietary Fibers Revenue (USD Million) By Country (2021-2032)
Figure 15. Italy Soluble Dietary Fibers Revenue (USD Million) By Country (2021-2032)
Figure 16. Russia Soluble Dietary Fibers Revenue (USD Million) By Country (2021-2032)
Figure 17. Rest of Europe Soluble Dietary Fibers Revenue (USD Million) By Country (2021-2032)
Figure 11. Asia Pacific Soluble Dietary Fibers Revenue (USD Million) By Country (2021-2032)
Figure 12. China Soluble Dietary Fibers Revenue (USD Million) By Country (2021-2032)
Figure 13. Japan Soluble Dietary Fibers Revenue (USD Million) By Country (2021-2032)
Figure 14. India Soluble Dietary Fibers Revenue (USD Million) By Country (2021-2032)
Figure 15. South Korea Soluble Dietary Fibers Revenue (USD Million) By Country (2021-2032)
Figure 16. Australia Soluble Dietary Fibers Revenue (USD Million) By Country (2021-2032)
Figure 17. South East Asia Soluble Dietary Fibers Revenue (USD Million) By Country (2021-2032)
Figure 18. South America Soluble Dietary Fibers Revenue (USD Million) By Country (2021-2032)
Figure 19. Brazil Soluble Dietary Fibers Revenue (USD Million) By Country (2021-2032)
Figure 20. Argentina Soluble Dietary Fibers Revenue (USD Million) By Country (2021-2032)
Figure 21. Rest of Asia Pacific Soluble Dietary Fibers Revenue (USD Million) By Country (2021-2032)
Figure 22. Middle East and Africa Soluble Dietary Fibers Revenue (USD Million) By Region (2021-2032)
Figure 23. Saudi Arabia Soluble Dietary Fibers Revenue (USD Million) By Region (2021-2032)
Figure 24. The UAE Soluble Dietary Fibers Revenue (USD Million) By Region (2021-2032)
Figure 25. Rest of Middle East Soluble Dietary Fibers Revenue (USD Million) By Region (2021-2032)
Figure 26. South Africa Soluble Dietary Fibers Revenue (USD Million) By Region (2021-2032)
Figure 27. Africa Soluble Dietary Fibers Revenue (USD Million) By Region (2021-2032)
Figure 28. North America Soluble Dietary Fibers Revenue (USD Million) By Type (2021-2032)
Figure 29. North America Soluble Dietary Fibers Revenue (USD Million) By Application (2021-2032)
Figure 30. North America Soluble Dietary Fibers Revenue (USD Million) By Product (2021-2032)
Figure 31. Europe Soluble Dietary Fibers Revenue (USD Million) By Type (2021-2032)
Figure 32. Europe Soluble Dietary Fibers Revenue (USD Million) By Application (2021-2032)
Figure 33. Europe Soluble Dietary Fibers Revenue (USD Million) By Product (2021-2032)
Figure 34. Asia Pacific Soluble Dietary Fibers Revenue (USD Million) By Type (2021-2032)
Figure 35. Asia Pacific Soluble Dietary Fibers Revenue (USD Million) By Application (2021-2032)
Figure 36. Asia Pacific Soluble Dietary Fibers Revenue (USD Million) By Product (2021-2032)
Figure 37. South America Soluble Dietary Fibers Revenue (USD Million) By Type (2021-2032)
Figure 38. South America Soluble Dietary Fibers Revenue (USD Million) By Application (2021-2032)
Figure 39. South America Soluble Dietary Fibers Revenue (USD Million) By Product (2021-2032)
Figure 40. Middle East and Africa Soluble Dietary Fibers Revenue (USD Million) By Type (2021-2032)
Figure 41. Middle East and Africa Soluble Dietary Fibers Revenue (USD Million) By Application (2021-2032)
Figure 42. Middle East and Africa Soluble Dietary Fibers Revenue (USD Million) By Product (2021-2032)
By Source
Fruits and Vegetables
Grains and Cereals
Nuts and Seeds
Others
By Type
Inulin
Pectin
Others
By Application
Functional Foods & Beverages
Animal Feed
Pharmaceuticals
Others
Countries Analyzed
North America (US, Canada, Mexico)
Europe (Germany, UK, France, Spain, Italy, Russia, Rest of Europe)
Asia Pacific (China, India, Japan, South Korea, Australia, South East Asia, Rest of Asia)
South America (Brazil, Argentina, Rest of South America)
Middle East and Africa (Saudi Arabia, UAE, Rest of Middle East, South Africa, Egypt, Rest of Africa)
