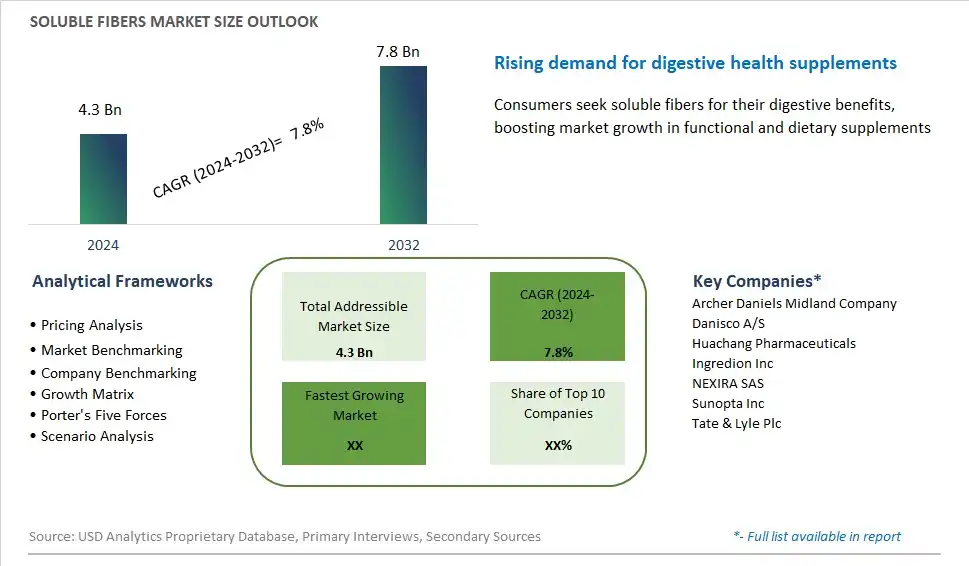
Global Soluble Fibers Market Size is valued at $4.3 Billion in 2024 and is forecast to register a growth rate (CAGR) of 7.8% to reach $7.8 Billion by 2032.
The global Soluble Fibers Market Comprehensive Study analyzes and forecasts the market size across 6 regions and 24 countries for diverse segments -By Type (Insulin, Polydextrose, Pectin, Beta-Glucan, Others), By Source (Oats, Barley, Chia Seeds, Legumes, Others), By Application (Functional Food, Feed, Pharmaceutical)
An Introduction to Soluble Fibers Market
The soluble fibers market is experiencing steady growth in 2024, driven by increasing awareness of their health benefits and their diverse applications in food and beverage formulations. Soluble fibers, such as inulin, pectin, and beta-glucan, are valued for their ability to promote digestive health, manage blood sugar levels, and support weight management. With a growing emphasis on functional ingredients and clean labels, manufacturers are incorporating soluble fibers into a wide range of products, including baked goods, beverages, and supplements. As consumers seek products that support their overall well-being, the soluble fibers market is poised for continued expansion as an essential component of a healthy diet.
Soluble Fibers Competitive Landscape
The market report analyses the leading companies in the industry including Archer Daniels Midland Company, Danisco A/S, Huachang Pharmaceuticals, Ingredion Inc, NEXIRA SAS, Sunopta Inc, Tate & Lyle Plc, and Others.
Soluble Fibers Market Dynamics
Soluble Fibers Market Trend: Growing Awareness of Health Benefits
One prominent trend in the soluble fibers market is the growing awareness of their health benefits. Soluble fibers, such as inulin, psyllium husk, and beta-glucan, are gaining popularity due to their various health-promoting properties, including improved digestion, cholesterol reduction, blood sugar regulation, and weight management. Consumers are becoming increasingly conscious of the importance of fiber in their diets for maintaining overall health and well-being. This trend is driving the demand for products fortified with soluble fibers across various food and beverage categories, including functional foods, dietary supplements, and fortified beverages.
Market Driver: Increasing Prevalence of Chronic Health Conditions
The main driver behind the soluble fibers market's growth is the increasing prevalence of chronic health conditions, such as obesity, diabetes, cardiovascular diseases, and digestive disorders. Soluble fibers play a crucial role in managing and preventing these conditions by promoting satiety, regulating blood sugar and cholesterol levels, supporting gut health, and aiding in weight management. As the incidence of these health issues continues to rise globally, there is a growing demand for dietary solutions that can help individuals improve their health outcomes. This driver is fueling the demand for soluble fiber-enriched products as consumers seek convenient and effective ways to support their health.
Market Opportunity: Expansion into Functional Food and Beverage Applications
One potential opportunity within the soluble fibers market lies in the expansion into functional food and beverage applications. As consumers increasingly prioritize health and wellness, there is a growing demand for functional foods and beverages that offer added nutritional benefits beyond basic sustenance. Soluble fibers present an opportunity for food and beverage manufacturers to develop innovative products that appeal to health-conscious consumers. Opportunities include incorporating soluble fibers into a wide range of products such as breakfast cereals, bread, snacks, dairy products, beverages, and meal replacement bars. By leveraging the health benefits of soluble fibers and addressing consumer preferences for convenient and tasty functional foods, manufacturers can capitalize on this opportunity to expand their product portfolios, attract new consumers, and differentiate themselves in the market.
Soluble Fibers Market Share Analysis: Inulin held the dominant market share in 2024
Inulin is the largest segment in the soluble fibers market. This dominance is attributed to its wide range of health benefits and versatile applications in the food and beverage industry. Inulin, a type of prebiotic fiber, is known for its ability to improve digestive health by promoting the growth of beneficial gut bacteria. It also helps in regulating blood sugar levels and enhancing calcium absorption, making it popular among health-conscious consumers. Additionally, inulin's functional properties, such as its ability to act as a fat replacer and its mild, slightly sweet taste, make it a preferred ingredient in various food products, including dairy, bakery, and beverages. The rising trend of incorporating functional ingredients into everyday foods to boost nutritional value further drives the demand for inulin. As a result, inulin remains the largest and most influential segment in the soluble fibers market, reflecting its significant role in promoting health and wellness.
Soluble Fibers Market Share Analysis: Chia Seeds market is poised to register the fastest growth rae over the forecast period to 2032
Chia seeds are the fastest-growing segment in the soluble fibers market. This rapid growth is driven by their exceptional nutritional profile and increasing consumer awareness of their health benefits. Chia seeds are rich in omega-3 fatty acids, antioxidants, and essential minerals, making them highly attractive to health-conscious individuals. They are particularly valued for their high fiber content, which aids in digestion, helps maintain healthy blood sugar levels, and promotes satiety, which can assist in weight management. The versatility of chia seeds also contributes to their popularity; they can be easily incorporated into a variety of foods, such as smoothies, yogurt, baked goods, and salads. Further, the rise of plant-based and gluten-free diets has further boosted the demand for chia seeds as a nutrient-dense and versatile ingredient. As consumers increasingly seek out superfoods and functional ingredients, chia seeds continue to experience significant growth in the soluble fibers market.
Soluble Fibers Market Share Analysis: Functional Food held the dominant market share in 2024
Functional food is the largest segment in the soluble fibers market. This predominance is due to the increasing consumer focus on health and wellness, driving the demand for foods that offer additional health benefits beyond basic nutrition. Soluble fibers, such as inulin and beta-glucan, are widely incorporated into functional foods because of their proven benefits in improving digestive health, regulating blood sugar levels, and supporting weight management. The trend towards preventive healthcare and the rising prevalence of lifestyle-related diseases have further fueled this demand. Further, the food industry's continuous innovation in developing tasty and convenient functional food products, such as fiber-enriched beverages, snacks, and dairy products, has significantly boosted market growth. Consumers are becoming more educated about the importance of dietary fiber and are actively seeking out products that enhance their overall well-being. As a result, the functional food segment continues to lead the soluble fibers market, reflecting the broader trend towards healthier eating habits and functional nutrition.
Soluble Fibers Market Segmentation
By Type
Insulin
Polydextrose
Pectin
Beta-Glucan
Others
By Source
Oats
Barley
Chia Seeds
Legumes
Others
By Application
Functional Food
Feed
Pharmaceutical
Countries Analyzed
North America (US, Canada, Mexico)
Europe (Germany, UK, France, Spain, Italy, Russia, Rest of Europe)
Asia Pacific (China, India, Japan, South Korea, Australia, South East Asia, Rest of Asia)
South America (Brazil, Argentina, Rest of South America)
Middle East and Africa (Saudi Arabia, UAE, Rest of Middle East, South Africa, Egypt, Rest of Africa)
Soluble Fibers Companies Profiled in the Study
Archer Daniels Midland Company
Danisco A/S
Huachang Pharmaceuticals
Ingredion Inc
NEXIRA SAS
Sunopta Inc
Tate & Lyle Plc
*- List Not Exhaustive
Chapter 1. TABLE OF CONTENTS
Chapter 2. Introduction to Soluble Fibers Market
2.1. Market Overview
2.2. Key Statistics and Report Highlights
2.3. Scope of the Comprehensive Study
2.3.1. Market Definition
2.3.2 Countries and Regions Covered
2.3.3 Research Objective
2.3.4 Units, Currency, and Conversions
2.3.5 Industry Value Chain
2.4. Key Market Segments
2.5. Key Companies
2.6. Study Period
Chapter 3. Strategic Analysis Review
3.1. Soluble Fibers Pricing Analysis and Forecast
3.2. Porter’s Five Forces
3.3. Market Ecosystem
3.4. SWOT Analysis
3.5. Regulatory Scenario
3.3. Effects of Inflation, Russia-Ukraine War, moderating economic growth, and other macroeconomic factors
Chapter 4. Competitive Landscape
4.1. Market Share Analysis
4.1.1. Global Soluble Fibers Market Share by Company, 2023
4.1.2. Product Offerings of Leading Soluble Fibers Companies
4.2. Market Entropy
4.2.1. New Product Launches in the Industry
4.2.2. Mergers, Acquisitions, Joint ventures, and Partnerships
4.3. Key Strategies and Best Practices
Chapter 5. Global Market Projections: Best, Reference, and Low Case Scenarios
5.1. Growth Analysis- Case Scenario Definitions
5.2. Low Growth Case Scenario Forecasts
5.3. Reference Growth Case Scenario Forecasts
5.4. High Growth Case Scenario Forecasts
Chapter 6. Market Dynamics
6.1. Soluble Fibers Market Drivers
6.2. Soluble Fibers Market Challenges
6.6. Soluble Fibers Market Opportunities
6.4. Soluble Fibers Market Trends
Chapter 7. Global Soluble Fibers Market Outlook Trends
7.1. Global Soluble Fibers Revenue (USD Million) and CAGR (%) by Type (2021-2032)
7.2. Global Soluble Fibers Revenue (USD Million) and CAGR (%) by Application (2021-2032)
7.3. Global Soluble Fibers Revenue (USD Million) and CAGR (%) by Product (2021-2032)
By Type
Insulin
Polydextrose
Pectin
Beta-Glucan
Others
By Source
Oats
Barley
Chia Seeds
Legumes
Others
By Application
Functional Food
Feed
Pharmaceutical
Chapter 8. Global Soluble Fibers Regional Analysis and Outlook
8.1. Global Soluble Fibers Revenue (USD Million) By Regions (2021- 2032)
8.2. North America Soluble Fibers Revenue (USD Million) by Country (2021-2032)
8.2.1. United States Soluble Fibers Regional Analysis and Outlook
8.2.2. Canada Soluble Fibers Regional Analysis and Outlook
8.2.3. Mexico Soluble Fibers Regional Analysis and Outlook
8.3. Europe Soluble Fibers Revenue (USD Million), by Country (2021-2032)
8.3.1. Germany Soluble Fibers Regional Analysis and Outlook
8.3.2. France Soluble Fibers Regional Analysis and Outlook
8.3.3. United Kingdom Soluble Fibers Regional Analysis and Outlook
8.3.4. Spain Soluble Fibers Regional Analysis and Outlook
8.3.5. Italy Soluble Fibers Regional Analysis and Outlook
8.3.6. Russia Soluble Fibers Regional Analysis and Outlook
8.3.7. Rest of Europe Soluble Fibers Regional Analysis and Outlook
8.4. Asia Pacific Soluble Fibers Revenue (USD Million) by Country (2021-2032)
8.4.1. China Soluble Fibers Regional Analysis and Outlook
8.4.2. Japan Soluble Fibers Regional Analysis and Outlook
8.4.3. India Soluble Fibers Regional Analysis and Outlook
8.4.4. South Korea Soluble Fibers Regional Analysis and Outlook
8.4.5. Australia Soluble Fibers Regional Analysis and Outlook
8.4.6. South East Asia Soluble Fibers Regional Analysis and Outlook
8.4.7. Rest of Asia Pacific Soluble Fibers Regional Analysis and Outlook
8.5. South America Soluble Fibers Revenue (USD Million), by Country (2021-2032)
8.5.1. Brazil Soluble Fibers Regional Analysis and Outlook
8.5.2. Argentina Soluble Fibers Regional Analysis and Outlook
8.5.3. Rest of South America Soluble Fibers Regional Analysis and Outlook
8.6. Middle East and Africa Soluble Fibers Revenue (USD Million) by Country (2021-2032)
8.6.1. Middle East Soluble Fibers Regional Analysis and Outlook
8.6.2. Africa Soluble Fibers Regional Analysis and Outlook
Chapter 9. North America Soluble Fibers Analysis and Outlook
9.1. North America Soluble Fibers Revenue (USD Million) by Segments (2021-2032)
9.1.1. North America Soluble Fibers Revenue (USD Million) by Type (2021-2032)
9.1.2. North America Soluble Fibers Revenue (USD Million) by Application (2021-2032)
9.1.3. North America Soluble Fibers Revenue (USD Million) by Product (2021-2032)
By Type
Insulin
Polydextrose
Pectin
Beta-Glucan
Others
By Source
Oats
Barley
Chia Seeds
Legumes
Others
By Application
Functional Food
Feed
Pharmaceutical
Chapter 10. Europe Soluble Fibers Analysis and Outlook
10.1. Europe Soluble Fibers Revenue (USD Million), by Segments (USD Million) (2021-2032)
10.1.1. Europe Soluble Fibers Revenue (USD Million) by Type (2021-2032)
10.1.2. Europe Soluble Fibers Revenue (USD Million) by Application (2021-2032)
10.1.3. Europe Soluble Fibers Revenue (USD Million) by Product (2021-2032)
By Type
Insulin
Polydextrose
Pectin
Beta-Glucan
Others
By Source
Oats
Barley
Chia Seeds
Legumes
Others
By Application
Functional Food
Feed
Pharmaceutical
Chapter 11. Asia Pacific Soluble Fibers Analysis and Outlook
11.1. Asia Pacific Soluble Fibers Revenue (USD Million), and Revenue (USD Million) by Segments (2021-2032)
11.1.1. Asia Pacific Soluble Fibers Revenue (USD Million) by Type (2021-2032)
11.1.2. Asia Pacific Soluble Fibers Revenue (USD Million) by Application (2021-2032)
11.1.3. Asia Pacific Soluble Fibers Revenue (USD Million) by Product (2021-2032)
By Type
Insulin
Polydextrose
Pectin
Beta-Glucan
Others
By Source
Oats
Barley
Chia Seeds
Legumes
Others
By Application
Functional Food
Feed
Pharmaceutical
Chapter 12. South America Soluble Fibers Analysis and Outlook
12.1. South America Soluble Fibers Revenue (USD Million), by Segments (2021-2032)
12.1.1. South America Soluble Fibers Revenue (USD Million) by Type (2021-2032)
12.1.2. South America Soluble Fibers Revenue (USD Million) by Application (2021-2032)
12.1.3. South America Soluble Fibers Revenue (USD Million) by Product (2021-2032)
By Type
Insulin
Polydextrose
Pectin
Beta-Glucan
Others
By Source
Oats
Barley
Chia Seeds
Legumes
Others
By Application
Functional Food
Feed
Pharmaceutical
Chapter 13. Middle East and Africa Soluble Fibers Analysis and Outlook
13.1. Middle East and Africa Soluble Fibers Revenue (USD Million), by Segments (2021-2032)
13.1.1. Middle East and Africa Soluble Fibers Revenue (USD Million) by Type (2021-2032)
13.1.2. Middle East and Africa Soluble Fibers Revenue (USD Million) by Application (2021-2032)
13.1.3. Middle East and Africa Soluble Fibers Revenue (USD Million) by Product (2021-2032)
By Type
Insulin
Polydextrose
Pectin
Beta-Glucan
Others
By Source
Oats
Barley
Chia Seeds
Legumes
Others
By Application
Functional Food
Feed
Pharmaceutical
Chapter 14. Soluble Fibers Company Profiles
14.1 Business Overview
14.2 Product Profiles
14.3 SWOT Profiles
14.5 Recent Developments
14.6 Financial Profile
List of Companies
Archer Daniels Midland Company
Danisco A/S
Huachang Pharmaceuticals
Ingredion Inc
NEXIRA SAS
Sunopta Inc
Tate & Lyle Plc
15. Methodology and Data Sources
15.1 Customization Offerings
15.2 Subscription Services
15.3 Related Reports
15.4 Publisher Expertise
LIST OF TABLES
Table 1 Market Segmentation Analysis
Table 2 Global Soluble Fibers Market Share of Leading Companies, 2023
Table 3 Product Offerings of Leading Companies
Table 4 Low Growth Scenario Forecasts
Table 5 Reference Case Growth Scenario
Table 6 High Growth Case Scenario
Table 7 Global Soluble Fibers Revenue (USD Million) And CAGR (%) By Type (2021-2032)
Table 8 Global Soluble Fibers Revenue (USD Million) And CAGR (%) By Application (2021-2032)
Table 9 Global Soluble Fibers Revenue (USD Million) And CAGR (%) By Product (2021-2032)
Table 10 Global Soluble Fibers Market Revenue (USD Million) By Regions (2021-2032)
Table 11 Global Soluble Fibers Market Share (%) By Regions (2021-2032)
Table 12 North America Soluble Fibers Revenue (USD Million) By Country (2021-2032)
Table 13 Europe Soluble Fibers Revenue (USD Million) By Country (2021-2032)
Table 14 Asia Pacific Soluble Fibers Revenue (USD Million) By Country (2021-2032)
Table 15 South America Soluble Fibers Revenue (USD Million) By Country (2021-2032)
Table 16 Middle East and Africa Soluble Fibers Revenue (USD Million) By Region (2021-2032)
Table 17 North America Soluble Fibers Revenue (USD Million) By Type (2021-2032)
Table 18 North America Soluble Fibers Revenue (USD Million) By Application (2021-2032)
Table 19 North America Soluble Fibers Revenue (USD Million) By Product (2021-2032)
Table 20 Europe Soluble Fibers Revenue (USD Million) By Type (2021-2032)
Table 21 Europe Soluble Fibers Revenue (USD Million) By Application (2021-2032)
Table 22 Europe Soluble Fibers Revenue (USD Million) By Product (2021-2032)
Table 23 Asia Pacific Soluble Fibers Revenue (USD Million) By Type (2021-2032)
Table 24 Asia Pacific Soluble Fibers Revenue (USD Million) By Application (2021-2032)
Table 25 Asia Pacific Soluble Fibers Revenue (USD Million) By Product (2021-2032)
Table 26 South America Soluble Fibers Revenue (USD Million) By Type (2021-2032)
Table 27 South America Soluble Fibers Revenue (USD Million) By Application (2021-2032)
Table 28 South America Soluble Fibers Revenue (USD Million) By Product (2021-2032)
Table 29 Middle East and Africa Soluble Fibers Revenue (USD Million) By Type (2021-2032)
Table 30 Middle East and Africa Soluble Fibers Revenue (USD Million) By Application (2021-2032)
Table 31 Middle East and Africa Soluble Fibers Revenue (USD Million) By Product (2021-2032)
LIST OF FIGURES
Figure 1. Market Scope
Figure 2. Pricing Forecasts Per Unit, 2023- 2032
Figure 3. Porter’s Five Forces
Figure 4. Global Soluble Fibers Market Revenue (USD Million) By Regions (2021-2032)
Figure 5. Global Soluble Fibers Market Share (%) By Regions (2023)
Figure 6. North America Soluble Fibers Revenue (USD Million) By Country (2021-2032)
Figure 7. United States Soluble Fibers Revenue (USD Million) By Country (2021-2032)
Figure 8. Canada Soluble Fibers Revenue (USD Million) By Country (2021-2032)
Figure 9. Mexico Soluble Fibers Revenue (USD Million) By Country (2021-2032)
Figure 10. Europe Soluble Fibers Revenue (USD Million) By Country (2021-2032)
Figure 11. Germany Soluble Fibers Revenue (USD Million) By Country (2021-2032)
Figure 12. France Soluble Fibers Revenue (USD Million) By Country (2021-2032)
Figure 13. United Kingdom Soluble Fibers Revenue (USD Million) By Country (2021-2032)
Figure 14. Spain Soluble Fibers Revenue (USD Million) By Country (2021-2032)
Figure 15. Italy Soluble Fibers Revenue (USD Million) By Country (2021-2032)
Figure 16. Russia Soluble Fibers Revenue (USD Million) By Country (2021-2032)
Figure 17. Rest of Europe Soluble Fibers Revenue (USD Million) By Country (2021-2032)
Figure 11. Asia Pacific Soluble Fibers Revenue (USD Million) By Country (2021-2032)
Figure 12. China Soluble Fibers Revenue (USD Million) By Country (2021-2032)
Figure 13. Japan Soluble Fibers Revenue (USD Million) By Country (2021-2032)
Figure 14. India Soluble Fibers Revenue (USD Million) By Country (2021-2032)
Figure 15. South Korea Soluble Fibers Revenue (USD Million) By Country (2021-2032)
Figure 16. Australia Soluble Fibers Revenue (USD Million) By Country (2021-2032)
Figure 17. South East Asia Soluble Fibers Revenue (USD Million) By Country (2021-2032)
Figure 18. South America Soluble Fibers Revenue (USD Million) By Country (2021-2032)
Figure 19. Brazil Soluble Fibers Revenue (USD Million) By Country (2021-2032)
Figure 20. Argentina Soluble Fibers Revenue (USD Million) By Country (2021-2032)
Figure 21. Rest of Asia Pacific Soluble Fibers Revenue (USD Million) By Country (2021-2032)
Figure 22. Middle East and Africa Soluble Fibers Revenue (USD Million) By Region (2021-2032)
Figure 23. Saudi Arabia Soluble Fibers Revenue (USD Million) By Region (2021-2032)
Figure 24. The UAE Soluble Fibers Revenue (USD Million) By Region (2021-2032)
Figure 25. Rest of Middle East Soluble Fibers Revenue (USD Million) By Region (2021-2032)
Figure 26. South Africa Soluble Fibers Revenue (USD Million) By Region (2021-2032)
Figure 27. Africa Soluble Fibers Revenue (USD Million) By Region (2021-2032)
Figure 28. North America Soluble Fibers Revenue (USD Million) By Type (2021-2032)
Figure 29. North America Soluble Fibers Revenue (USD Million) By Application (2021-2032)
Figure 30. North America Soluble Fibers Revenue (USD Million) By Product (2021-2032)
Figure 31. Europe Soluble Fibers Revenue (USD Million) By Type (2021-2032)
Figure 32. Europe Soluble Fibers Revenue (USD Million) By Application (2021-2032)
Figure 33. Europe Soluble Fibers Revenue (USD Million) By Product (2021-2032)
Figure 34. Asia Pacific Soluble Fibers Revenue (USD Million) By Type (2021-2032)
Figure 35. Asia Pacific Soluble Fibers Revenue (USD Million) By Application (2021-2032)
Figure 36. Asia Pacific Soluble Fibers Revenue (USD Million) By Product (2021-2032)
Figure 37. South America Soluble Fibers Revenue (USD Million) By Type (2021-2032)
Figure 38. South America Soluble Fibers Revenue (USD Million) By Application (2021-2032)
Figure 39. South America Soluble Fibers Revenue (USD Million) By Product (2021-2032)
Figure 40. Middle East and Africa Soluble Fibers Revenue (USD Million) By Type (2021-2032)
Figure 41. Middle East and Africa Soluble Fibers Revenue (USD Million) By Application (2021-2032)
Figure 42. Middle East and Africa Soluble Fibers Revenue (USD Million) By Product (2021-2032)
By Type
Insulin
Polydextrose
Pectin
Beta-Glucan
Others
By Source
Oats
Barley
Chia Seeds
Legumes
Others
By Application
Functional Food
Feed
Pharmaceutical
Countries Analyzed
North America (US, Canada, Mexico)
Europe (Germany, UK, France, Spain, Italy, Russia, Rest of Europe)
Asia Pacific (China, India, Japan, South Korea, Australia, South East Asia, Rest of Asia)
South America (Brazil, Argentina, Rest of South America)
Middle East and Africa (Saudi Arabia, UAE, Rest of Middle East, South Africa, Egypt, Rest of Africa)
