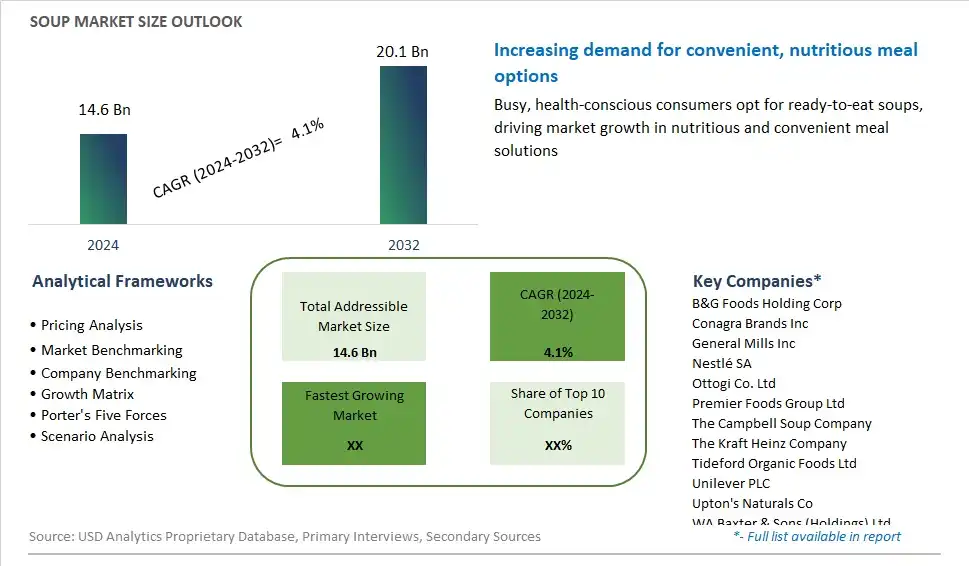
Global Soup Market Size is valued at $14.6 Billion in 2024 and is forecast to register a growth rate (CAGR) of 4.1% to reach $20.1 Billion by 2032.
The global Soup Market Comprehensive Study analyzes and forecasts the market size across 6 regions and 24 countries for diverse segments -By Type (Canned/Preserved, Chilled, Dehydrated, Frozen, Instant, UHT), By Category (Vegetarian Soup, Non-vegetarian Soup), By Packaging (Canned, Pouched, Others), By Distribution Channel (Supermarkets/Hypermarkets, Convenience Stores, Online, Others)
An Introduction to Soup Market
The soup market is thriving in 2024, driven by consumer demand for convenient and nutritious meal solutions that offer comfort and flavor. With busy lifestyles and an increasing focus on health and wellness, consumers are turning to soup as a satisfying and convenient option for mealtime. Manufacturers are responding to this demand by innovating with diverse flavors, premium ingredients, and convenient packaging formats that cater to different dietary preferences and lifestyles. From classic favorites like chicken noodle soup to global-inspired creations such as miso and pho, the soup market offers a wide variety of options to suit diverse tastes and occasions. As consumers seek nourishing and convenient meal solutions, the soup market is poised for continued growth and innovation.
Soup Competitive Landscape
The market report analyses the leading companies in the industry including B&G Foods Holding Corp, Conagra Brands Inc, General Mills Inc, Nestlé SA, Ottogi Co. Ltd, Premier Foods Group Ltd, The Campbell Soup Company, The Kraft Heinz Company, Tideford Organic Foods Ltd, Unilever PLC, Upton's Naturals Co, WA Baxter & Sons (Holdings) Ltd, and Others.
Soup Market Dynamics
Soup Market Trend: Increased Demand for Convenience and Health
Consumers are increasingly seeking convenience without compromising on health, leading to a significant trend in the soup market. Ready-to-eat and easy-to-prepare soup options are gaining popularity among busy consumers looking for quick meal solutions. Additionally, there is a growing interest in healthier food choices, driving the demand for soups made with natural, organic, and clean-label ingredients. This trend reflects a shift towards healthier eating habits and a desire for convenient yet nutritious meal options, shaping the evolution of the soup market.
Market Driver: Rising Health Consciousness and Dietary Preferences
One of the primary drivers of the soup market is the rising health consciousness and evolving dietary preferences among consumers. As people become more aware of the impact of diet on their overall health and well-being, there is a growing demand for soups that offer nutritional benefits and cater to specific dietary requirements. Consumers are seeking soups that are low in sodium, fat, and calories, while also being rich in protein, fiber, vitamins, and minerals. This driver is pushing soup manufacturers to innovate and develop products that align with consumers' health-focused lifestyles and dietary choices.
Market Opportunity: Expansion into Diverse Flavor Profiles and Ethnic Varieties
An exciting opportunity within the soup market lies in the expansion into diverse flavor profiles and ethnic varieties. As consumers' palates become more adventurous and multicultural, there is a growing demand for soups that offer unique and authentic flavors from around the world. Manufacturers can capitalize on this opportunity by introducing a wide range of ethnic-inspired soups, such as Thai curry, Moroccan lentil, Mexican tortilla, and Japanese miso. By offering diverse flavor options that cater to different taste preferences and cultural backgrounds, soup brands can attract new consumers, drive product innovation, and differentiate themselves in a competitive market landscape.
Soup Market Share Analysis: Canned/Preserved held the dominant market share in 2024
Canned/preserved soup is the largest segment in the soup market. This dominance is driven by the convenience, long shelf life, and affordability that canned soups offer. Consumers appreciate the ready-to-eat nature of canned soups, which require minimal preparation time, making them ideal for busy lifestyles. The extensive variety of flavors and types available in canned form caters to diverse taste preferences and dietary needs, further boosting their popularity. Additionally, canned soups are often enriched with nutrients and fortified with vitamins, appealing to health-conscious consumers seeking convenient yet nutritious meal options. The established trust and familiarity with major canned soup brands also play a significant role in maintaining their market leadership. As a result, despite competition from other types like chilled and instant soups, canned/preserved soups continue to be the most preferred and widely consumed segment in the soup market.
Soup Market Share Analysis: Vegetarian Soup market is poised to register the fastest growth rae over the forecast period to 2032
Vegetarian soup is the fastest-growing segment in the soup market. This surge is primarily driven by the increasing global trend towards plant-based diets, spurred by growing health awareness and environmental concerns. Consumers are increasingly seeking out vegetarian options for their perceived health benefits, such as lower cholesterol levels, higher fiber content, and the presence of essential vitamins and minerals. Additionally, the rising number of individuals adopting vegetarianism or reducing meat consumption for ethical reasons has expanded the market for vegetarian soups. Food manufacturers are responding to this demand by innovating and offering a wide variety of flavorful and nutrient-dense vegetarian soup options. The inclusion of superfoods, organic ingredients, and exotic vegetables in these soups also appeals to health-conscious consumers looking for nutritious and convenient meal solutions. As a result, the vegetarian soup segment is experiencing robust growth, reflecting a broader shift towards healthier and more sustainable eating habits.
Soup Market Share Analysis: Pouched Segment Dominates with Rapid Expansion held the dominant market share in 2024
Amidst the diverse packaging options in the soup market, the pouched segment is the leader in terms of growth and market share. Pouches offer convenience, portability, and eco-friendliness, resonating well with modern consumer lifestyles characterized by on-the-go consumption habits and increasing environmental consciousness. Further, the pouched packaging format allows for innovative branding and product differentiation, enabling soup manufacturers to attract consumers through visually appealing designs and convenient serving sizes. Additionally, advancements in packaging technology have enhanced the shelf life and preservation of soups in pouches, ensuring product quality and freshness. As a result, the pouched segment experiences exponential growth, driven by consumer demand for convenience, sustainability, and product innovation, thereby solidifying its position as the largest and most dynamic segment within the soup market landscape.
Soup Market Segmentation
By Type
Canned/Preserved
Chilled
Dehydrated
Frozen
Instant
UHT
By Category
Vegetarian Soup
Non-vegetarian Soup
By Packaging
Canned
Pouched
Others
By Distribution Channel
Supermarkets/Hypermarkets
Convenience Stores
Online
Others
Countries Analyzed
North America (US, Canada, Mexico)
Europe (Germany, UK, France, Spain, Italy, Russia, Rest of Europe)
Asia Pacific (China, India, Japan, South Korea, Australia, South East Asia, Rest of Asia)
South America (Brazil, Argentina, Rest of South America)
Middle East and Africa (Saudi Arabia, UAE, Rest of Middle East, South Africa, Egypt, Rest of Africa)
Soup Companies Profiled in the Study
B&G Foods Holding Corp
Conagra Brands Inc
General Mills Inc
Nestlé SA
Ottogi Co. Ltd
Premier Foods Group Ltd
The Campbell Soup Company
The Kraft Heinz Company
Tideford Organic Foods Ltd
Unilever PLC
Upton's Naturals Co
WA Baxter & Sons (Holdings) Ltd
*- List Not Exhaustive
Chapter 1. TABLE OF CONTENTS
Chapter 2. Introduction to Soup Market
2.1. Market Overview
2.2. Key Statistics and Report Highlights
2.3. Scope of the Comprehensive Study
2.3.1. Market Definition
2.3.2 Countries and Regions Covered
2.3.3 Research Objective
2.3.4 Units, Currency, and Conversions
2.3.5 Industry Value Chain
2.4. Key Market Segments
2.5. Key Companies
2.6. Study Period
Chapter 3. Strategic Analysis Review
3.1. Soup Pricing Analysis and Forecast
3.2. Porter’s Five Forces
3.3. Market Ecosystem
3.4. SWOT Analysis
3.5. Regulatory Scenario
3.3. Effects of Inflation, Russia-Ukraine War, moderating economic growth, and other macroeconomic factors
Chapter 4. Competitive Landscape
4.1. Market Share Analysis
4.1.1. Global Soup Market Share by Company, 2023
4.1.2. Product Offerings of Leading Soup Companies
4.2. Market Entropy
4.2.1. New Product Launches in the Industry
4.2.2. Mergers, Acquisitions, Joint ventures, and Partnerships
4.3. Key Strategies and Best Practices
Chapter 5. Global Market Projections: Best, Reference, and Low Case Scenarios
5.1. Growth Analysis- Case Scenario Definitions
5.2. Low Growth Case Scenario Forecasts
5.3. Reference Growth Case Scenario Forecasts
5.4. High Growth Case Scenario Forecasts
Chapter 6. Market Dynamics
6.1. Soup Market Drivers
6.2. Soup Market Challenges
6.6. Soup Market Opportunities
6.4. Soup Market Trends
Chapter 7. Global Soup Market Outlook Trends
7.1. Global Soup Revenue (USD Million) and CAGR (%) by Type (2021-2032)
7.2. Global Soup Revenue (USD Million) and CAGR (%) by Application (2021-2032)
7.3. Global Soup Revenue (USD Million) and CAGR (%) by Product (2021-2032)
By Type
Canned/Preserved
Chilled
Dehydrated
Frozen
Instant
UHT
By Category
Vegetarian Soup
Non-vegetarian Soup
By Packaging
Canned
Pouched
Others
By Distribution Channel
Supermarkets/Hypermarkets
Convenience Stores
Online
Others
Chapter 8. Global Soup Regional Analysis and Outlook
8.1. Global Soup Revenue (USD Million) By Regions (2021- 2032)
8.2. North America Soup Revenue (USD Million) by Country (2021-2032)
8.2.1. United States Soup Regional Analysis and Outlook
8.2.2. Canada Soup Regional Analysis and Outlook
8.2.3. Mexico Soup Regional Analysis and Outlook
8.3. Europe Soup Revenue (USD Million), by Country (2021-2032)
8.3.1. Germany Soup Regional Analysis and Outlook
8.3.2. France Soup Regional Analysis and Outlook
8.3.3. United Kingdom Soup Regional Analysis and Outlook
8.3.4. Spain Soup Regional Analysis and Outlook
8.3.5. Italy Soup Regional Analysis and Outlook
8.3.6. Russia Soup Regional Analysis and Outlook
8.3.7. Rest of Europe Soup Regional Analysis and Outlook
8.4. Asia Pacific Soup Revenue (USD Million) by Country (2021-2032)
8.4.1. China Soup Regional Analysis and Outlook
8.4.2. Japan Soup Regional Analysis and Outlook
8.4.3. India Soup Regional Analysis and Outlook
8.4.4. South Korea Soup Regional Analysis and Outlook
8.4.5. Australia Soup Regional Analysis and Outlook
8.4.6. South East Asia Soup Regional Analysis and Outlook
8.4.7. Rest of Asia Pacific Soup Regional Analysis and Outlook
8.5. South America Soup Revenue (USD Million), by Country (2021-2032)
8.5.1. Brazil Soup Regional Analysis and Outlook
8.5.2. Argentina Soup Regional Analysis and Outlook
8.5.3. Rest of South America Soup Regional Analysis and Outlook
8.6. Middle East and Africa Soup Revenue (USD Million) by Country (2021-2032)
8.6.1. Middle East Soup Regional Analysis and Outlook
8.6.2. Africa Soup Regional Analysis and Outlook
Chapter 9. North America Soup Analysis and Outlook
9.1. North America Soup Revenue (USD Million) by Segments (2021-2032)
9.1.1. North America Soup Revenue (USD Million) by Type (2021-2032)
9.1.2. North America Soup Revenue (USD Million) by Application (2021-2032)
9.1.3. North America Soup Revenue (USD Million) by Product (2021-2032)
By Type
Canned/Preserved
Chilled
Dehydrated
Frozen
Instant
UHT
By Category
Vegetarian Soup
Non-vegetarian Soup
By Packaging
Canned
Pouched
Others
By Distribution Channel
Supermarkets/Hypermarkets
Convenience Stores
Online
Others
Chapter 10. Europe Soup Analysis and Outlook
10.1. Europe Soup Revenue (USD Million), by Segments (USD Million) (2021-2032)
10.1.1. Europe Soup Revenue (USD Million) by Type (2021-2032)
10.1.2. Europe Soup Revenue (USD Million) by Application (2021-2032)
10.1.3. Europe Soup Revenue (USD Million) by Product (2021-2032)
By Type
Canned/Preserved
Chilled
Dehydrated
Frozen
Instant
UHT
By Category
Vegetarian Soup
Non-vegetarian Soup
By Packaging
Canned
Pouched
Others
By Distribution Channel
Supermarkets/Hypermarkets
Convenience Stores
Online
Others
Chapter 11. Asia Pacific Soup Analysis and Outlook
11.1. Asia Pacific Soup Revenue (USD Million), and Revenue (USD Million) by Segments (2021-2032)
11.1.1. Asia Pacific Soup Revenue (USD Million) by Type (2021-2032)
11.1.2. Asia Pacific Soup Revenue (USD Million) by Application (2021-2032)
11.1.3. Asia Pacific Soup Revenue (USD Million) by Product (2021-2032)
By Type
Canned/Preserved
Chilled
Dehydrated
Frozen
Instant
UHT
By Category
Vegetarian Soup
Non-vegetarian Soup
By Packaging
Canned
Pouched
Others
By Distribution Channel
Supermarkets/Hypermarkets
Convenience Stores
Online
Others
Chapter 12. South America Soup Analysis and Outlook
12.1. South America Soup Revenue (USD Million), by Segments (2021-2032)
12.1.1. South America Soup Revenue (USD Million) by Type (2021-2032)
12.1.2. South America Soup Revenue (USD Million) by Application (2021-2032)
12.1.3. South America Soup Revenue (USD Million) by Product (2021-2032)
By Type
Canned/Preserved
Chilled
Dehydrated
Frozen
Instant
UHT
By Category
Vegetarian Soup
Non-vegetarian Soup
By Packaging
Canned
Pouched
Others
By Distribution Channel
Supermarkets/Hypermarkets
Convenience Stores
Online
Others
Chapter 13. Middle East and Africa Soup Analysis and Outlook
13.1. Middle East and Africa Soup Revenue (USD Million), by Segments (2021-2032)
13.1.1. Middle East and Africa Soup Revenue (USD Million) by Type (2021-2032)
13.1.2. Middle East and Africa Soup Revenue (USD Million) by Application (2021-2032)
13.1.3. Middle East and Africa Soup Revenue (USD Million) by Product (2021-2032)
By Type
Canned/Preserved
Chilled
Dehydrated
Frozen
Instant
UHT
By Category
Vegetarian Soup
Non-vegetarian Soup
By Packaging
Canned
Pouched
Others
By Distribution Channel
Supermarkets/Hypermarkets
Convenience Stores
Online
Others
Chapter 14. Soup Company Profiles
14.1 Business Overview
14.2 Product Profiles
14.3 SWOT Profiles
14.5 Recent Developments
14.6 Financial Profile
List of Companies
B&G Foods Holding Corp
Conagra Brands Inc
General Mills Inc
Nestlé SA
Ottogi Co. Ltd
Premier Foods Group Ltd
The Campbell Soup Company
The Kraft Heinz Company
Tideford Organic Foods Ltd
Unilever PLC
Upton's Naturals Co
WA Baxter & Sons (Holdings) Ltd
15. Methodology and Data Sources
15.1 Customization Offerings
15.2 Subscription Services
15.3 Related Reports
15.4 Publisher Expertise
LIST OF TABLES
Table 1 Market Segmentation Analysis
Table 2 Global Soup Market Share of Leading Companies, 2023
Table 3 Product Offerings of Leading Companies
Table 4 Low Growth Scenario Forecasts
Table 5 Reference Case Growth Scenario
Table 6 High Growth Case Scenario
Table 7 Global Soup Revenue (USD Million) And CAGR (%) By Type (2021-2032)
Table 8 Global Soup Revenue (USD Million) And CAGR (%) By Application (2021-2032)
Table 9 Global Soup Revenue (USD Million) And CAGR (%) By Product (2021-2032)
Table 10 Global Soup Market Revenue (USD Million) By Regions (2021-2032)
Table 11 Global Soup Market Share (%) By Regions (2021-2032)
Table 12 North America Soup Revenue (USD Million) By Country (2021-2032)
Table 13 Europe Soup Revenue (USD Million) By Country (2021-2032)
Table 14 Asia Pacific Soup Revenue (USD Million) By Country (2021-2032)
Table 15 South America Soup Revenue (USD Million) By Country (2021-2032)
Table 16 Middle East and Africa Soup Revenue (USD Million) By Region (2021-2032)
Table 17 North America Soup Revenue (USD Million) By Type (2021-2032)
Table 18 North America Soup Revenue (USD Million) By Application (2021-2032)
Table 19 North America Soup Revenue (USD Million) By Product (2021-2032)
Table 20 Europe Soup Revenue (USD Million) By Type (2021-2032)
Table 21 Europe Soup Revenue (USD Million) By Application (2021-2032)
Table 22 Europe Soup Revenue (USD Million) By Product (2021-2032)
Table 23 Asia Pacific Soup Revenue (USD Million) By Type (2021-2032)
Table 24 Asia Pacific Soup Revenue (USD Million) By Application (2021-2032)
Table 25 Asia Pacific Soup Revenue (USD Million) By Product (2021-2032)
Table 26 South America Soup Revenue (USD Million) By Type (2021-2032)
Table 27 South America Soup Revenue (USD Million) By Application (2021-2032)
Table 28 South America Soup Revenue (USD Million) By Product (2021-2032)
Table 29 Middle East and Africa Soup Revenue (USD Million) By Type (2021-2032)
Table 30 Middle East and Africa Soup Revenue (USD Million) By Application (2021-2032)
Table 31 Middle East and Africa Soup Revenue (USD Million) By Product (2021-2032)
LIST OF FIGURES
Figure 1. Market Scope
Figure 2. Pricing Forecasts Per Unit, 2023- 2032
Figure 3. Porter’s Five Forces
Figure 4. Global Soup Market Revenue (USD Million) By Regions (2021-2032)
Figure 5. Global Soup Market Share (%) By Regions (2023)
Figure 6. North America Soup Revenue (USD Million) By Country (2021-2032)
Figure 7. United States Soup Revenue (USD Million) By Country (2021-2032)
Figure 8. Canada Soup Revenue (USD Million) By Country (2021-2032)
Figure 9. Mexico Soup Revenue (USD Million) By Country (2021-2032)
Figure 10. Europe Soup Revenue (USD Million) By Country (2021-2032)
Figure 11. Germany Soup Revenue (USD Million) By Country (2021-2032)
Figure 12. France Soup Revenue (USD Million) By Country (2021-2032)
Figure 13. United Kingdom Soup Revenue (USD Million) By Country (2021-2032)
Figure 14. Spain Soup Revenue (USD Million) By Country (2021-2032)
Figure 15. Italy Soup Revenue (USD Million) By Country (2021-2032)
Figure 16. Russia Soup Revenue (USD Million) By Country (2021-2032)
Figure 17. Rest of Europe Soup Revenue (USD Million) By Country (2021-2032)
Figure 11. Asia Pacific Soup Revenue (USD Million) By Country (2021-2032)
Figure 12. China Soup Revenue (USD Million) By Country (2021-2032)
Figure 13. Japan Soup Revenue (USD Million) By Country (2021-2032)
Figure 14. India Soup Revenue (USD Million) By Country (2021-2032)
Figure 15. South Korea Soup Revenue (USD Million) By Country (2021-2032)
Figure 16. Australia Soup Revenue (USD Million) By Country (2021-2032)
Figure 17. South East Asia Soup Revenue (USD Million) By Country (2021-2032)
Figure 18. South America Soup Revenue (USD Million) By Country (2021-2032)
Figure 19. Brazil Soup Revenue (USD Million) By Country (2021-2032)
Figure 20. Argentina Soup Revenue (USD Million) By Country (2021-2032)
Figure 21. Rest of Asia Pacific Soup Revenue (USD Million) By Country (2021-2032)
Figure 22. Middle East and Africa Soup Revenue (USD Million) By Region (2021-2032)
Figure 23. Saudi Arabia Soup Revenue (USD Million) By Region (2021-2032)
Figure 24. The UAE Soup Revenue (USD Million) By Region (2021-2032)
Figure 25. Rest of Middle East Soup Revenue (USD Million) By Region (2021-2032)
Figure 26. South Africa Soup Revenue (USD Million) By Region (2021-2032)
Figure 27. Africa Soup Revenue (USD Million) By Region (2021-2032)
Figure 28. North America Soup Revenue (USD Million) By Type (2021-2032)
Figure 29. North America Soup Revenue (USD Million) By Application (2021-2032)
Figure 30. North America Soup Revenue (USD Million) By Product (2021-2032)
Figure 31. Europe Soup Revenue (USD Million) By Type (2021-2032)
Figure 32. Europe Soup Revenue (USD Million) By Application (2021-2032)
Figure 33. Europe Soup Revenue (USD Million) By Product (2021-2032)
Figure 34. Asia Pacific Soup Revenue (USD Million) By Type (2021-2032)
Figure 35. Asia Pacific Soup Revenue (USD Million) By Application (2021-2032)
Figure 36. Asia Pacific Soup Revenue (USD Million) By Product (2021-2032)
Figure 37. South America Soup Revenue (USD Million) By Type (2021-2032)
Figure 38. South America Soup Revenue (USD Million) By Application (2021-2032)
Figure 39. South America Soup Revenue (USD Million) By Product (2021-2032)
Figure 40. Middle East and Africa Soup Revenue (USD Million) By Type (2021-2032)
Figure 41. Middle East and Africa Soup Revenue (USD Million) By Application (2021-2032)
Figure 42. Middle East and Africa Soup Revenue (USD Million) By Product (2021-2032)
By Type
Canned/Preserved
Chilled
Dehydrated
Frozen
Instant
UHT
By Category
Vegetarian Soup
Non-vegetarian Soup
By Packaging
Canned
Pouched
Others
By Distribution Channel
Supermarkets/Hypermarkets
Convenience Stores
Online
Others
Countries Analyzed
North America (US, Canada, Mexico)
Europe (Germany, UK, France, Spain, Italy, Russia, Rest of Europe)
Asia Pacific (China, India, Japan, South Korea, Australia, South East Asia, Rest of Asia)
South America (Brazil, Argentina, Rest of South America)
Middle East and Africa (Saudi Arabia, UAE, Rest of Middle East, South Africa, Egypt, Rest of Africa)
