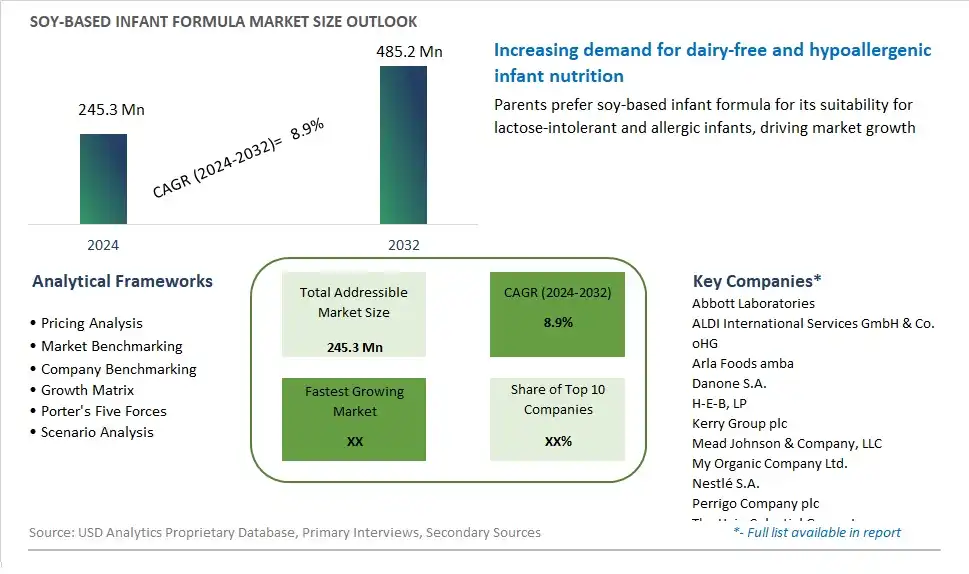
Global Soy-Based Infant Formula Market Size is valued at $245.3 Million in 2024 and is forecast to register a growth rate (CAGR) of 8.9% to reach $485.2 Million by 2032.
The global Soy-Based Infant Formula Market Comprehensive Study analyzes and forecasts the market size across 6 regions and 24 countries for diverse segments -By Type (Low-Fat Soy-based Infant Formula, Whole-fat Soy-based Infant Formula), By Age Group (0 to 6 Months, 12 to 36 Months, 6 to 12 Months)
An Introduction to Soy-Based Infant Formula Market
The Soy-Based Infant Formula Market involves the production and sale of infant formula made from soy protein, catering to infants who are lactose intolerant or allergic to cow's milk protein. The market is driven by increasing prevalence of lactose intolerance and milk allergies, rising awareness about the benefits of soy-based nutrition, and growing demand for plant-based infant formula options. Additionally, advancements in formula formulations and regulatory support for infant nutrition products support market growth.
Soy Based Infant Formula Competitive Landscape
The market report analyses the leading companies in the industry including Abbott Laboratories, ALDI International Services GmbH & Co. oHG, Arla Foods amba, Danone S.A., H-E-B, LP, Kerry Group plc, Mead Johnson & Company, LLC, My Organic Company Ltd., Nestlé S.A., Perrigo Company plc, The Hain Celestial Group, Inc., Walmart Inc., Woolworths Group Limited, and Others.
Soy Based Infant Formula Market Dynamics
Market Trend: Growing Popularity of Plant-Based Infant Nutrition
The most prominent trend in the Soy-Based Infant Formula Market is the growing popularity of plant-based infant nutrition. As parents become more aware of the benefits of plant-based diets and seek alternatives to traditional dairy-based formulas, soy-based infant formulas are gaining traction. This trend is driven by concerns about lactose intolerance, allergies, and the desire to provide infants with natural and sustainable nutrition options
Market Driver: Rising Incidence of Lactose Intolerance and Milk Allergies
The rising incidence of lactose intolerance and milk allergies in infants is a major driver of the Soy-Based Infant Formula Market. As more infants are diagnosed with these conditions, parents are turning to soy-based formulas as a safe and nutritious alternative to cow’s milk-based products. This driver is increasing the demand for soy-based infant formulas, as they offer a viable solution for infants with specific dietary needs
Market Opportunity: Innovation in Soy-Based Formula Composition
A significant opportunity in the Soy-Based Infant Formula Market lies in innovation in formula composition. By enhancing the nutritional profile of soy-based formulas with added vitamins, minerals, and prebiotics, companies can offer products that closely mimic the benefits of breast milk. This innovation can attract health-conscious parents and drive market growth by providing superior nutrition for infants
Soy-Based Infant Formula Market Share Analysis: Whole-fat Soy-based Infant Formula is the Fastest Growing Segment to 2032
Whole-fat soy-based infant formula is anticipated to be the fastest-growing segment in the Soy-Based Infant Formula Market by type to 2032. The demand for whole-fat soy-based infant formula is driven by the increasing awareness of its nutritional benefits, including essential fatty acids necessary for infant growth and development. Additionally, whole-fat soy-based formulas are often preferred for their energy-dense content, supporting the dietary needs of infants with higher calorie requirements. The rising prevalence of lactose intolerance and milk allergies further supports the growth of this segment, as parents seek suitable alternatives to traditional dairy-based formulas.
Soy-Based Infant Formula Market by Age Group: 6 to 12 Months is the Fastest Growing Segment to 2032
The 6 to 12 months age group is projected to be the fastest-growing segment in the Soy-Based Infant Formula Market by age group to 2032. This period is critical for infant growth and development, requiring a balanced and nutrient-rich diet. Soy-based formulas for this age group cater to parents seeking lactose-free and allergen-friendly options that provide essential nutrients. The increasing prevalence of milk allergies and the growing awareness of the benefits of soy-based nutrition for infants drive the demand for soy-based infant formulas tailored to this specific age group.
Soy Based Infant Formula Market Segmentation
By Type
Low-Fat Soy-based Infant Formula
Whole-fat Soy-based Infant Formula
By Age Group
0 to 6 Months
12 to 36 Months
6 to 12 Months
Countries Analyzed
North America (US, Canada, Mexico)
Europe (Germany, UK, France, Spain, Italy, Russia, Rest of Europe)
Asia Pacific (China, India, Japan, South Korea, Australia, South East Asia, Rest of Asia)
South America (Brazil, Argentina, Rest of South America)
Middle East and Africa (Saudi Arabia, UAE, Rest of Middle East, South Africa, Egypt, Rest of Africa)
Soy Based Infant Formula Companies Profiled in the Study
Abbott Laboratories
ALDI International Services GmbH & Co. oHG
Arla Foods amba
Danone S.A.
H-E-B, LP
Kerry Group plc
Mead Johnson & Company, LLC
My Organic Company Ltd.
Nestlé S.A.
Perrigo Company plc
The Hain Celestial Group, Inc.
Walmart Inc.
Woolworths Group Limited
*- List Not Exhaustive
Chapter 1. TABLE OF CONTENTS
Chapter 2. Introduction to Soy Based Infant Formula Market
2.1. Market Overview
2.2. Key Statistics and Report Highlights
2.3. Scope of the Comprehensive Study
2.3.1. Market Definition
2.3.2 Countries and Regions Covered
2.3.3 Research Objective
2.3.4 Units, Currency, and Conversions
2.3.5 Industry Value Chain
2.4. Key Market Segments
2.5. Key Companies
2.6. Study Period
Chapter 3. Strategic Analysis Review
3.1. Soy Based Infant Formula Pricing Analysis and Forecast
3.2. Porter’s Five Forces
3.3. Market Ecosystem
3.4. SWOT Analysis
3.5. Regulatory Scenario
3.3. Effects of Inflation, Russia-Ukraine War, moderating economic growth, and other macroeconomic factors
Chapter 4. Competitive Landscape
4.1. Market Share Analysis
4.1.1. Global Soy Based Infant Formula Market Share by Company, 2023
4.1.2. Product Offerings of Leading Soy Based Infant Formula Companies
4.2. Market Entropy
4.2.1. New Product Launches in the Industry
4.2.2. Mergers, Acquisitions, Joint ventures, and Partnerships
4.3. Key Strategies and Best Practices
Chapter 5. Global Market Projections: Best, Reference, and Low Case Scenarios
5.1. Growth Analysis- Case Scenario Definitions
5.2. Low Growth Case Scenario Forecasts
5.3. Reference Growth Case Scenario Forecasts
5.4. High Growth Case Scenario Forecasts
Chapter 6. Market Dynamics
6.1. Soy Based Infant Formula Market Drivers
6.2. Soy Based Infant Formula Market Challenges
6.6. Soy Based Infant Formula Market Opportunities
6.4. Soy Based Infant Formula Market Trends
Chapter 7. Global Soy Based Infant Formula Market Outlook Trends
7.1. Global Soy Based Infant Formula Revenue (USD Million) and CAGR (%) by Type (2021-2032)
7.2. Global Soy Based Infant Formula Revenue (USD Million) and CAGR (%) by Application (2021-2032)
7.3. Global Soy Based Infant Formula Revenue (USD Million) and CAGR (%) by Product (2021-2032)
By Type
Low-Fat Soy-based Infant Formula
Whole-fat Soy-based Infant Formula
By Age Group
0 to 6 Months
12 to 36 Months
6 to 12 Months
Chapter 8. Global Soy Based Infant Formula Regional Analysis and Outlook
8.1. Global Soy Based Infant Formula Revenue (USD Million) By Regions (2021- 2032)
8.2. North America Soy Based Infant Formula Revenue (USD Million) by Country (2021-2032)
8.2.1. United States Soy Based Infant Formula Regional Analysis and Outlook
8.2.2. Canada Soy Based Infant Formula Regional Analysis and Outlook
8.2.3. Mexico Soy Based Infant Formula Regional Analysis and Outlook
8.3. Europe Soy Based Infant Formula Revenue (USD Million), by Country (2021-2032)
8.3.1. Germany Soy Based Infant Formula Regional Analysis and Outlook
8.3.2. France Soy Based Infant Formula Regional Analysis and Outlook
8.3.3. United Kingdom Soy Based Infant Formula Regional Analysis and Outlook
8.3.4. Spain Soy Based Infant Formula Regional Analysis and Outlook
8.3.5. Italy Soy Based Infant Formula Regional Analysis and Outlook
8.3.6. Russia Soy Based Infant Formula Regional Analysis and Outlook
8.3.7. Rest of Europe Soy Based Infant Formula Regional Analysis and Outlook
8.4. Asia Pacific Soy Based Infant Formula Revenue (USD Million) by Country (2021-2032)
8.4.1. China Soy Based Infant Formula Regional Analysis and Outlook
8.4.2. Japan Soy Based Infant Formula Regional Analysis and Outlook
8.4.3. India Soy Based Infant Formula Regional Analysis and Outlook
8.4.4. South Korea Soy Based Infant Formula Regional Analysis and Outlook
8.4.5. Australia Soy Based Infant Formula Regional Analysis and Outlook
8.4.6. South East Asia Soy Based Infant Formula Regional Analysis and Outlook
8.4.7. Rest of Asia Pacific Soy Based Infant Formula Regional Analysis and Outlook
8.5. South America Soy Based Infant Formula Revenue (USD Million), by Country (2021-2032)
8.5.1. Brazil Soy Based Infant Formula Regional Analysis and Outlook
8.5.2. Argentina Soy Based Infant Formula Regional Analysis and Outlook
8.5.3. Rest of South America Soy Based Infant Formula Regional Analysis and Outlook
8.6. Middle East and Africa Soy Based Infant Formula Revenue (USD Million) by Country (2021-2032)
8.6.1. Middle East Soy Based Infant Formula Regional Analysis and Outlook
8.6.2. Africa Soy Based Infant Formula Regional Analysis and Outlook
Chapter 9. North America Soy Based Infant Formula Analysis and Outlook
9.1. North America Soy Based Infant Formula Revenue (USD Million) by Segments (2021-2032)
9.1.1. North America Soy Based Infant Formula Revenue (USD Million) by Type (2021-2032)
9.1.2. North America Soy Based Infant Formula Revenue (USD Million) by Application (2021-2032)
9.1.3. North America Soy Based Infant Formula Revenue (USD Million) by Product (2021-2032)
By Type
Low-Fat Soy-based Infant Formula
Whole-fat Soy-based Infant Formula
By Age Group
0 to 6 Months
12 to 36 Months
6 to 12 Months
Chapter 10. Europe Soy Based Infant Formula Analysis and Outlook
10.1. Europe Soy Based Infant Formula Revenue (USD Million), by Segments (USD Million) (2021-2032)
10.1.1. Europe Soy Based Infant Formula Revenue (USD Million) by Type (2021-2032)
10.1.2. Europe Soy Based Infant Formula Revenue (USD Million) by Application (2021-2032)
10.1.3. Europe Soy Based Infant Formula Revenue (USD Million) by Product (2021-2032)
By Type
Low-Fat Soy-based Infant Formula
Whole-fat Soy-based Infant Formula
By Age Group
0 to 6 Months
12 to 36 Months
6 to 12 Months
Chapter 11. Asia Pacific Soy Based Infant Formula Analysis and Outlook
11.1. Asia Pacific Soy Based Infant Formula Revenue (USD Million), and Revenue (USD Million) by Segments (2021-2032)
11.1.1. Asia Pacific Soy Based Infant Formula Revenue (USD Million) by Type (2021-2032)
11.1.2. Asia Pacific Soy Based Infant Formula Revenue (USD Million) by Application (2021-2032)
11.1.3. Asia Pacific Soy Based Infant Formula Revenue (USD Million) by Product (2021-2032)
By Type
Low-Fat Soy-based Infant Formula
Whole-fat Soy-based Infant Formula
By Age Group
0 to 6 Months
12 to 36 Months
6 to 12 Months
Chapter 12. South America Soy Based Infant Formula Analysis and Outlook
12.1. South America Soy Based Infant Formula Revenue (USD Million), by Segments (2021-2032)
12.1.1. South America Soy Based Infant Formula Revenue (USD Million) by Type (2021-2032)
12.1.2. South America Soy Based Infant Formula Revenue (USD Million) by Application (2021-2032)
12.1.3. South America Soy Based Infant Formula Revenue (USD Million) by Product (2021-2032)
By Type
Low-Fat Soy-based Infant Formula
Whole-fat Soy-based Infant Formula
By Age Group
0 to 6 Months
12 to 36 Months
6 to 12 Months
Chapter 13. Middle East and Africa Soy Based Infant Formula Analysis and Outlook
13.1. Middle East and Africa Soy Based Infant Formula Revenue (USD Million), by Segments (2021-2032)
13.1.1. Middle East and Africa Soy Based Infant Formula Revenue (USD Million) by Type (2021-2032)
13.1.2. Middle East and Africa Soy Based Infant Formula Revenue (USD Million) by Application (2021-2032)
13.1.3. Middle East and Africa Soy Based Infant Formula Revenue (USD Million) by Product (2021-2032)
By Type
Low-Fat Soy-based Infant Formula
Whole-fat Soy-based Infant Formula
By Age Group
0 to 6 Months
12 to 36 Months
6 to 12 Months
Chapter 14. Soy Based Infant Formula Company Profiles
14.1 Business Overview
14.2 Product Profiles
14.3 SWOT Profiles
14.5 Recent Developments
14.6 Financial Profile
List of Companies
Abbott Laboratories
ALDI International Services GmbH & Co. oHG
Arla Foods amba
Danone S.A.
H-E-B, LP
Kerry Group plc
Mead Johnson & Company, LLC
My Organic Company Ltd.
Nestlé S.A.
Perrigo Company plc
The Hain Celestial Group, Inc.
Walmart Inc.
Woolworths Group Limited
15. Methodology and Data Sources
15.1 Customization Offerings
15.2 Subscription Services
15.3 Related Reports
15.4 Publisher Expertise
LIST OF TABLES
Table 1 Market Segmentation Analysis
Table 2 Global Soy Based Infant Formula Market Share of Leading Companies, 2023
Table 3 Product Offerings of Leading Companies
Table 4 Low Growth Scenario Forecasts
Table 5 Reference Case Growth Scenario
Table 6 High Growth Case Scenario
Table 7 Global Soy Based Infant Formula Revenue (USD Million) And CAGR (%) By Type (2021-2032)
Table 8 Global Soy Based Infant Formula Revenue (USD Million) And CAGR (%) By Application (2021-2032)
Table 9 Global Soy Based Infant Formula Revenue (USD Million) And CAGR (%) By Product (2021-2032)
Table 10 Global Soy Based Infant Formula Market Revenue (USD Million) By Regions (2021-2032)
Table 11 Global Soy Based Infant Formula Market Share (%) By Regions (2021-2032)
Table 12 North America Soy Based Infant Formula Revenue (USD Million) By Country (2021-2032)
Table 13 Europe Soy Based Infant Formula Revenue (USD Million) By Country (2021-2032)
Table 14 Asia Pacific Soy Based Infant Formula Revenue (USD Million) By Country (2021-2032)
Table 15 South America Soy Based Infant Formula Revenue (USD Million) By Country (2021-2032)
Table 16 Middle East and Africa Soy Based Infant Formula Revenue (USD Million) By Region (2021-2032)
Table 17 North America Soy Based Infant Formula Revenue (USD Million) By Type (2021-2032)
Table 18 North America Soy Based Infant Formula Revenue (USD Million) By Application (2021-2032)
Table 19 North America Soy Based Infant Formula Revenue (USD Million) By Product (2021-2032)
Table 20 Europe Soy Based Infant Formula Revenue (USD Million) By Type (2021-2032)
Table 21 Europe Soy Based Infant Formula Revenue (USD Million) By Application (2021-2032)
Table 22 Europe Soy Based Infant Formula Revenue (USD Million) By Product (2021-2032)
Table 23 Asia Pacific Soy Based Infant Formula Revenue (USD Million) By Type (2021-2032)
Table 24 Asia Pacific Soy Based Infant Formula Revenue (USD Million) By Application (2021-2032)
Table 25 Asia Pacific Soy Based Infant Formula Revenue (USD Million) By Product (2021-2032)
Table 26 South America Soy Based Infant Formula Revenue (USD Million) By Type (2021-2032)
Table 27 South America Soy Based Infant Formula Revenue (USD Million) By Application (2021-2032)
Table 28 South America Soy Based Infant Formula Revenue (USD Million) By Product (2021-2032)
Table 29 Middle East and Africa Soy Based Infant Formula Revenue (USD Million) By Type (2021-2032)
Table 30 Middle East and Africa Soy Based Infant Formula Revenue (USD Million) By Application (2021-2032)
Table 31 Middle East and Africa Soy Based Infant Formula Revenue (USD Million) By Product (2021-2032)
LIST OF FIGURES
Figure 1. Market Scope
Figure 2. Pricing Forecasts Per Unit, 2023- 2032
Figure 3. Porter’s Five Forces
Figure 4. Global Soy Based Infant Formula Market Revenue (USD Million) By Regions (2021-2032)
Figure 5. Global Soy Based Infant Formula Market Share (%) By Regions (2023)
Figure 6. North America Soy Based Infant Formula Revenue (USD Million) By Country (2021-2032)
Figure 7. United States Soy Based Infant Formula Revenue (USD Million) By Country (2021-2032)
Figure 8. Canada Soy Based Infant Formula Revenue (USD Million) By Country (2021-2032)
Figure 9. Mexico Soy Based Infant Formula Revenue (USD Million) By Country (2021-2032)
Figure 10. Europe Soy Based Infant Formula Revenue (USD Million) By Country (2021-2032)
Figure 11. Germany Soy Based Infant Formula Revenue (USD Million) By Country (2021-2032)
Figure 12. France Soy Based Infant Formula Revenue (USD Million) By Country (2021-2032)
Figure 13. United Kingdom Soy Based Infant Formula Revenue (USD Million) By Country (2021-2032)
Figure 14. Spain Soy Based Infant Formula Revenue (USD Million) By Country (2021-2032)
Figure 15. Italy Soy Based Infant Formula Revenue (USD Million) By Country (2021-2032)
Figure 16. Russia Soy Based Infant Formula Revenue (USD Million) By Country (2021-2032)
Figure 17. Rest of Europe Soy Based Infant Formula Revenue (USD Million) By Country (2021-2032)
Figure 11. Asia Pacific Soy Based Infant Formula Revenue (USD Million) By Country (2021-2032)
Figure 12. China Soy Based Infant Formula Revenue (USD Million) By Country (2021-2032)
Figure 13. Japan Soy Based Infant Formula Revenue (USD Million) By Country (2021-2032)
Figure 14. India Soy Based Infant Formula Revenue (USD Million) By Country (2021-2032)
Figure 15. South Korea Soy Based Infant Formula Revenue (USD Million) By Country (2021-2032)
Figure 16. Australia Soy Based Infant Formula Revenue (USD Million) By Country (2021-2032)
Figure 17. South East Asia Soy Based Infant Formula Revenue (USD Million) By Country (2021-2032)
Figure 18. South America Soy Based Infant Formula Revenue (USD Million) By Country (2021-2032)
Figure 19. Brazil Soy Based Infant Formula Revenue (USD Million) By Country (2021-2032)
Figure 20. Argentina Soy Based Infant Formula Revenue (USD Million) By Country (2021-2032)
Figure 21. Rest of Asia Pacific Soy Based Infant Formula Revenue (USD Million) By Country (2021-2032)
Figure 22. Middle East and Africa Soy Based Infant Formula Revenue (USD Million) By Region (2021-2032)
Figure 23. Saudi Arabia Soy Based Infant Formula Revenue (USD Million) By Region (2021-2032)
Figure 24. The UAE Soy Based Infant Formula Revenue (USD Million) By Region (2021-2032)
Figure 25. Rest of Middle East Soy Based Infant Formula Revenue (USD Million) By Region (2021-2032)
Figure 26. South Africa Soy Based Infant Formula Revenue (USD Million) By Region (2021-2032)
Figure 27. Africa Soy Based Infant Formula Revenue (USD Million) By Region (2021-2032)
Figure 28. North America Soy Based Infant Formula Revenue (USD Million) By Type (2021-2032)
Figure 29. North America Soy Based Infant Formula Revenue (USD Million) By Application (2021-2032)
Figure 30. North America Soy Based Infant Formula Revenue (USD Million) By Product (2021-2032)
Figure 31. Europe Soy Based Infant Formula Revenue (USD Million) By Type (2021-2032)
Figure 32. Europe Soy Based Infant Formula Revenue (USD Million) By Application (2021-2032)
Figure 33. Europe Soy Based Infant Formula Revenue (USD Million) By Product (2021-2032)
Figure 34. Asia Pacific Soy Based Infant Formula Revenue (USD Million) By Type (2021-2032)
Figure 35. Asia Pacific Soy Based Infant Formula Revenue (USD Million) By Application (2021-2032)
Figure 36. Asia Pacific Soy Based Infant Formula Revenue (USD Million) By Product (2021-2032)
Figure 37. South America Soy Based Infant Formula Revenue (USD Million) By Type (2021-2032)
Figure 38. South America Soy Based Infant Formula Revenue (USD Million) By Application (2021-2032)
Figure 39. South America Soy Based Infant Formula Revenue (USD Million) By Product (2021-2032)
Figure 40. Middle East and Africa Soy Based Infant Formula Revenue (USD Million) By Type (2021-2032)
Figure 41. Middle East and Africa Soy Based Infant Formula Revenue (USD Million) By Application (2021-2032)
Figure 42. Middle East and Africa Soy Based Infant Formula Revenue (USD Million) By Product (2021-2032)
By Type
Low-Fat Soy-based Infant Formula
Whole-fat Soy-based Infant Formula
By Age Group
0 to 6 Months
12 to 36 Months
6 to 12 Months
Countries Analyzed
North America (US, Canada, Mexico)
Europe (Germany, UK, France, Spain, Italy, Russia, Rest of Europe)
Asia Pacific (China, India, Japan, South Korea, Australia, South East Asia, Rest of Asia)
South America (Brazil, Argentina, Rest of South America)
Middle East and Africa (Saudi Arabia, UAE, Rest of Middle East, South Africa, Egypt, Rest of Africa)
