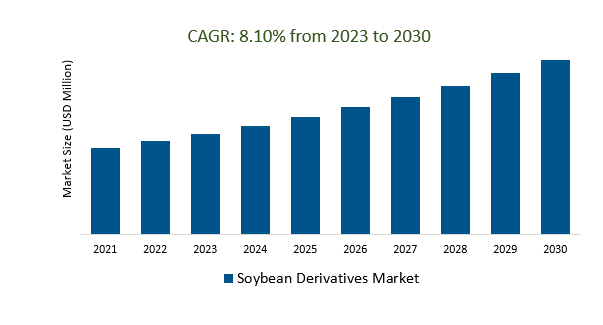
The Global Soybean Derivatives Market Size is estimated to register 8.1% growth over the forecast period from 2023 to 2030.
The Soybean Derivatives Market is influenced by various factors, including the growing global population, rising demand for plant-based protein, the livestock and poultry industries, and biodiesel production. The demand for soybean derivatives is driven by the growing demand for healthier and more sustainable diets, as well as the growing demand for non-GMO and organic products. Trade relations and tariffs also play a significant role in the market, as international trade policies can affect the flow of soybean products between countries, impacting prices and supply chains. Weather and crop conditions also play a role, with droughts and floods affecting soybean yields. Technological advancements are leading to improved soybean varieties with higher yields and desirable traits, such as resistance to pests and diseases. Health and wellness are also driving consumers to focus on plant-based diets, with soybean derivatives being incorporated into functional foods and dietary supplements.
Impact of Weather on Soybean Crop Conditions and Price Volatility is boosting the market.
The influence of weather patterns on soybean crop conditions has become a pivotal factor in the dynamics of the soybean derivatives market. As climate change continues to bring about unpredictable weather events, such as droughts and extreme temperature fluctuations, soybean crops are increasingly susceptible to yield variations. These fluctuations in crop output directly impact the supply of soybeans, leading to price volatility in the soybean derivatives market. Investors and traders are closely monitoring weather forecasts and crop reports to make informed decisions, resulting in heightened trading activity. This heightened market activity, driven by the weather-induced uncertainty surrounding soybean production, has significantly boosted the demand for soybean derivatives, making it an essential area for market participants seeking opportunities amid these evolving agricultural challenges.
The Surge in Plant-Based Protein Demand is attracting a wide customer base.
The surge in demand for plant-based protein sources has significantly impacted the soybean derivatives market, leading to a notable shift in consumer preferences. As more individuals embrace plant-based diets for health and environmental reasons, soybean-based products have gained popularity due to their rich protein content. This trend has attracted a diverse customer base, including vegans, vegetarians, health-conscious consumers, and those looking for sustainable alternatives to animal-based proteins. The soybean derivatives market has responded by offering a wide range of products, from soy milk and tofu to soy-based meat substitutes, catering to the growing demand for plant-based protein options. This trend is expected to continue as awareness of the benefits of soybean-derived proteins continues to spread.
Biodiesel Production and its Impact on the Soybean Oil Market is creating a demand in the market.
The production of biodiesel, a renewable and eco-friendly alternative to traditional fossil fuels, has been on the rise in recent years. This surge in biodiesel production has had a significant impact on the soybean oil market. Soybean oil is a crucial feedstock for biodiesel manufacturing due to its high oil content and favourable properties. As a result, there is a growing demand for soybean oil, which has led to increased prices and market activity. Furthermore, this uptick in demand for soybean oil has far-reaching effects on the soybean derivatives market. Various soybean derivatives such as soybean meal, used for animal feed, and soy lecithin, an emulsifier in food products, have also seen increased demand due to the higher production of soybean oil. This interconnectedness between biodiesel production and the soybean oil market underscores the importance of sustainable energy sources in shaping global agricultural markets. As the green energy sector continues to expand, we can expect further impacts on related markets like soybean derivatives.
Market Share Analysis:
Soybean oil, extracted from soybeans, holds a prominent position as the preeminent soybean derivative within global markets.
Soybean oil, a versatile and widely used cooking oil, is extracted from the soybean plant and plays a pivotal role in global markets. Its popularity is attributed to several factors. Firstly, it boasts a neutral flavour profile, making it ideal for a diverse range of culinary applications, from frying to salad dressings. Secondly, its high smoke point ensures it can withstand high-temperature cooking methods without breaking down or producing harmful compounds. Beyond the kitchen, soybean oil finds extensive use in various industrial sectors. It serves as a key ingredient in the production of biodiesel, offering an eco-friendly alternative to traditional fossil fuels. Additionally, soybean oil serves as a base for many cosmetics and skincare products, thanks to its moisturizing and emollient properties. Its widespread availability and economic importance make it a vital component of the agricultural and economic landscape, contributing to both global food security and sustainable energy solutions.
Water is the most dominant process in the soybean derivatives market.
Water plays a pivotal role in the soybean derivatives market, exerting its influence through multiple channels. First and foremost, water is crucial for the cultivation of soybeans themselves, as soybean plants require adequate hydration to grow and produce healthy yields. Additionally, water is an essential component in the extraction and processing of soybean derivatives, such as soybean oil and soybean meal. Furthermore, water is a key element in the transportation of soybeans from farms to processing facilities and then to various market destinations. Its availability and quality can significantly impact logistics and supply chain efficiency. Water scarcity or abundance in major soybean-producing regions can drive market sentiment and trade decisions. Moreover, water sustainability concerns and environmental regulations have begun to influence the soybean derivatives market. Companies are increasingly focusing on water-efficient and eco-friendly practices in response to consumer demand for environmentally responsible products.
Soybean Derivatives Market Segmentation
Type
- Soybean Oil
- Soy Flour
- Soy nuts
- Soy meals
- Soy protein
- Soy milk
Process
Application
By Region
- North America (United States, Canada, Mexico)
- Europe (Germany, France, United Kingdom, Spain, Italy, Others)
- Asia Pacific (China, India, Japan, South Korea, Australia, Others)
- Latin America (Brazil, Argentina, Others)
- Middle East and Africa (Saudi Arabia, UAE, Kuwait, Other Middle East, South Africa, Nigeria, Other Africa)
Soybean Derivatives Market Companies
- Bunge Limited
- CHS Inc
- Ruchi Soya Industries Limited
- AG Processing Inc
- DuPont Nutrition and Health
- Wilmar International Company
- Noble Group Ltd.
- Archer Daniels Midland Company
- Louis Dreyfus Commodities
- Cargill Inc
*List not exhaustive
Soybean Derivatives Market Outlook 2023
1 Market Overview
1.1 Introduction to the Soybean Derivatives Market
1.2 Scope of the Study
1.3 Research Objective
1.3.1 Key Market Scope and Segments
1.3.2 Players Covered
1.3.3 Years Considered
2 Executive Summary
2.1 2023 Soybean Derivatives Industry- Market Statistics
3 Market Dynamics
3.1 Market Drivers
3.2 Market Challenges
3.3 Market Opportunities
3.4 Market Trends
4 Market Factor Analysis
4.1 Porter’s Five Forces
4.2 Market Entropy
4.2.1 Global Soybean Derivatives Market Companies with Area Served
4.2.2 Products Offerings Global Soybean Derivatives Market
5 COVID-19 Impact Analysis and Outlook Scenarios
5.1.1 Covid-19 Impact Analysis
5.1.2 post-COVID-19 Scenario- Low Growth Case
5.1.3 post-COVID-19 Scenario- Reference Growth Case
5.1.4 post-COVID-19 Scenario- Low Growth Case
6 Global Soybean Derivatives Market Trends
6.1 Global Soybean Derivatives Revenue (USD Million) and CAGR (%) by Type (2018-2030)
6.2 Global Soybean Derivatives Revenue (USD Million) and CAGR (%) by Applications (2018-2030)
6.3 Global Soybean Derivatives Revenue (USD Million) and CAGR (%) by regions (2018-2030)
7 Global Soybean Derivatives Market Revenue (USD Million) by Type, and Applications (2018-2022)
7.1 Global Soybean Derivatives Revenue (USD Million) by Type (2018-2022)
7.1.1 Global Soybean Derivatives Revenue (USD Million), Market Share (%) by Type (2018-2022)
7.2 Global Soybean Derivatives Revenue (USD Million) by Applications (2018-2022)
7.2.1 Global Soybean Derivatives Revenue (USD Million), Market Share (%) by Applications (2018-2022)
8 Global Soybean Derivatives Development Regional Status and Outlook
8.1 Global Soybean Derivatives Revenue (USD Million) By Regions (2018-2022)
8.2 North America Soybean Derivatives Revenue (USD Million) by Type, and Application (2018-2022)
8.2.1 North America Soybean Derivatives Revenue (USD Million) by Country (2018-2022)
8.2.2 North America Soybean Derivatives Revenue (USD Million) by Type (2018-2022)
8.2.3 North America Soybean Derivatives Revenue (USD Million) by Applications (2018-2022)
8.3 Europe Soybean Derivatives Revenue (USD Million), by Type, and Applications (USD Million) (2018-2022)
8.3.1 Europe Soybean Derivatives Revenue (USD Million), by Country (2018-2022)
8.3.2 Europe Soybean Derivatives Revenue (USD Million) by Type (2018-2022)
8.3.3 Europe Soybean Derivatives Revenue (USD Million) by Applications (2018-2022)
8.4 Asia Pacific Soybean Derivatives Revenue (USD Million), and Revenue (USD Million) by Type, and Applications (2018-2022)
8.4.1 Asia Pacific Soybean Derivatives Revenue (USD Million) by Country (2018-2022)
8.4.2 Asia Pacific Soybean Derivatives Revenue (USD Million) by Type (2018-2022)
8.4.3 Asia Pacific Soybean Derivatives Revenue (USD Million) by Applications (2018-2022)
8.5 South America Soybean Derivatives Revenue (USD Million), by Type, and Applications (2018-2022)
8.5.1 South America Soybean Derivatives Revenue (USD Million), by Country (2018-2022)
8.5.2 South America Soybean Derivatives Revenue (USD Million) by Type (2018-2022)
8.5.3 South America Soybean Derivatives Revenue (USD Million) by Applications (2018-2022)
8.6 Middle East and Africa Soybean Derivatives Revenue (USD Million), by Type, Technology, Application, Thickness (2018-2022)
8.6.1 Middle East and Africa Soybean Derivatives Revenue (USD Million) by Country (2018-2022)
8.6.2 Middle East and Africa Soybean Derivatives Revenue (USD Million) by Type (2018-2022)
8.6.3 Middle East and Africa Soybean Derivatives Revenue (USD Million) by Applications (2018-2022)
9 Company Profiles
10 Global Soybean Derivatives Market Revenue (USD Million), by Type, and Applications (2023-2030)
10.1 Global Soybean Derivatives Revenue (USD Million) and Market Share (%) by Type (2023-2030)
10.1.1 Global Soybean Derivatives Revenue (USD Million), and Market Share (%) by Type (2023-2030)
10.2 Global Soybean Derivatives Revenue (USD Million) and Market Share (%) by Applications (2023-2030)
10.2.1 Global Soybean Derivatives Revenue (USD Million), and Market Share (%) by Applications (2023-2030)
11 Global Soybean Derivatives Development Regional Status and Outlook Forecast
11.1 Global Soybean Derivatives Revenue (USD Million) By Regions (2023-2030)
11.2 North America Soybean Derivatives Revenue (USD Million) by Type, and Applications (2023-2030)
11.2.1 North America Soybean Derivatives Revenue (USD) Million by Country (2023-2030)
11.2.2 North America Soybean Derivatives Revenue (USD Million), by Type (2023-2030)
11.2.3 North America Soybean Derivatives Revenue (USD Million), Market Share (%) by Applications (2023-2030)
11.3 Europe Soybean Derivatives Revenue (USD Million), by Type, and Applications (2023-2030)
11.3.1 Europe Soybean Derivatives Revenue (USD Million), by Country (2023-2030)
11.3.2 Europe Soybean Derivatives Revenue (USD Million), by Type (2023-2030)
11.3.3 Europe Soybean Derivatives Revenue (USD Million), by Applications (2023-2030)
11.4 Asia Pacific Soybean Derivatives Revenue (USD Million) by Type, and Applications (2023-2030)
11.4.1 Asia Pacific Soybean Derivatives Revenue (USD Million), by Country (2023-2030)
11.4.2 Asia Pacific Soybean Derivatives Revenue (USD Million), by Type (2023-2030)
11.4.3 Asia Pacific Soybean Derivatives Revenue (USD Million), by Applications (2023-2030)
11.5 South America Soybean Derivatives Revenue (USD Million), by Type, and Applications (2023-2030)
11.5.1 South America Soybean Derivatives Revenue (USD Million), by Country (2023-2030)
11.5.2 South America Soybean Derivatives Revenue (USD Million), by Type (2023-2030)
11.5.3 South America Soybean Derivatives Revenue (USD Million), by Applications (2023-2030)
11.6 Middle East and Africa Soybean Derivatives Revenue (USD Million), by Type, and Applications (2023-2030)
11.6.1 Middle East and Africa Soybean Derivatives Revenue (USD Million), by region (2023-2030)
11.6.2 Middle East and Africa Soybean Derivatives Revenue (USD Million), by Type (2023-2030)
11.6.3 Middle East and Africa Soybean Derivatives Revenue (USD Million), by Applications (2023-2030)
12 Methodology and Data Sources
12.1 Methodology/Research Approach
12.1.1 Research Programs/Design
12.1.2 Market Size Estimation
12.1.3 Market Breakdown and Data Triangulation
12.2 Data Sources
12.2.1 Secondary Sources
12.2.2 Primary Sources
12.3 Disclaimer
List of Tables
Table 1 Market Segmentation Analysis
Table 2 Global Soybean Derivatives Market Companies with Areas Served
Table 3 Products Offerings Global Soybean Derivatives Market
Table 4 Low Growth Scenario Forecasts
Table 5 Reference Case Growth Scenario
Table 6 High Growth Case Scenario
Table 7 Global Soybean Derivatives Revenue (USD Million) And CAGR (%) By Type (2018-2030)
Table 8 Global Soybean Derivatives Revenue (USD Million) And CAGR (%) By Applications (2018-2030)
Table 9 Global Soybean Derivatives Revenue (USD Million) And CAGR (%) By Regions (2018-2030)
Table 10 Global Soybean Derivatives Revenue (USD Million) By Type (2018-2022)
Table 11 Global Soybean Derivatives Revenue Market Share (%) By Type (2018-2022)
Table 12 Global Soybean Derivatives Revenue (USD Million) By Applications (2018-2022)
Table 13 Global Soybean Derivatives Revenue Market Share (%) By Applications (2018-2022)
Table 14 Global Soybean Derivatives Market Revenue (USD Million) By Regions (2018-2022)
Table 15 Global Soybean Derivatives Market Share (%) By Regions (2018-2022)
Table 16 North America Soybean Derivatives Revenue (USD Million) By Country (2018-2022)
Table 17 North America Soybean Derivatives Revenue (USD Million) By Type (2018-2022)
Table 18 North America Soybean Derivatives Revenue (USD Million) By Applications (2018-2022)
Table 19 Europe Soybean Derivatives Revenue (USD Million) By Country (2018-2022)
Table 20 Europe Soybean Derivatives Revenue (USD Million) By Type (2018-2022)
Table 21 Europe Soybean Derivatives Revenue (USD Million) By Applications (2018-2022)
Table 22 Asia Pacific Soybean Derivatives Revenue (USD Million) By Country (2018-2022)
Table 23 Asia Pacific Soybean Derivatives Revenue (USD Million) By Type (2018-2022)
Table 24 Asia Pacific Soybean Derivatives Revenue (USD Million) By Applications (2018-2022)
Table 25 South America Soybean Derivatives Revenue (USD Million) By Country (2018-2022)
Table 26 South America Soybean Derivatives Revenue (USD Million) By Type (2018-2022)
Table 27 South America Soybean Derivatives Revenue (USD Million) By Applications (2018-2022)
Table 28 Middle East and Africa Soybean Derivatives Revenue (USD Million) By Region (2018-2022)
Table 29 Middle East and Africa Soybean Derivatives Revenue (USD Million) By Type (2018-2022)
Table 30 Middle East and Africa Soybean Derivatives Revenue (USD Million) By Applications (2018-2022)
Table 31 Financial Analysis
Table 32 Global Soybean Derivatives Revenue (USD Million) By Type (2023-2030)
Table 33 Global Soybean Derivatives Revenue Market Share (%) By Type (2023-2030)
Table 34 Global Soybean Derivatives Revenue (USD Million) By Applications (2023-2030)
Table 35 Global Soybean Derivatives Revenue Market Share (%) By Applications (2023-2030)
Table 36 Global Soybean Derivatives Market Revenue (USD Million), And Revenue (USD Million) By Regions (2023-2030)
Table 37 North America Soybean Derivatives Revenue (USD)By Country (2023-2030)
Table 38 North America Soybean Derivatives Revenue (USD Million) By Type (2023-2030)
Table 39 North America Soybean Derivatives Revenue (USD Million) By Applications (2023-2030)
Table 40 Europe Soybean Derivatives Revenue (USD Million) By Country (2023-2030)
Table 41 Europe Soybean Derivatives Revenue (USD Million) By Type (2023-2030)
Table 42 Europe Soybean Derivatives Revenue (USD Million) By Applications (2023-2030)
Table 43 Asia Pacific Soybean Derivatives Revenue (USD Million) By Country (2023-2030)
Table 44 Asia Pacific Soybean Derivatives Revenue (USD Million) By Type (2023-2030)
Table 45 Asia Pacific Soybean Derivatives Revenue (USD Million) By Applications (2023-2030)
Table 46 South America Soybean Derivatives Revenue (USD Million) By Country (2023-2030)
Table 47 South America Soybean Derivatives Revenue (USD Million) By Type (2023-2030)
Table 48 South America Soybean Derivatives Revenue (USD Million) By Applications (2023-2030)
Table 49 Middle East and Africa Soybean Derivatives Revenue (USD Million) By Region (2023-2030)
Table 50 Middle East and Africa Soybean Derivatives Revenue (USD Million) By Region (2023-2030)
Table 51 Middle East and Africa Soybean Derivatives Revenue (USD Million) By Type (2023-2030)
Table 52 Middle East and Africa Soybean Derivatives Revenue (USD Million) By Applications (2023-2030)
Table 53 Research Programs/Design for This Report
Table 54 Key Data Information from Secondary Sources
Table 55 Key Data Information from Primary Sources
List of Figures
Figure 1 Market Scope
Figure 2 Porter’s Five Forces
Figure 3 Global Soybean Derivatives Revenue (USD Million) By Type (2018-2022)
Figure 4 Global Soybean Derivatives Revenue Market Share (%) By Type (2022)
Figure 5 Global Soybean Derivatives Revenue (USD Million) By Applications (2018-2022)
Figure 6 Global Soybean Derivatives Revenue Market Share (%) By Applications (2022)
Figure 7 Global Soybean Derivatives Market Revenue (USD Million) By Regions (2018-2022)
Figure 8 Global Soybean Derivatives Market Share (%) By Regions (2022)
Figure 9 North America Soybean Derivatives Revenue (USD Million) By Country (2018-2022)
Figure 10 North America Soybean Derivatives Revenue (USD Million) By Type (2018-2022)
Figure 11 North America Soybean Derivatives Revenue (USD Million) By Applications (2018-2022)
Figure 12 Europe Soybean Derivatives Revenue (USD Million) By Country (2018-2022)
Figure 13 Europe Soybean Derivatives Revenue (USD Million) By Type (2018-2022)
Figure 14 Europe Soybean Derivatives Revenue (USD Million) By Applications (2018-2022)
Figure 15 Asia Pacific Soybean Derivatives Revenue (USD Million) By Country (2018-2022)
Figure 16 Asia Pacific Soybean Derivatives Revenue (USD Million) By Type (2018-2022)
Figure 17 Asia Pacific Soybean Derivatives Revenue (USD Million) By Applications (2018-2022)
Figure 18 South America Soybean Derivatives Revenue (USD Million) By Country (2018-2022)
Figure 19 South America Soybean Derivatives Revenue (USD Million) By Type (2018-2022)
Figure 20 South America Soybean Derivatives Revenue (USD Million) By Applications (2018-2022)
Figure 21 Middle East and Africa Soybean Derivatives Revenue (USD Million) By Region (2018-2022)
Figure 22 Middle East and Africa Soybean Derivatives Revenue (USD Million) By Type (2018-2022)
Figure 23 Middle East and Africa Soybean Derivatives Revenue (USD Million) By Applications (2018-2022)
Figure 24 Global Soybean Derivatives Revenue (USD Million) By Type (2023-2030)
Figure 25 Global Soybean Derivatives Revenue Market Share (%) By Type (2030)
Figure 26 Global Soybean Derivatives Revenue (USD Million) By Applications (2023-2030)
Figure 27 Global Soybean Derivatives Revenue Market Share (%) By Applications (2030)
Figure 28 Global Soybean Derivatives Market Revenue (USD Million) By Regions (2023-2030)
Figure 29 North America Soybean Derivatives Revenue (USD Million) By Country (2023-2030)
Figure 30 North America Soybean Derivatives Revenue (USD Million) By Type (2023-2030)
Figure 31 North America Soybean Derivatives Revenue (USD Million) By Applications (2023-2030)
Figure 32 Europe Soybean Derivatives Revenue (USD Million) By Country (2023-2030)
Figure 33 Europe Soybean Derivatives Revenue (USD Million) By Type (2023-2030)
Figure 34 Europe Soybean Derivatives Revenue (USD Million) By Applications (2023-2030)
Figure 35 Asia Pacific Soybean Derivatives Revenue (USD Million) By Country (2023-2030)
Figure 36 Asia Pacific Soybean Derivatives Revenue (USD Million) By Type (2023-2030)
Figure 37 Asia Pacific Soybean Derivatives Revenue (USD Million) By Applications (2023-2030)
Figure 38 South America Soybean Derivatives Revenue (USD Million) By Country (2023-2030)
Figure 39 South America Soybean Derivatives Revenue (USD Million) By Type (2023-2030)
Figure 40 South America Soybean Derivatives Revenue (USD Million) By Applications (2023-2030)
Figure 41 Middle East and Africa Soybean Derivatives Revenue (USD Million) By Region (2023-2030)
Figure 42 Middle East and Africa Soybean Derivatives Revenue (USD Million) By Region (2023-2030)
Figure 43 Middle East and Africa Soybean Derivatives Revenue (USD Million) By Type (2023-2030)
Figure 44 Middle East and Africa Soybean Derivatives Revenue (USD Million) By Applications (2023-2030)
Figure 45 Bottom-Up and Top-Down Approaches for This Report
Figure 46 Data Triangulation
