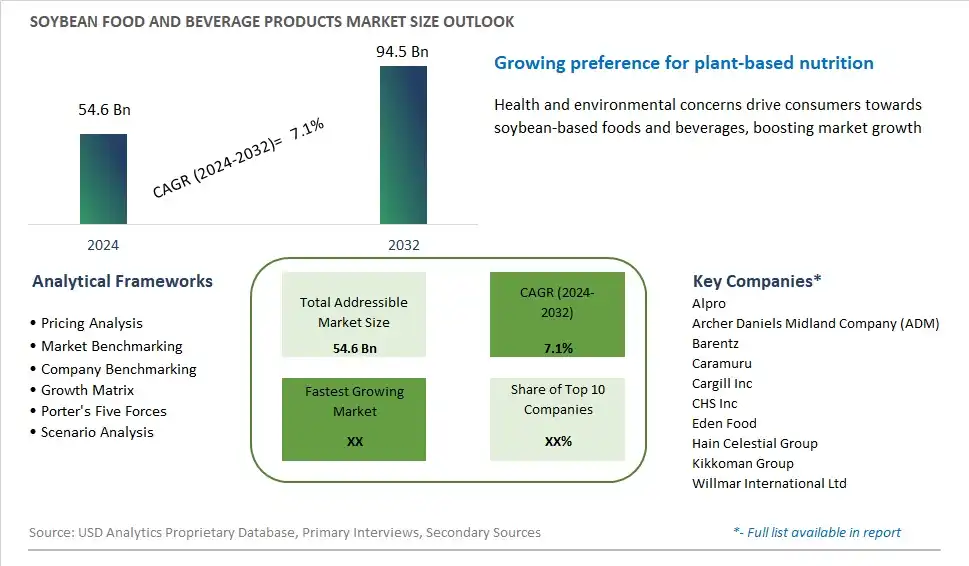
Global Soybean Food and Beverage Products Market Size is valued at $54.6 Billion in 2024 and is forecast to register a growth rate (CAGR) of 7.1% to reach $94.5 Billion by 2032.
The global Soybean Food and Beverage Products Market Comprehensive Study analyzes and forecasts the market size across 6 regions and 24 countries for diverse segments -By Type (Soybean Food Products, Soybean Additives/Ingredients, Soybean Oil), By Source (Bakery & Confectionery, Animal Feed, Dairy Products, Functional Food & Supplements, Meat Products, Infant Foods, Others), By Application (GM, Non-GM/GE), By Distribution Channel (Supermarkets/Hypermarkets, Specialty Stores, Online, Others)
An Introduction to Soybean Food and Beverage Products Market
Soybean food and beverage products encompass a diverse range of products made from soybeans, including tofu, soy milk, tempeh, soy sauce, and soy-based meat and dairy alternatives in 2024. Soybeans are highly nutritious legumes rich in protein, fiber, vitamins, and minerals, making them a popular ingredient in vegetarian and vegan diets as well as in traditional Asian cuisines. Soybean products are valued for their versatility, nutritional profile, and culinary appeal, offering plant-based alternatives to meat, dairy, and other animal-derived foods. With increasing consumer interest in plant-based diets, sustainable agriculture, and functional foods, the market for soybean food and beverage products is expanding, driven by innovations in product formulations, processing techniques, and packaging formats that deliver convenient, nutritious, and delicious soy-based options to meet diverse dietary preferences and lifestyle choices.
Soybean Food and Beverage Products Competitive Landscape
The market report analyses the leading companies in the industry including Alpro, Archer Daniels Midland Company (ADM), Barentz, Caramuru, Cargill Inc, CHS Inc, Eden Food, Hain Celestial Group, Kikkoman Group, Willmar International Ltd, and Others.
Soybean Food and Beverage Products Market Dynamics
Soybean Food and Beverage Products Market Trend: Rising Preference for Plant-Based Diets
A prominent market trend for soybean food and beverage products is the rising preference for plant-based diets. As consumers become increasingly health-conscious and environmentally aware, there has been a notable shift towards plant-based eating patterns. Soybeans, being a versatile and nutritious legume, are gaining traction as a key ingredient in plant-based food and beverage products. This trend is driven by various factors, including concerns about animal welfare, sustainability, and the perceived health benefits of consuming more plant-based foods. As a result, there is growing demand for soy-based alternatives to traditional animal-derived products, such as dairy milk, meat, and snacks, leading to an expansion of soybean-based food and beverage offerings in the market.
Market Driver: Health and Wellness Awareness
A significant market driver for soybean food and beverage products is the increasing awareness of health and wellness among consumers. Soybeans are recognized for their nutritional value, as they are rich sources of protein, fiber, vitamins, minerals, and beneficial phytochemicals. With rising concerns about obesity, chronic diseases, and overall well-being, consumers are actively seeking healthier food and beverage options. Soy-based products are perceived as wholesome and nutritious choices that can contribute to a balanced diet and support various health goals, including weight management, heart health, and diabetes prevention. The growing emphasis on clean label ingredients and natural, minimally processed foods further drives the demand for soybean-based products as healthier alternatives to conventional options.
Market Opportunity: Product Innovation and Diversification
An opportunity within the soybean food and beverage market lies in product innovation and diversification. With the increasing popularity of plant-based eating, there is ample opportunity for companies to develop innovative soybean-based products that cater to evolving consumer preferences and dietary needs. This includes creating new formulations, flavors, and formats for soy-based beverages, dairy alternatives, meat substitutes, snacks, and baked goods. Additionally, there is potential to target specific consumer segments, such as athletes, vegetarians, vegans, and individuals with food allergies or intolerances, by offering tailored soybean-based solutions that meet their unique nutritional requirements. By investing in research and development and leveraging consumer insights, companies can capitalize on the growing demand for soybean food and beverage products and gain a competitive edge in the market.
Soybean Food and Beverage Products Market Share Analysis: Soybean Food Products held the dominant market share in 2024
Within the Soybean Food and Beverage Products Market, the segment encompassing soybean food products is the largest. This predominance is primarily due to the widespread consumption and diverse applications of soy-based foods across various cuisines and cultures globally. Soybean food products, such as tofu, tempeh, soy milk, and soy-based meat alternatives, offer a rich source of plant-based protein, essential amino acids, and various nutrients, making them popular choices among consumers seeking nutritious and sustainable dietary options. Further, the growing prevalence of vegetarianism, veganism, and flexitarian diets, driven by health and environmental concerns, further propels the demand for soybean food products. Additionally, the versatility of soybean-based ingredients in food processing enables the creation of a wide array of innovative and flavorful food products, catering to evolving consumer preferences for taste, convenience, and health-conscious choices. As the trend towards plant-based diets continues to gain momentum, the soybean food products segment is expected to maintain its leadership position in the market, with sustained growth anticipated in the foreseeable future.
Soybean Food and Beverage Products Market Share Analysis: Functional Food & Supplements market is poised to register the fastest growth rae over the forecast period to 2032
The Functional Food & Supplements segment stands out as the fastest-growing category within the soybean food and beverage products market. This surge in growth can be attributed to several key factors. Firstly, there has been a notable shift in consumer preferences towards healthier dietary choices, driven by increasing health consciousness and awareness of the nutritional benefits of soy-based products. Functional foods and supplements fortified with soybean extracts offer a wealth of health benefits, including improved heart health, cholesterol regulation, and weight management, thereby appealing to a growing demographic of health-conscious consumers. Additionally, technological advancements in food processing techniques have enabled the development of innovative soy-based formulations that enhance the nutritional profile and flavor of functional foods and supplements, further driving consumer adoption. Further, the rising prevalence of chronic diseases and lifestyle-related health concerns has spurred demand for functional foods and supplements enriched with bioactive compounds found in soybeans, such as isoflavones and omega-3 fatty acids, known for their potential health-promoting properties. With increasing research and development activities focused on enhancing the efficacy and functionality of soy-based ingredients, the Functional Food & Supplements segment is poised for continued robust growth, presenting lucrative opportunities for market players to capitalize on the burgeoning demand for health-enhancing food and beverage products.
Soybean Food and Beverage Products Market Share Analysis: Non-GM/GE held the dominant market share in 2024
The Non-GM/GE segment is the largest category within the soybean food and beverage products market, and several factors contribute to its dominance. Firstly, there has been a growing consumer preference for non-genetically modified (Non-GM) or genetically engineered (GE) soybean products due to concerns regarding potential health and environmental impacts associated with GM crops. Consumers increasingly seek products perceived as natural and free from genetic modifications, driving demand for Non-GM/GE soybean-based foods and beverages. Additionally, stringent regulatory frameworks and labeling requirements mandating the disclosure of GM ingredients further bolster consumer awareness and preference for Non-GM/GE options. Further, the Non-GM/GE segment resonates with the broader clean label and sustainability trends, aligning with consumers' desires for transparency, authenticity, and ethical sourcing practices. As a result, food and beverage manufacturers are increasingly formulating products with Non-GM/GE soybean ingredients to meet evolving consumer preferences and capitalize on the growing market demand. With consumers placing greater emphasis on product quality, safety, and ethical considerations, the Non-GM/GE segment is poised to maintain its position as the largest segment within the soybean food and beverage products market, presenting significant growth opportunities for industry stakeholders.
Soybean Food and Beverage Products Market Segmentation
By Type
Soybean Food Products
Soybean Additives/Ingredients
Soybean Oil
By Source
Bakery & Confectionery
Animal Feed
Dairy Products
Functional Food & Supplements
Meat Products
Infant Foods
Others
By Application
GM
Non-GM/GE
By Distribution Channel
Supermarkets/Hypermarkets
Specialty Stores
Online
Others
Countries Analyzed
North America (US, Canada, Mexico)
Europe (Germany, UK, France, Spain, Italy, Russia, Rest of Europe)
Asia Pacific (China, India, Japan, South Korea, Australia, South East Asia, Rest of Asia)
South America (Brazil, Argentina, Rest of South America)
Middle East and Africa (Saudi Arabia, UAE, Rest of Middle East, South Africa, Egypt, Rest of Africa)
Soybean Food and Beverage Products Companies Profiled in the Study
Alpro
Archer Daniels Midland Company (ADM)
Barentz
Caramuru
Cargill Inc
CHS Inc
Eden Food
Hain Celestial Group
Kikkoman Group
Willmar International Ltd
*- List Not Exhaustive
Chapter 1. TABLE OF CONTENTS
Chapter 2. Introduction to Soybean Food and Beverage Products Market
2.1. Market Overview
2.2. Key Statistics and Report Highlights
2.3. Scope of the Comprehensive Study
2.3.1. Market Definition
2.3.2 Countries and Regions Covered
2.3.3 Research Objective
2.3.4 Units, Currency, and Conversions
2.3.5 Industry Value Chain
2.4. Key Market Segments
2.5. Key Companies
2.6. Study Period
Chapter 3. Strategic Analysis Review
3.1. Soybean Food and Beverage Products Pricing Analysis and Forecast
3.2. Porter’s Five Forces
3.3. Market Ecosystem
3.4. SWOT Analysis
3.5. Regulatory Scenario
3.3. Effects of Inflation, Russia-Ukraine War, moderating economic growth, and other macroeconomic factors
Chapter 4. Competitive Landscape
4.1. Market Share Analysis
4.1.1. Global Soybean Food and Beverage Products Market Share by Company, 2023
4.1.2. Product Offerings of Leading Soybean Food and Beverage Products Companies
4.2. Market Entropy
4.2.1. New Product Launches in the Industry
4.2.2. Mergers, Acquisitions, Joint ventures, and Partnerships
4.3. Key Strategies and Best Practices
Chapter 5. Global Market Projections: Best, Reference, and Low Case Scenarios
5.1. Growth Analysis- Case Scenario Definitions
5.2. Low Growth Case Scenario Forecasts
5.3. Reference Growth Case Scenario Forecasts
5.4. High Growth Case Scenario Forecasts
Chapter 6. Market Dynamics
6.1. Soybean Food and Beverage Products Market Drivers
6.2. Soybean Food and Beverage Products Market Challenges
6.6. Soybean Food and Beverage Products Market Opportunities
6.4. Soybean Food and Beverage Products Market Trends
Chapter 7. Global Soybean Food and Beverage Products Market Outlook Trends
7.1. Global Soybean Food and Beverage Products Revenue (USD Million) and CAGR (%) by Type (2021-2032)
7.2. Global Soybean Food and Beverage Products Revenue (USD Million) and CAGR (%) by Application (2021-2032)
7.3. Global Soybean Food and Beverage Products Revenue (USD Million) and CAGR (%) by Product (2021-2032)
By Type
Soybean Food Products
Soybean Additives/Ingredients
Soybean Oil
By Source
Bakery & Confectionery
Animal Feed
Dairy Products
Functional Food & Supplements
Meat Products
Infant Foods
Others
By Application
GM
Non-GM/GE
By Distribution Channel
Supermarkets/Hypermarkets
Specialty Stores
Online
Others
Chapter 8. Global Soybean Food and Beverage Products Regional Analysis and Outlook
8.1. Global Soybean Food and Beverage Products Revenue (USD Million) By Regions (2021- 2032)
8.2. North America Soybean Food and Beverage Products Revenue (USD Million) by Country (2021-2032)
8.2.1. United States Soybean Food and Beverage Products Regional Analysis and Outlook
8.2.2. Canada Soybean Food and Beverage Products Regional Analysis and Outlook
8.2.3. Mexico Soybean Food and Beverage Products Regional Analysis and Outlook
8.3. Europe Soybean Food and Beverage Products Revenue (USD Million), by Country (2021-2032)
8.3.1. Germany Soybean Food and Beverage Products Regional Analysis and Outlook
8.3.2. France Soybean Food and Beverage Products Regional Analysis and Outlook
8.3.3. United Kingdom Soybean Food and Beverage Products Regional Analysis and Outlook
8.3.4. Spain Soybean Food and Beverage Products Regional Analysis and Outlook
8.3.5. Italy Soybean Food and Beverage Products Regional Analysis and Outlook
8.3.6. Russia Soybean Food and Beverage Products Regional Analysis and Outlook
8.3.7. Rest of Europe Soybean Food and Beverage Products Regional Analysis and Outlook
8.4. Asia Pacific Soybean Food and Beverage Products Revenue (USD Million) by Country (2021-2032)
8.4.1. China Soybean Food and Beverage Products Regional Analysis and Outlook
8.4.2. Japan Soybean Food and Beverage Products Regional Analysis and Outlook
8.4.3. India Soybean Food and Beverage Products Regional Analysis and Outlook
8.4.4. South Korea Soybean Food and Beverage Products Regional Analysis and Outlook
8.4.5. Australia Soybean Food and Beverage Products Regional Analysis and Outlook
8.4.6. South East Asia Soybean Food and Beverage Products Regional Analysis and Outlook
8.4.7. Rest of Asia Pacific Soybean Food and Beverage Products Regional Analysis and Outlook
8.5. South America Soybean Food and Beverage Products Revenue (USD Million), by Country (2021-2032)
8.5.1. Brazil Soybean Food and Beverage Products Regional Analysis and Outlook
8.5.2. Argentina Soybean Food and Beverage Products Regional Analysis and Outlook
8.5.3. Rest of South America Soybean Food and Beverage Products Regional Analysis and Outlook
8.6. Middle East and Africa Soybean Food and Beverage Products Revenue (USD Million) by Country (2021-2032)
8.6.1. Middle East Soybean Food and Beverage Products Regional Analysis and Outlook
8.6.2. Africa Soybean Food and Beverage Products Regional Analysis and Outlook
Chapter 9. North America Soybean Food and Beverage Products Analysis and Outlook
9.1. North America Soybean Food and Beverage Products Revenue (USD Million) by Segments (2021-2032)
9.1.1. North America Soybean Food and Beverage Products Revenue (USD Million) by Type (2021-2032)
9.1.2. North America Soybean Food and Beverage Products Revenue (USD Million) by Application (2021-2032)
9.1.3. North America Soybean Food and Beverage Products Revenue (USD Million) by Product (2021-2032)
By Type
Soybean Food Products
Soybean Additives/Ingredients
Soybean Oil
By Source
Bakery & Confectionery
Animal Feed
Dairy Products
Functional Food & Supplements
Meat Products
Infant Foods
Others
By Application
GM
Non-GM/GE
By Distribution Channel
Supermarkets/Hypermarkets
Specialty Stores
Online
Others
Chapter 10. Europe Soybean Food and Beverage Products Analysis and Outlook
10.1. Europe Soybean Food and Beverage Products Revenue (USD Million), by Segments (USD Million) (2021-2032)
10.1.1. Europe Soybean Food and Beverage Products Revenue (USD Million) by Type (2021-2032)
10.1.2. Europe Soybean Food and Beverage Products Revenue (USD Million) by Application (2021-2032)
10.1.3. Europe Soybean Food and Beverage Products Revenue (USD Million) by Product (2021-2032)
By Type
Soybean Food Products
Soybean Additives/Ingredients
Soybean Oil
By Source
Bakery & Confectionery
Animal Feed
Dairy Products
Functional Food & Supplements
Meat Products
Infant Foods
Others
By Application
GM
Non-GM/GE
By Distribution Channel
Supermarkets/Hypermarkets
Specialty Stores
Online
Others
Chapter 11. Asia Pacific Soybean Food and Beverage Products Analysis and Outlook
11.1. Asia Pacific Soybean Food and Beverage Products Revenue (USD Million), and Revenue (USD Million) by Segments (2021-2032)
11.1.1. Asia Pacific Soybean Food and Beverage Products Revenue (USD Million) by Type (2021-2032)
11.1.2. Asia Pacific Soybean Food and Beverage Products Revenue (USD Million) by Application (2021-2032)
11.1.3. Asia Pacific Soybean Food and Beverage Products Revenue (USD Million) by Product (2021-2032)
By Type
Soybean Food Products
Soybean Additives/Ingredients
Soybean Oil
By Source
Bakery & Confectionery
Animal Feed
Dairy Products
Functional Food & Supplements
Meat Products
Infant Foods
Others
By Application
GM
Non-GM/GE
By Distribution Channel
Supermarkets/Hypermarkets
Specialty Stores
Online
Others
Chapter 12. South America Soybean Food and Beverage Products Analysis and Outlook
12.1. South America Soybean Food and Beverage Products Revenue (USD Million), by Segments (2021-2032)
12.1.1. South America Soybean Food and Beverage Products Revenue (USD Million) by Type (2021-2032)
12.1.2. South America Soybean Food and Beverage Products Revenue (USD Million) by Application (2021-2032)
12.1.3. South America Soybean Food and Beverage Products Revenue (USD Million) by Product (2021-2032)
By Type
Soybean Food Products
Soybean Additives/Ingredients
Soybean Oil
By Source
Bakery & Confectionery
Animal Feed
Dairy Products
Functional Food & Supplements
Meat Products
Infant Foods
Others
By Application
GM
Non-GM/GE
By Distribution Channel
Supermarkets/Hypermarkets
Specialty Stores
Online
Others
Chapter 13. Middle East and Africa Soybean Food and Beverage Products Analysis and Outlook
13.1. Middle East and Africa Soybean Food and Beverage Products Revenue (USD Million), by Segments (2021-2032)
13.1.1. Middle East and Africa Soybean Food and Beverage Products Revenue (USD Million) by Type (2021-2032)
13.1.2. Middle East and Africa Soybean Food and Beverage Products Revenue (USD Million) by Application (2021-2032)
13.1.3. Middle East and Africa Soybean Food and Beverage Products Revenue (USD Million) by Product (2021-2032)
By Type
Soybean Food Products
Soybean Additives/Ingredients
Soybean Oil
By Source
Bakery & Confectionery
Animal Feed
Dairy Products
Functional Food & Supplements
Meat Products
Infant Foods
Others
By Application
GM
Non-GM/GE
By Distribution Channel
Supermarkets/Hypermarkets
Specialty Stores
Online
Others
Chapter 14. Soybean Food and Beverage Products Company Profiles
14.1 Business Overview
14.2 Product Profiles
14.3 SWOT Profiles
14.5 Recent Developments
14.6 Financial Profile
List of Companies
Alpro
Archer Daniels Midland Company (ADM)
Barentz
Caramuru
Cargill Inc
CHS Inc
Eden Food
Hain Celestial Group
Kikkoman Group
Willmar International Ltd
15. Methodology and Data Sources
15.1 Customization Offerings
15.2 Subscription Services
15.3 Related Reports
15.4 Publisher Expertise
LIST OF TABLES
Table 1 Market Segmentation Analysis
Table 2 Global Soybean Food and Beverage Products Market Share of Leading Companies, 2023
Table 3 Product Offerings of Leading Companies
Table 4 Low Growth Scenario Forecasts
Table 5 Reference Case Growth Scenario
Table 6 High Growth Case Scenario
Table 7 Global Soybean Food and Beverage Products Revenue (USD Million) And CAGR (%) By Type (2021-2032)
Table 8 Global Soybean Food and Beverage Products Revenue (USD Million) And CAGR (%) By Application (2021-2032)
Table 9 Global Soybean Food and Beverage Products Revenue (USD Million) And CAGR (%) By Product (2021-2032)
Table 10 Global Soybean Food and Beverage Products Market Revenue (USD Million) By Regions (2021-2032)
Table 11 Global Soybean Food and Beverage Products Market Share (%) By Regions (2021-2032)
Table 12 North America Soybean Food and Beverage Products Revenue (USD Million) By Country (2021-2032)
Table 13 Europe Soybean Food and Beverage Products Revenue (USD Million) By Country (2021-2032)
Table 14 Asia Pacific Soybean Food and Beverage Products Revenue (USD Million) By Country (2021-2032)
Table 15 South America Soybean Food and Beverage Products Revenue (USD Million) By Country (2021-2032)
Table 16 Middle East and Africa Soybean Food and Beverage Products Revenue (USD Million) By Region (2021-2032)
Table 17 North America Soybean Food and Beverage Products Revenue (USD Million) By Type (2021-2032)
Table 18 North America Soybean Food and Beverage Products Revenue (USD Million) By Application (2021-2032)
Table 19 North America Soybean Food and Beverage Products Revenue (USD Million) By Product (2021-2032)
Table 20 Europe Soybean Food and Beverage Products Revenue (USD Million) By Type (2021-2032)
Table 21 Europe Soybean Food and Beverage Products Revenue (USD Million) By Application (2021-2032)
Table 22 Europe Soybean Food and Beverage Products Revenue (USD Million) By Product (2021-2032)
Table 23 Asia Pacific Soybean Food and Beverage Products Revenue (USD Million) By Type (2021-2032)
Table 24 Asia Pacific Soybean Food and Beverage Products Revenue (USD Million) By Application (2021-2032)
Table 25 Asia Pacific Soybean Food and Beverage Products Revenue (USD Million) By Product (2021-2032)
Table 26 South America Soybean Food and Beverage Products Revenue (USD Million) By Type (2021-2032)
Table 27 South America Soybean Food and Beverage Products Revenue (USD Million) By Application (2021-2032)
Table 28 South America Soybean Food and Beverage Products Revenue (USD Million) By Product (2021-2032)
Table 29 Middle East and Africa Soybean Food and Beverage Products Revenue (USD Million) By Type (2021-2032)
Table 30 Middle East and Africa Soybean Food and Beverage Products Revenue (USD Million) By Application (2021-2032)
Table 31 Middle East and Africa Soybean Food and Beverage Products Revenue (USD Million) By Product (2021-2032)
LIST OF FIGURES
Figure 1. Market Scope
Figure 2. Pricing Forecasts Per Unit, 2023- 2032
Figure 3. Porter’s Five Forces
Figure 4. Global Soybean Food and Beverage Products Market Revenue (USD Million) By Regions (2021-2032)
Figure 5. Global Soybean Food and Beverage Products Market Share (%) By Regions (2023)
Figure 6. North America Soybean Food and Beverage Products Revenue (USD Million) By Country (2021-2032)
Figure 7. United States Soybean Food and Beverage Products Revenue (USD Million) By Country (2021-2032)
Figure 8. Canada Soybean Food and Beverage Products Revenue (USD Million) By Country (2021-2032)
Figure 9. Mexico Soybean Food and Beverage Products Revenue (USD Million) By Country (2021-2032)
Figure 10. Europe Soybean Food and Beverage Products Revenue (USD Million) By Country (2021-2032)
Figure 11. Germany Soybean Food and Beverage Products Revenue (USD Million) By Country (2021-2032)
Figure 12. France Soybean Food and Beverage Products Revenue (USD Million) By Country (2021-2032)
Figure 13. United Kingdom Soybean Food and Beverage Products Revenue (USD Million) By Country (2021-2032)
Figure 14. Spain Soybean Food and Beverage Products Revenue (USD Million) By Country (2021-2032)
Figure 15. Italy Soybean Food and Beverage Products Revenue (USD Million) By Country (2021-2032)
Figure 16. Russia Soybean Food and Beverage Products Revenue (USD Million) By Country (2021-2032)
Figure 17. Rest of Europe Soybean Food and Beverage Products Revenue (USD Million) By Country (2021-2032)
Figure 11. Asia Pacific Soybean Food and Beverage Products Revenue (USD Million) By Country (2021-2032)
Figure 12. China Soybean Food and Beverage Products Revenue (USD Million) By Country (2021-2032)
Figure 13. Japan Soybean Food and Beverage Products Revenue (USD Million) By Country (2021-2032)
Figure 14. India Soybean Food and Beverage Products Revenue (USD Million) By Country (2021-2032)
Figure 15. South Korea Soybean Food and Beverage Products Revenue (USD Million) By Country (2021-2032)
Figure 16. Australia Soybean Food and Beverage Products Revenue (USD Million) By Country (2021-2032)
Figure 17. South East Asia Soybean Food and Beverage Products Revenue (USD Million) By Country (2021-2032)
Figure 18. South America Soybean Food and Beverage Products Revenue (USD Million) By Country (2021-2032)
Figure 19. Brazil Soybean Food and Beverage Products Revenue (USD Million) By Country (2021-2032)
Figure 20. Argentina Soybean Food and Beverage Products Revenue (USD Million) By Country (2021-2032)
Figure 21. Rest of Asia Pacific Soybean Food and Beverage Products Revenue (USD Million) By Country (2021-2032)
Figure 22. Middle East and Africa Soybean Food and Beverage Products Revenue (USD Million) By Region (2021-2032)
Figure 23. Saudi Arabia Soybean Food and Beverage Products Revenue (USD Million) By Region (2021-2032)
Figure 24. The UAE Soybean Food and Beverage Products Revenue (USD Million) By Region (2021-2032)
Figure 25. Rest of Middle East Soybean Food and Beverage Products Revenue (USD Million) By Region (2021-2032)
Figure 26. South Africa Soybean Food and Beverage Products Revenue (USD Million) By Region (2021-2032)
Figure 27. Africa Soybean Food and Beverage Products Revenue (USD Million) By Region (2021-2032)
Figure 28. North America Soybean Food and Beverage Products Revenue (USD Million) By Type (2021-2032)
Figure 29. North America Soybean Food and Beverage Products Revenue (USD Million) By Application (2021-2032)
Figure 30. North America Soybean Food and Beverage Products Revenue (USD Million) By Product (2021-2032)
Figure 31. Europe Soybean Food and Beverage Products Revenue (USD Million) By Type (2021-2032)
Figure 32. Europe Soybean Food and Beverage Products Revenue (USD Million) By Application (2021-2032)
Figure 33. Europe Soybean Food and Beverage Products Revenue (USD Million) By Product (2021-2032)
Figure 34. Asia Pacific Soybean Food and Beverage Products Revenue (USD Million) By Type (2021-2032)
Figure 35. Asia Pacific Soybean Food and Beverage Products Revenue (USD Million) By Application (2021-2032)
Figure 36. Asia Pacific Soybean Food and Beverage Products Revenue (USD Million) By Product (2021-2032)
Figure 37. South America Soybean Food and Beverage Products Revenue (USD Million) By Type (2021-2032)
Figure 38. South America Soybean Food and Beverage Products Revenue (USD Million) By Application (2021-2032)
Figure 39. South America Soybean Food and Beverage Products Revenue (USD Million) By Product (2021-2032)
Figure 40. Middle East and Africa Soybean Food and Beverage Products Revenue (USD Million) By Type (2021-2032)
Figure 41. Middle East and Africa Soybean Food and Beverage Products Revenue (USD Million) By Application (2021-2032)
Figure 42. Middle East and Africa Soybean Food and Beverage Products Revenue (USD Million) By Product (2021-2032)
By Type
Soybean Food Products
Soybean Additives/Ingredients
Soybean Oil
By Source
Bakery & Confectionery
Animal Feed
Dairy Products
Functional Food & Supplements
Meat Products
Infant Foods
Others
By Application
GM
Non-GM/GE
By Distribution Channel
Supermarkets/Hypermarkets
Specialty Stores
Online
Others
Countries Analyzed
North America (US, Canada, Mexico)
Europe (Germany, UK, France, Spain, Italy, Russia, Rest of Europe)
Asia Pacific (China, India, Japan, South Korea, Australia, South East Asia, Rest of Asia)
South America (Brazil, Argentina, Rest of South America)
Middle East and Africa (Saudi Arabia, UAE, Rest of Middle East, South Africa, Egypt, Rest of Africa)
