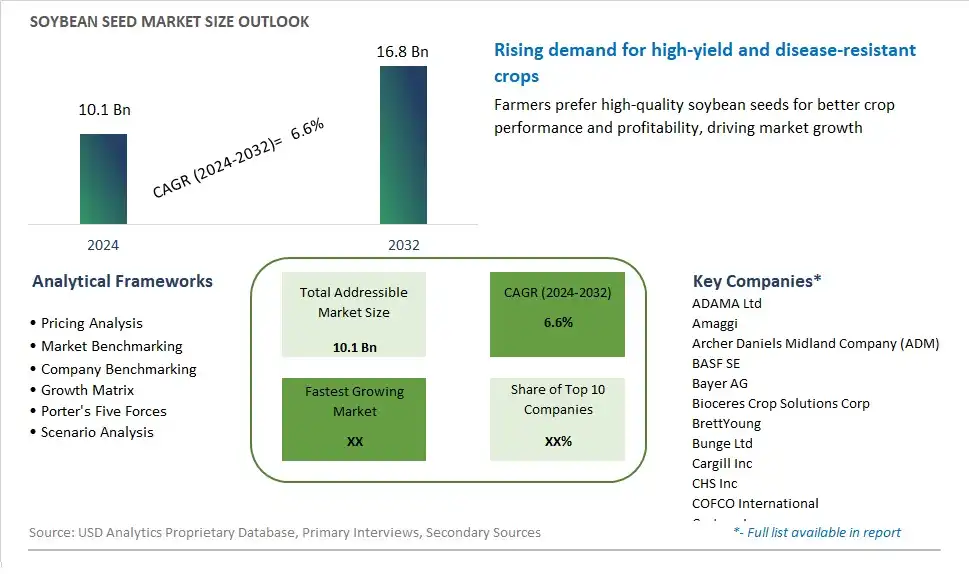
Global Soybean Seed Market Size is valued at $10.1 Billion in 2024 and is forecast to register a growth rate (CAGR) of 6.6% to reach $16.8 Billion by 2032.
The global Soybean Seed Market Comprehensive Study analyzes and forecasts the market size across 6 regions and 24 countries for diverse segments -By Breeding Technology (Hybrids, Open Pollinated Varieties & Hybrid Derivatives), By Type (Genetically modified, Non-genetically modified), By Distribution Channel (Offline, Online)
An Introduction to Soybean Seed Market
The soybean seed market in 2024 is experiencing robust growth, driven by the increasing demand for soybeans in food, feed, and industrial applications. Soybean seeds are essential for producing high-quality crops that are rich in protein and oil. The market is characterized by advancements in seed technology, including genetically modified and hybrid seeds that offer improved yield, disease resistance, and environmental adaptability. The growing trend towards sustainable and organic farming practices is also influencing market dynamics, with a rising demand for non-GMO and certified organic seeds. Major producers are investing in research and development to create innovative seed varieties that meet the needs of diverse agricultural conditions and consumer preferences.
Soybean Seed Competitive Landscape
The market report analyses the leading companies in the industry including ADAMA Ltd, Amaggi, Archer Daniels Midland Company (ADM), BASF SE, Bayer AG, Bioceres Crop Solutions Corp, BrettYoung, Bunge Ltd, Cargill Inc, CHS Inc, COFCO International, Corteva Inc, House Foods Group Inc, KWS SAAT SE and Co. KGaA, Limagrain, Olam Group Ltd, Sinochem Group Co. Ltd, The Scoular Co., UPL Ltd, Wilmar International Ltd , and Others.
Soybean Seed Market Dynamics
Market Trend: Adoption of Genetically Modified (GM) Soybean Seeds
The most prominent trend in the Soybean Seed Market is the adoption of genetically modified (GM) soybean seeds. Farmers are increasingly opting for GM seeds due to their enhanced traits, such as herbicide resistance and pest resistance, which improve crop yields and reduce the need for chemical inputs. This trend is driven by the need for more efficient and sustainable agricultural practices to meet the growing demand for soybeans
Market Driver: Increasing Demand for Soybean Products
The increasing demand for soybean products is a major driver of the Soybean Seed Market. Soybeans are a versatile crop used in various industries, including food and beverage, animal feed, and biofuels. The growing popularity of plant-based diets and the need for high-protein animal feed are driving the demand for soybeans, leading to increased cultivation and the adoption of high-yield soybean seeds
Market Opportunity: Expansion into Emerging Markets
A significant opportunity in the Soybean Seed Market lies in the expansion into emerging markets. Regions such as Asia-Pacific, Latin America, and Africa are experiencing rising populations and increasing agricultural activity. By introducing high-quality soybean seeds and providing support to local farmers, companies can tap into these growing markets and drive global soybean production
Soybean Seed Market Share Analysis: Dominating the Soybean Seed Market held the dominant market share in 2024
Among the various breeding technologies in the soybean seed market, transgenic hybrids emerge as the largest segment, and this dominance can be attributed to several key factors. Transgenic hybrids offer enhanced traits such as resistance to pests and diseases, improved yield potential, and tolerance to environmental stresses, which significantly appeal to farmers seeking higher productivity and profitability. The adoption of transgenic hybrids has been widespread globally due to their proven effectiveness in addressing agricultural challenges and ensuring consistent crop performance. Additionally, the advancements in biotechnology and genetic engineering have facilitated the development of transgenic hybrids with tailored traits, further augmenting their appeal to farmers. With the continuous emphasis on increasing agricultural productivity to meet the growing food demand, transgenic hybrids remain the preferred choice for many farmers, thus solidifying their position as the largest segment in the soybean seed market.
Soybean Seed Market Share Analysis: Spearheading Rapid Growth in the Soybean Seed market is poised to register the fastest growth rae over the forecast period to 2032
The genetically modified (GM) seeds segment within the soybean seed market stands out as the fastest-growing sector, propelled by several compelling factors. GM seeds offer numerous advantages such as increased yield potential, enhanced resistance to pests and diseases, and tolerance to herbicides, which collectively contribute to improved crop productivity and profitability for farmers. Additionally, GM soybean seeds enable more efficient weed management practices, reducing the need for labor-intensive weed control measures and promoting sustainable agricultural practices. The widespread adoption of GM soybean seeds is driven by the pressing need to meet the escalating global demand for food amidst dwindling arable land and environmental challenges. Furthermore, advancements in biotechnology continue to expand the range of traits available in GM seeds, further bolstering their appeal to farmers seeking innovative solutions to optimize crop production. As the demand for high-performing and sustainable agricultural inputs continues to rise, the GM seeds segment is poised to maintain its rapid growth trajectory in the soybean seed market.
Soybean Seed Market Share Analysis: Leading the Soybean Seed Market held the dominant market share in 2024
Among the distribution channels in the soybean seed market, offline channels emerge as the largest segment, driven by several key factors. Offline channels encompass a wide array of traditional distribution methods such as agricultural input stores, seed dealers, and cooperatives, which have established strong networks and relationships within farming communities over the years. Farmers often rely on these offline channels for their seed procurement needs due to the convenience of face-to-face interactions, personalized recommendations, and immediate access to products. Further, offline channels offer a tangible shopping experience, allowing farmers to assess product quality and make informed purchasing decisions based on firsthand observations. Additionally, in many regions, especially in rural areas where reliable internet access may be limited, offline channels remain the primary avenue for seed procurement. As a result, the entrenched presence and accessibility of offline distribution channels position them as the largest segment in the soybean seed market.
Soybean Seed Market Segmentation
By Breeding Technology
Hybrids
-Non-Transgenic Hybrids
-Transgenic Hybrids
Open Pollinated Varieties & Hybrid Derivatives
By Type
Genetically modified
Non-genetically modified
By Distribution Channel
Offline
Online
Countries Analyzed
North America (US, Canada, Mexico)
Europe (Germany, UK, France, Spain, Italy, Russia, Rest of Europe)
Asia Pacific (China, India, Japan, South Korea, Australia, South East Asia, Rest of Asia)
South America (Brazil, Argentina, Rest of South America)
Middle East and Africa (Saudi Arabia, UAE, Rest of Middle East, South Africa, Egypt, Rest of Africa)
Soybean Seed Companies Profiled in the Study
ADAMA Ltd
Amaggi
Archer Daniels Midland Company (ADM)
BASF SE
Bayer AG
Bioceres Crop Solutions Corp
BrettYoung
Bunge Ltd
Cargill Inc
CHS Inc
COFCO International
Corteva Inc
House Foods Group Inc
KWS SAAT SE and Co. KGaA
Limagrain
Olam Group Ltd
Sinochem Group Co. Ltd
The Scoular Co.
UPL Ltd
Wilmar International Ltd
*- List Not Exhaustive
Chapter 1. TABLE OF CONTENTS
Chapter 2. Introduction to Soybean Seed Market
2.1. Market Overview
2.2. Key Statistics and Report Highlights
2.3. Scope of the Comprehensive Study
2.3.1. Market Definition
2.3.2 Countries and Regions Covered
2.3.3 Research Objective
2.3.4 Units, Currency, and Conversions
2.3.5 Industry Value Chain
2.4. Key Market Segments
2.5. Key Companies
2.6. Study Period
Chapter 3. Strategic Analysis Review
3.1. Soybean Seed Pricing Analysis and Forecast
3.2. Porter’s Five Forces
3.3. Market Ecosystem
3.4. SWOT Analysis
3.5. Regulatory Scenario
3.3. Effects of Inflation, Russia-Ukraine War, moderating economic growth, and other macroeconomic factors
Chapter 4. Competitive Landscape
4.1. Market Share Analysis
4.1.1. Global Soybean Seed Market Share by Company, 2023
4.1.2. Product Offerings of Leading Soybean Seed Companies
4.2. Market Entropy
4.2.1. New Product Launches in the Industry
4.2.2. Mergers, Acquisitions, Joint ventures, and Partnerships
4.3. Key Strategies and Best Practices
Chapter 5. Global Market Projections: Best, Reference, and Low Case Scenarios
5.1. Growth Analysis- Case Scenario Definitions
5.2. Low Growth Case Scenario Forecasts
5.3. Reference Growth Case Scenario Forecasts
5.4. High Growth Case Scenario Forecasts
Chapter 6. Market Dynamics
6.1. Soybean Seed Market Drivers
6.2. Soybean Seed Market Challenges
6.6. Soybean Seed Market Opportunities
6.4. Soybean Seed Market Trends
Chapter 7. Global Soybean Seed Market Outlook Trends
7.1. Global Soybean Seed Revenue (USD Million) and CAGR (%) by Type (2021-2032)
7.2. Global Soybean Seed Revenue (USD Million) and CAGR (%) by Application (2021-2032)
7.3. Global Soybean Seed Revenue (USD Million) and CAGR (%) by Product (2021-2032)
By Breeding Technology
Hybrids
-Non-Transgenic Hybrids
-Transgenic Hybrids
Open Pollinated Varieties & Hybrid Derivatives
By Type
Genetically modified
Non-genetically modified
By Distribution Channel
Offline
Online
Chapter 8. Global Soybean Seed Regional Analysis and Outlook
8.1. Global Soybean Seed Revenue (USD Million) By Regions (2021- 2032)
8.2. North America Soybean Seed Revenue (USD Million) by Country (2021-2032)
8.2.1. United States Soybean Seed Regional Analysis and Outlook
8.2.2. Canada Soybean Seed Regional Analysis and Outlook
8.2.3. Mexico Soybean Seed Regional Analysis and Outlook
8.3. Europe Soybean Seed Revenue (USD Million), by Country (2021-2032)
8.3.1. Germany Soybean Seed Regional Analysis and Outlook
8.3.2. France Soybean Seed Regional Analysis and Outlook
8.3.3. United Kingdom Soybean Seed Regional Analysis and Outlook
8.3.4. Spain Soybean Seed Regional Analysis and Outlook
8.3.5. Italy Soybean Seed Regional Analysis and Outlook
8.3.6. Russia Soybean Seed Regional Analysis and Outlook
8.3.7. Rest of Europe Soybean Seed Regional Analysis and Outlook
8.4. Asia Pacific Soybean Seed Revenue (USD Million) by Country (2021-2032)
8.4.1. China Soybean Seed Regional Analysis and Outlook
8.4.2. Japan Soybean Seed Regional Analysis and Outlook
8.4.3. India Soybean Seed Regional Analysis and Outlook
8.4.4. South Korea Soybean Seed Regional Analysis and Outlook
8.4.5. Australia Soybean Seed Regional Analysis and Outlook
8.4.6. South East Asia Soybean Seed Regional Analysis and Outlook
8.4.7. Rest of Asia Pacific Soybean Seed Regional Analysis and Outlook
8.5. South America Soybean Seed Revenue (USD Million), by Country (2021-2032)
8.5.1. Brazil Soybean Seed Regional Analysis and Outlook
8.5.2. Argentina Soybean Seed Regional Analysis and Outlook
8.5.3. Rest of South America Soybean Seed Regional Analysis and Outlook
8.6. Middle East and Africa Soybean Seed Revenue (USD Million) by Country (2021-2032)
8.6.1. Middle East Soybean Seed Regional Analysis and Outlook
8.6.2. Africa Soybean Seed Regional Analysis and Outlook
Chapter 9. North America Soybean Seed Analysis and Outlook
9.1. North America Soybean Seed Revenue (USD Million) by Segments (2021-2032)
9.1.1. North America Soybean Seed Revenue (USD Million) by Type (2021-2032)
9.1.2. North America Soybean Seed Revenue (USD Million) by Application (2021-2032)
9.1.3. North America Soybean Seed Revenue (USD Million) by Product (2021-2032)
By Breeding Technology
Hybrids
-Non-Transgenic Hybrids
-Transgenic Hybrids
Open Pollinated Varieties & Hybrid Derivatives
By Type
Genetically modified
Non-genetically modified
By Distribution Channel
Offline
Online
Chapter 10. Europe Soybean Seed Analysis and Outlook
10.1. Europe Soybean Seed Revenue (USD Million), by Segments (USD Million) (2021-2032)
10.1.1. Europe Soybean Seed Revenue (USD Million) by Type (2021-2032)
10.1.2. Europe Soybean Seed Revenue (USD Million) by Application (2021-2032)
10.1.3. Europe Soybean Seed Revenue (USD Million) by Product (2021-2032)
By Breeding Technology
Hybrids
-Non-Transgenic Hybrids
-Transgenic Hybrids
Open Pollinated Varieties & Hybrid Derivatives
By Type
Genetically modified
Non-genetically modified
By Distribution Channel
Offline
Online
Chapter 11. Asia Pacific Soybean Seed Analysis and Outlook
11.1. Asia Pacific Soybean Seed Revenue (USD Million), and Revenue (USD Million) by Segments (2021-2032)
11.1.1. Asia Pacific Soybean Seed Revenue (USD Million) by Type (2021-2032)
11.1.2. Asia Pacific Soybean Seed Revenue (USD Million) by Application (2021-2032)
11.1.3. Asia Pacific Soybean Seed Revenue (USD Million) by Product (2021-2032)
By Breeding Technology
Hybrids
-Non-Transgenic Hybrids
-Transgenic Hybrids
Open Pollinated Varieties & Hybrid Derivatives
By Type
Genetically modified
Non-genetically modified
By Distribution Channel
Offline
Online
Chapter 12. South America Soybean Seed Analysis and Outlook
12.1. South America Soybean Seed Revenue (USD Million), by Segments (2021-2032)
12.1.1. South America Soybean Seed Revenue (USD Million) by Type (2021-2032)
12.1.2. South America Soybean Seed Revenue (USD Million) by Application (2021-2032)
12.1.3. South America Soybean Seed Revenue (USD Million) by Product (2021-2032)
By Breeding Technology
Hybrids
-Non-Transgenic Hybrids
-Transgenic Hybrids
Open Pollinated Varieties & Hybrid Derivatives
By Type
Genetically modified
Non-genetically modified
By Distribution Channel
Offline
Online
Chapter 13. Middle East and Africa Soybean Seed Analysis and Outlook
13.1. Middle East and Africa Soybean Seed Revenue (USD Million), by Segments (2021-2032)
13.1.1. Middle East and Africa Soybean Seed Revenue (USD Million) by Type (2021-2032)
13.1.2. Middle East and Africa Soybean Seed Revenue (USD Million) by Application (2021-2032)
13.1.3. Middle East and Africa Soybean Seed Revenue (USD Million) by Product (2021-2032)
By Breeding Technology
Hybrids
-Non-Transgenic Hybrids
-Transgenic Hybrids
Open Pollinated Varieties & Hybrid Derivatives
By Type
Genetically modified
Non-genetically modified
By Distribution Channel
Offline
Online
Chapter 14. Soybean Seed Company Profiles
14.1 Business Overview
14.2 Product Profiles
14.3 SWOT Profiles
14.5 Recent Developments
14.6 Financial Profile
List of Companies
ADAMA Ltd
Amaggi
Archer Daniels Midland Company (ADM)
BASF SE
Bayer AG
Bioceres Crop Solutions Corp
BrettYoung
Bunge Ltd
Cargill Inc
CHS Inc
COFCO International
Corteva Inc
House Foods Group Inc
KWS SAAT SE and Co. KGaA
Limagrain
Olam Group Ltd
Sinochem Group Co. Ltd
The Scoular Co.
UPL Ltd
Wilmar International Ltd
15. Methodology and Data Sources
15.1 Customization Offerings
15.2 Subscription Services
15.3 Related Reports
15.4 Publisher Expertise
LIST OF TABLES
Table 1 Market Segmentation Analysis
Table 2 Global Soybean Seed Market Share of Leading Companies, 2023
Table 3 Product Offerings of Leading Companies
Table 4 Low Growth Scenario Forecasts
Table 5 Reference Case Growth Scenario
Table 6 High Growth Case Scenario
Table 7 Global Soybean Seed Revenue (USD Million) And CAGR (%) By Type (2021-2032)
Table 8 Global Soybean Seed Revenue (USD Million) And CAGR (%) By Application (2021-2032)
Table 9 Global Soybean Seed Revenue (USD Million) And CAGR (%) By Product (2021-2032)
Table 10 Global Soybean Seed Market Revenue (USD Million) By Regions (2021-2032)
Table 11 Global Soybean Seed Market Share (%) By Regions (2021-2032)
Table 12 North America Soybean Seed Revenue (USD Million) By Country (2021-2032)
Table 13 Europe Soybean Seed Revenue (USD Million) By Country (2021-2032)
Table 14 Asia Pacific Soybean Seed Revenue (USD Million) By Country (2021-2032)
Table 15 South America Soybean Seed Revenue (USD Million) By Country (2021-2032)
Table 16 Middle East and Africa Soybean Seed Revenue (USD Million) By Region (2021-2032)
Table 17 North America Soybean Seed Revenue (USD Million) By Type (2021-2032)
Table 18 North America Soybean Seed Revenue (USD Million) By Application (2021-2032)
Table 19 North America Soybean Seed Revenue (USD Million) By Product (2021-2032)
Table 20 Europe Soybean Seed Revenue (USD Million) By Type (2021-2032)
Table 21 Europe Soybean Seed Revenue (USD Million) By Application (2021-2032)
Table 22 Europe Soybean Seed Revenue (USD Million) By Product (2021-2032)
Table 23 Asia Pacific Soybean Seed Revenue (USD Million) By Type (2021-2032)
Table 24 Asia Pacific Soybean Seed Revenue (USD Million) By Application (2021-2032)
Table 25 Asia Pacific Soybean Seed Revenue (USD Million) By Product (2021-2032)
Table 26 South America Soybean Seed Revenue (USD Million) By Type (2021-2032)
Table 27 South America Soybean Seed Revenue (USD Million) By Application (2021-2032)
Table 28 South America Soybean Seed Revenue (USD Million) By Product (2021-2032)
Table 29 Middle East and Africa Soybean Seed Revenue (USD Million) By Type (2021-2032)
Table 30 Middle East and Africa Soybean Seed Revenue (USD Million) By Application (2021-2032)
Table 31 Middle East and Africa Soybean Seed Revenue (USD Million) By Product (2021-2032)
LIST OF FIGURES
Figure 1. Market Scope
Figure 2. Pricing Forecasts Per Unit, 2023- 2032
Figure 3. Porter’s Five Forces
Figure 4. Global Soybean Seed Market Revenue (USD Million) By Regions (2021-2032)
Figure 5. Global Soybean Seed Market Share (%) By Regions (2023)
Figure 6. North America Soybean Seed Revenue (USD Million) By Country (2021-2032)
Figure 7. United States Soybean Seed Revenue (USD Million) By Country (2021-2032)
Figure 8. Canada Soybean Seed Revenue (USD Million) By Country (2021-2032)
Figure 9. Mexico Soybean Seed Revenue (USD Million) By Country (2021-2032)
Figure 10. Europe Soybean Seed Revenue (USD Million) By Country (2021-2032)
Figure 11. Germany Soybean Seed Revenue (USD Million) By Country (2021-2032)
Figure 12. France Soybean Seed Revenue (USD Million) By Country (2021-2032)
Figure 13. United Kingdom Soybean Seed Revenue (USD Million) By Country (2021-2032)
Figure 14. Spain Soybean Seed Revenue (USD Million) By Country (2021-2032)
Figure 15. Italy Soybean Seed Revenue (USD Million) By Country (2021-2032)
Figure 16. Russia Soybean Seed Revenue (USD Million) By Country (2021-2032)
Figure 17. Rest of Europe Soybean Seed Revenue (USD Million) By Country (2021-2032)
Figure 11. Asia Pacific Soybean Seed Revenue (USD Million) By Country (2021-2032)
Figure 12. China Soybean Seed Revenue (USD Million) By Country (2021-2032)
Figure 13. Japan Soybean Seed Revenue (USD Million) By Country (2021-2032)
Figure 14. India Soybean Seed Revenue (USD Million) By Country (2021-2032)
Figure 15. South Korea Soybean Seed Revenue (USD Million) By Country (2021-2032)
Figure 16. Australia Soybean Seed Revenue (USD Million) By Country (2021-2032)
Figure 17. South East Asia Soybean Seed Revenue (USD Million) By Country (2021-2032)
Figure 18. South America Soybean Seed Revenue (USD Million) By Country (2021-2032)
Figure 19. Brazil Soybean Seed Revenue (USD Million) By Country (2021-2032)
Figure 20. Argentina Soybean Seed Revenue (USD Million) By Country (2021-2032)
Figure 21. Rest of Asia Pacific Soybean Seed Revenue (USD Million) By Country (2021-2032)
Figure 22. Middle East and Africa Soybean Seed Revenue (USD Million) By Region (2021-2032)
Figure 23. Saudi Arabia Soybean Seed Revenue (USD Million) By Region (2021-2032)
Figure 24. The UAE Soybean Seed Revenue (USD Million) By Region (2021-2032)
Figure 25. Rest of Middle East Soybean Seed Revenue (USD Million) By Region (2021-2032)
Figure 26. South Africa Soybean Seed Revenue (USD Million) By Region (2021-2032)
Figure 27. Africa Soybean Seed Revenue (USD Million) By Region (2021-2032)
Figure 28. North America Soybean Seed Revenue (USD Million) By Type (2021-2032)
Figure 29. North America Soybean Seed Revenue (USD Million) By Application (2021-2032)
Figure 30. North America Soybean Seed Revenue (USD Million) By Product (2021-2032)
Figure 31. Europe Soybean Seed Revenue (USD Million) By Type (2021-2032)
Figure 32. Europe Soybean Seed Revenue (USD Million) By Application (2021-2032)
Figure 33. Europe Soybean Seed Revenue (USD Million) By Product (2021-2032)
Figure 34. Asia Pacific Soybean Seed Revenue (USD Million) By Type (2021-2032)
Figure 35. Asia Pacific Soybean Seed Revenue (USD Million) By Application (2021-2032)
Figure 36. Asia Pacific Soybean Seed Revenue (USD Million) By Product (2021-2032)
Figure 37. South America Soybean Seed Revenue (USD Million) By Type (2021-2032)
Figure 38. South America Soybean Seed Revenue (USD Million) By Application (2021-2032)
Figure 39. South America Soybean Seed Revenue (USD Million) By Product (2021-2032)
Figure 40. Middle East and Africa Soybean Seed Revenue (USD Million) By Type (2021-2032)
Figure 41. Middle East and Africa Soybean Seed Revenue (USD Million) By Application (2021-2032)
Figure 42. Middle East and Africa Soybean Seed Revenue (USD Million) By Product (2021-2032)
By Breeding Technology
Hybrids
-Non-Transgenic Hybrids
-Transgenic Hybrids
Open Pollinated Varieties & Hybrid Derivatives
By Type
Genetically modified
Non-genetically modified
By Distribution Channel
Offline
Online
Countries Analyzed
North America (US, Canada, Mexico)
Europe (Germany, UK, France, Spain, Italy, Russia, Rest of Europe)
Asia Pacific (China, India, Japan, South Korea, Australia, South East Asia, Rest of Asia)
South America (Brazil, Argentina, Rest of South America)
Middle East and Africa (Saudi Arabia, UAE, Rest of Middle East, South Africa, Egypt, Rest of Africa)
