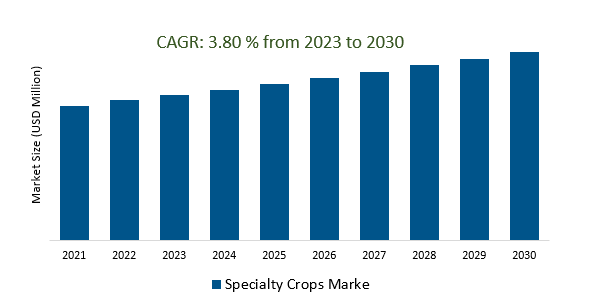
The Global Specialty Crops Market Size is estimated to register 3.8% growth over the forecast period from 2023 to 2030.
The Specialty Crops Market is influenced by various drivers and trends, including consumer demand for health and wellness, diverse culinary preferences, local and sustainable agriculture, organic and non-GMO preferences, economic and population growth, global trade and export opportunities, climate change, and alternative protein sources. Health and wellness consumers are increasingly seeking organic fruits and vegetables, while diverse culinary preferences are gaining popularity. Local and sustainable agriculture is also gaining traction, as consumers are concerned about the environmental impact of their food choices. Organic and non-GMO crops are sought after by environmentally conscious consumers. Economic growth and population growth in some regions lead to increased consumption of specialty crops, while global trade and export opportunities create opportunities for producers. Climate change and weather variability can affect the availability and quality of specialty crops, leading to price fluctuations and supply challenges.
The Rise of Specialty Crops like Organic Fruits and Vegetables is boosting the market.
The agricultural landscape is witnessing a significant transformation with the remarkable rise of specialty crops, particularly organic fruits and vegetables. This surge is injecting fresh vigor into the specialty crops market, driven by an increasing consumer demand for healthier and more sustainable food choices. Consumers are increasingly prioritizing organic produce due to its perceived health benefits and reduced environmental impact. Farmers and growers are responding to this demand by diversifying their crops and adopting organic farming practices, which further propels the specialty crops market. Additionally, the awareness of the importance of sustainable agriculture and the reduction of chemical pesticide usage is driving this shift towards specialty crops. As these trends continue to gain momentum, the specialty crops market is poised for continued growth, offering both economic opportunities for farmers and a more health-conscious food supply for consumers.
Indoor Farming and Controlled Environment Agriculture in Urban Areas is creating a demand in the market.
The rise of indoor farming and controlled environment agriculture in urban areas is revolutionizing the agriculture industry. This innovative approach involves growing crops in precisely controlled conditions, such as temperature, humidity, and lighting, within indoor facilities. It is gaining popularity due to its numerous benefits, including year-round production, reduced water usage, and minimal pesticide requirements. As a result, the specialty crops market is experiencing increased demand. Specialty crops, which include gourmet herbs, exotic fruits, and rare vegetables, are particularly suited for indoor cultivation. Consumers are drawn to the quality, consistency, and availability of these specialty crops, making them a lucrative niche in the urban agriculture sector. This trend not only ensures a more sustainable and efficient food production system but also opens up exciting opportunities for urban farmers and entrepreneurs alike.
The Rising Demand for Exotic Specialty Crops in Diverse Culinary Preferences is attracting a wide range of customers.
The specialty crops market is experiencing a surge in popularity due to the rising demand for exotic and unique produce. This trend is driven by increasingly diverse culinary preferences among consumers, who are eager to explore new flavors and ingredients in their cooking. As a result, a wide range of customers, from food enthusiasts to chefs and home cooks, are flocking to the specialty crops market to access these rare and distinctive offerings. This growing demand is not only broadening the market's customer base but also encouraging farmers and growers to diversify their crop selections, leading to a vibrant and dynamic industry that caters to the evolving tastes of modern consumers. Overall, the specialty crops market is thriving as it meets the needs of a diverse and adventurous food culture.
Market Share Analysis:
Fruits are the most dominant specialty crop type.
Fruits hold a distinguished status in the world of agriculture, standing out as the most dominant specialty crop type. Their significance is multifaceted, both economically and nutritionally. From the vibrant hues of apples to the tropical allure of bananas, fruits are a cornucopia of flavours and colours that cater to diverse palates worldwide. They contribute substantially to global agricultural revenue, playing a pivotal role in the livelihoods of countless farmers. Beyond their economic impact, fruits are a powerhouse of essential nutrients, vitamins, and antioxidants. They form an integral part of a balanced diet, promoting health and well-being. Fruits also hold cultural and symbolic importance in many societies, often associated with festivals and traditions. Their versatility in culinary applications, from desserts to savory dishes, further highlights their significance in global cuisine. In essence, fruits, with their economic, nutritional, and cultural contributions, stand as the undisputed champions among specialty crops, enriching our lives in countless ways.
Dairy products stand out as the undisputed frontrunners in the specialty crops market.
With the wide array of offerings, including milk, cheese, yogurt, and butter, they not only satiate our taste buds but also drive significant economic activity. Dairy farming, characterized by its rich history and tradition, plays a pivotal role in both rural and urban landscapes. The dairy industry serves as a cornerstone of the agricultural sector, offering stability and employment opportunities to countless individuals. Its products are versatile, finding their way into a multitude of culinary delights, from creamy pastries to Savory dishes. Additionally, the health-conscious consumer base continually seeks dairy alternatives, opening doors for innovation and diversification within the market. Furthermore, the global reach of dairy products ensures that they remain at the forefront of international trade, making them an essential commodity in the modern food industry. As consumer preferences evolve and sustainability concerns gain traction, the dairy market adapts, demonstrating its resilience and adaptability. Thus, dairy products maintain their dominance, promising a creamy future in the specialty crops arena.
Conventional specialty crops currently dominate the specialty crops market in comparison to organic counterparts.
Firstly, organic specialty crop production is costlier as it prohibits the use of synthetic pesticides, herbicides, and fertilizers. Secondly, organic crops tend to yield lower harvests because organic farmers rely on natural methods for pest and disease control. Additionally, limited consumer awareness and a reluctance to pay a premium for organic specialty crops have hindered their market penetration. Nevertheless, the organic specialty crops sector is experiencing rapid growth, propelled by increasing consumer awareness of the advantages of organic food and a rising preference for healthier dietary choices.
Specialty Crops Market Segmentation
Type
- Fruits
- Vegetables
- Tree Nuts
- Herbs And Spices
- Others
Application
- Dairy Products
- Bakery
- Juices
- Nectars and Fruit-Based Drinks
- Confectionery
- Soups
- Sauces and Dressings
- Others
Product
By Region
- North America (United States, Canada, Mexico)
- Europe (Germany, France, United Kingdom, Spain, Italy, Others)
- Asia Pacific (China, India, Japan, South Korea, Australia, Others)
- Latin America (Brazil, Argentina, Others)
- Middle East and Africa (Saudi Arabia, UAE, Kuwait, Other Middle East, South Africa, Nigeria, Other Africa)
Specialty Crops Market Companies
- DIAMOND FRUIT CO.
- Harbor Spice Co., Inc.
- Olam International
- Oregon Spice Company
- The Specialty Crop Company.
- BanaBay Limited
- Rice Fruit Company
- Fisher Nut Company
- Simped Foods Pty Ltd.
- SVZ Industrial Fruit & Vegetable Ingredients
*List not exhaustive
Specialty Crops Market Outlook 2023
1 Market Overview
1.1 Introduction to the Specialty Crops Market
1.2 Scope of the Study
1.3 Research Objective
1.3.1 Key Market Scope and Segments
1.3.2 Players Covered
1.3.3 Years Considered
2 Executive Summary
2.1 2023 Specialty Crops Industry- Market Statistics
3 Market Dynamics
3.1 Market Drivers
3.2 Market Challenges
3.3 Market Opportunities
3.4 Market Trends
4 Market Factor Analysis
4.1 Porter’s Five Forces
4.2 Market Entropy
4.2.1 Global Specialty Crops Market Companies with Area Served
4.2.2 Products Offerings Global Specialty Crops Market
5 COVID-19 Impact Analysis and Outlook Scenarios
5.1.1 Covid-19 Impact Analysis
5.1.2 post-COVID-19 Scenario- Low Growth Case
5.1.3 post-COVID-19 Scenario- Reference Growth Case
5.1.4 post-COVID-19 Scenario- Low Growth Case
6 Global Specialty Crops Market Trends
6.1 Global Specialty Crops Revenue (USD Million) and CAGR (%) by Type (2018-2030)
6.2 Global Specialty Crops Revenue (USD Million) and CAGR (%) by Applications (2018-2030)
6.3 Global Specialty Crops Revenue (USD Million) and CAGR (%) by regions (2018-2030)
7 Global Specialty Crops Market Revenue (USD Million) by Type, and Applications (2018-2022)
7.1 Global Specialty Crops Revenue (USD Million) by Type (2018-2022)
7.1.1 Global Specialty Crops Revenue (USD Million), Market Share (%) by Type (2018-2022)
7.2 Global Specialty Crops Revenue (USD Million) by Applications (2018-2022)
7.2.1 Global Specialty Crops Revenue (USD Million), Market Share (%) by Applications (2018-2022)
8 Global Specialty Crops Development Regional Status and Outlook
8.1 Global Specialty Crops Revenue (USD Million) By Regions (2018-2022)
8.2 North America Specialty Crops Revenue (USD Million) by Type, and Application (2018-2022)
8.2.1 North America Specialty Crops Revenue (USD Million) by Country (2018-2022)
8.2.2 North America Specialty Crops Revenue (USD Million) by Type (2018-2022)
8.2.3 North America Specialty Crops Revenue (USD Million) by Applications (2018-2022)
8.3 Europe Specialty Crops Revenue (USD Million), by Type, and Applications (USD Million) (2018-2022)
8.3.1 Europe Specialty Crops Revenue (USD Million), by Country (2018-2022)
8.3.2 Europe Specialty Crops Revenue (USD Million) by Type (2018-2022)
8.3.3 Europe Specialty Crops Revenue (USD Million) by Applications (2018-2022)
8.4 Asia Pacific Specialty Crops Revenue (USD Million), and Revenue (USD Million) by Type, and Applications (2018-2022)
8.4.1 Asia Pacific Specialty Crops Revenue (USD Million) by Country (2018-2022)
8.4.2 Asia Pacific Specialty Crops Revenue (USD Million) by Type (2018-2022)
8.4.3 Asia Pacific Specialty Crops Revenue (USD Million) by Applications (2018-2022)
8.5 South America Specialty Crops Revenue (USD Million), by Type, and Applications (2018-2022)
8.5.1 South America Specialty Crops Revenue (USD Million), by Country (2018-2022)
8.5.2 South America Specialty Crops Revenue (USD Million) by Type (2018-2022)
8.5.3 South America Specialty Crops Revenue (USD Million) by Applications (2018-2022)
8.6 Middle East and Africa Specialty Crops Revenue (USD Million), by Type, Technology, Application, Thickness (2018-2022)
8.6.1 Middle East and Africa Specialty Crops Revenue (USD Million) by Country (2018-2022)
8.6.2 Middle East and Africa Specialty Crops Revenue (USD Million) by Type (2018-2022)
8.6.3 Middle East and Africa Specialty Crops Revenue (USD Million) by Applications (2018-2022)
9 Company Profiles
10 Global Specialty Crops Market Revenue (USD Million), by Type, and Applications (2023-2030)
10.1 Global Specialty Crops Revenue (USD Million) and Market Share (%) by Type (2023-2030)
10.1.1 Global Specialty Crops Revenue (USD Million), and Market Share (%) by Type (2023-2030)
10.2 Global Specialty Crops Revenue (USD Million) and Market Share (%) by Applications (2023-2030)
10.2.1 Global Specialty Crops Revenue (USD Million), and Market Share (%) by Applications (2023-2030)
11 Global Specialty Crops Development Regional Status and Outlook Forecast
11.1 Global Specialty Crops Revenue (USD Million) By Regions (2023-2030)
11.2 North America Specialty Crops Revenue (USD Million) by Type, and Applications (2023-2030)
11.2.1 North America Specialty Crops Revenue (USD) Million by Country (2023-2030)
11.2.2 North America Specialty Crops Revenue (USD Million), by Type (2023-2030)
11.2.3 North America Specialty Crops Revenue (USD Million), Market Share (%) by Applications (2023-2030)
11.3 Europe Specialty Crops Revenue (USD Million), by Type, and Applications (2023-2030)
11.3.1 Europe Specialty Crops Revenue (USD Million), by Country (2023-2030)
11.3.2 Europe Specialty Crops Revenue (USD Million), by Type (2023-2030)
11.3.3 Europe Specialty Crops Revenue (USD Million), by Applications (2023-2030)
11.4 Asia Pacific Specialty Crops Revenue (USD Million) by Type, and Applications (2023-2030)
11.4.1 Asia Pacific Specialty Crops Revenue (USD Million), by Country (2023-2030)
11.4.2 Asia Pacific Specialty Crops Revenue (USD Million), by Type (2023-2030)
11.4.3 Asia Pacific Specialty Crops Revenue (USD Million), by Applications (2023-2030)
11.5 South America Specialty Crops Revenue (USD Million), by Type, and Applications (2023-2030)
11.5.1 South America Specialty Crops Revenue (USD Million), by Country (2023-2030)
11.5.2 South America Specialty Crops Revenue (USD Million), by Type (2023-2030)
11.5.3 South America Specialty Crops Revenue (USD Million), by Applications (2023-2030)
11.6 Middle East and Africa Specialty Crops Revenue (USD Million), by Type, and Applications (2023-2030)
11.6.1 Middle East and Africa Specialty Crops Revenue (USD Million), by region (2023-2030)
11.6.2 Middle East and Africa Specialty Crops Revenue (USD Million), by Type (2023-2030)
11.6.3 Middle East and Africa Specialty Crops Revenue (USD Million), by Applications (2023-2030)
12 Methodology and Data Sources
12.1 Methodology/Research Approach
12.1.1 Research Programs/Design
12.1.2 Market Size Estimation
12.1.3 Market Breakdown and Data Triangulation
12.2 Data Sources
12.2.1 Secondary Sources
12.2.2 Primary Sources
12.3 Disclaimer
List of Tables
Table 1 Market Segmentation Analysis
Table 2 Global Specialty Crops Market Companies with Areas Served
Table 3 Products Offerings Global Specialty Crops Market
Table 4 Low Growth Scenario Forecasts
Table 5 Reference Case Growth Scenario
Table 6 High Growth Case Scenario
Table 7 Global Specialty Crops Revenue (USD Million) And CAGR (%) By Type (2018-2030)
Table 8 Global Specialty Crops Revenue (USD Million) And CAGR (%) By Applications (2018-2030)
Table 9 Global Specialty Crops Revenue (USD Million) And CAGR (%) By Regions (2018-2030)
Table 10 Global Specialty Crops Revenue (USD Million) By Type (2018-2022)
Table 11 Global Specialty Crops Revenue Market Share (%) By Type (2018-2022)
Table 12 Global Specialty Crops Revenue (USD Million) By Applications (2018-2022)
Table 13 Global Specialty Crops Revenue Market Share (%) By Applications (2018-2022)
Table 14 Global Specialty Crops Market Revenue (USD Million) By Regions (2018-2022)
Table 15 Global Specialty Crops Market Share (%) By Regions (2018-2022)
Table 16 North America Specialty Crops Revenue (USD Million) By Country (2018-2022)
Table 17 North America Specialty Crops Revenue (USD Million) By Type (2018-2022)
Table 18 North America Specialty Crops Revenue (USD Million) By Applications (2018-2022)
Table 19 Europe Specialty Crops Revenue (USD Million) By Country (2018-2022)
Table 20 Europe Specialty Crops Revenue (USD Million) By Type (2018-2022)
Table 21 Europe Specialty Crops Revenue (USD Million) By Applications (2018-2022)
Table 22 Asia Pacific Specialty Crops Revenue (USD Million) By Country (2018-2022)
Table 23 Asia Pacific Specialty Crops Revenue (USD Million) By Type (2018-2022)
Table 24 Asia Pacific Specialty Crops Revenue (USD Million) By Applications (2018-2022)
Table 25 South America Specialty Crops Revenue (USD Million) By Country (2018-2022)
Table 26 South America Specialty Crops Revenue (USD Million) By Type (2018-2022)
Table 27 South America Specialty Crops Revenue (USD Million) By Applications (2018-2022)
Table 28 Middle East and Africa Specialty Crops Revenue (USD Million) By Region (2018-2022)
Table 29 Middle East and Africa Specialty Crops Revenue (USD Million) By Type (2018-2022)
Table 30 Middle East and Africa Specialty Crops Revenue (USD Million) By Applications (2018-2022)
Table 31 Financial Analysis
Table 32 Global Specialty Crops Revenue (USD Million) By Type (2023-2030)
Table 33 Global Specialty Crops Revenue Market Share (%) By Type (2023-2030)
Table 34 Global Specialty Crops Revenue (USD Million) By Applications (2023-2030)
Table 35 Global Specialty Crops Revenue Market Share (%) By Applications (2023-2030)
Table 36 Global Specialty Crops Market Revenue (USD Million), And Revenue (USD Million) By Regions (2023-2030)
Table 37 North America Specialty Crops Revenue (USD)By Country (2023-2030)
Table 38 North America Specialty Crops Revenue (USD Million) By Type (2023-2030)
Table 39 North America Specialty Crops Revenue (USD Million) By Applications (2023-2030)
Table 40 Europe Specialty Crops Revenue (USD Million) By Country (2023-2030)
Table 41 Europe Specialty Crops Revenue (USD Million) By Type (2023-2030)
Table 42 Europe Specialty Crops Revenue (USD Million) By Applications (2023-2030)
Table 43 Asia Pacific Specialty Crops Revenue (USD Million) By Country (2023-2030)
Table 44 Asia Pacific Specialty Crops Revenue (USD Million) By Type (2023-2030)
Table 45 Asia Pacific Specialty Crops Revenue (USD Million) By Applications (2023-2030)
Table 46 South America Specialty Crops Revenue (USD Million) By Country (2023-2030)
Table 47 South America Specialty Crops Revenue (USD Million) By Type (2023-2030)
Table 48 South America Specialty Crops Revenue (USD Million) By Applications (2023-2030)
Table 49 Middle East and Africa Specialty Crops Revenue (USD Million) By Region (2023-2030)
Table 50 Middle East and Africa Specialty Crops Revenue (USD Million) By Region (2023-2030)
Table 51 Middle East and Africa Specialty Crops Revenue (USD Million) By Type (2023-2030)
Table 52 Middle East and Africa Specialty Crops Revenue (USD Million) By Applications (2023-2030)
Table 53 Research Programs/Design for This Report
Table 54 Key Data Information from Secondary Sources
Table 55 Key Data Information from Primary Sources
List of Figures
Figure 1 Market Scope
Figure 2 Porter’s Five Forces
Figure 3 Global Specialty Crops Revenue (USD Million) By Type (2018-2022)
Figure 4 Global Specialty Crops Revenue Market Share (%) By Type (2022)
Figure 5 Global Specialty Crops Revenue (USD Million) By Applications (2018-2022)
Figure 6 Global Specialty Crops Revenue Market Share (%) By Applications (2022)
Figure 7 Global Specialty Crops Market Revenue (USD Million) By Regions (2018-2022)
Figure 8 Global Specialty Crops Market Share (%) By Regions (2022)
Figure 9 North America Specialty Crops Revenue (USD Million) By Country (2018-2022)
Figure 10 North America Specialty Crops Revenue (USD Million) By Type (2018-2022)
Figure 11 North America Specialty Crops Revenue (USD Million) By Applications (2018-2022)
Figure 12 Europe Specialty Crops Revenue (USD Million) By Country (2018-2022)
Figure 13 Europe Specialty Crops Revenue (USD Million) By Type (2018-2022)
Figure 14 Europe Specialty Crops Revenue (USD Million) By Applications (2018-2022)
Figure 15 Asia Pacific Specialty Crops Revenue (USD Million) By Country (2018-2022)
Figure 16 Asia Pacific Specialty Crops Revenue (USD Million) By Type (2018-2022)
Figure 17 Asia Pacific Specialty Crops Revenue (USD Million) By Applications (2018-2022)
Figure 18 South America Specialty Crops Revenue (USD Million) By Country (2018-2022)
Figure 19 South America Specialty Crops Revenue (USD Million) By Type (2018-2022)
Figure 20 South America Specialty Crops Revenue (USD Million) By Applications (2018-2022)
Figure 21 Middle East and Africa Specialty Crops Revenue (USD Million) By Region (2018-2022)
Figure 22 Middle East and Africa Specialty Crops Revenue (USD Million) By Type (2018-2022)
Figure 23 Middle East and Africa Specialty Crops Revenue (USD Million) By Applications (2018-2022)
Figure 24 Global Specialty Crops Revenue (USD Million) By Type (2023-2030)
Figure 25 Global Specialty Crops Revenue Market Share (%) By Type (2030)
Figure 26 Global Specialty Crops Revenue (USD Million) By Applications (2023-2030)
Figure 27 Global Specialty Crops Revenue Market Share (%) By Applications (2030)
Figure 28 Global Specialty Crops Market Revenue (USD Million) By Regions (2023-2030)
Figure 29 North America Specialty Crops Revenue (USD Million) By Country (2023-2030)
Figure 30 North America Specialty Crops Revenue (USD Million) By Type (2023-2030)
Figure 31 North America Specialty Crops Revenue (USD Million) By Applications (2023-2030)
Figure 32 Europe Specialty Crops Revenue (USD Million) By Country (2023-2030)
Figure 33 Europe Specialty Crops Revenue (USD Million) By Type (2023-2030)
Figure 34 Europe Specialty Crops Revenue (USD Million) By Applications (2023-2030)
Figure 35 Asia Pacific Specialty Crops Revenue (USD Million) By Country (2023-2030)
Figure 36 Asia Pacific Specialty Crops Revenue (USD Million) By Type (2023-2030)
Figure 37 Asia Pacific Specialty Crops Revenue (USD Million) By Applications (2023-2030)
Figure 38 South America Specialty Crops Revenue (USD Million) By Country (2023-2030)
Figure 39 South America Specialty Crops Revenue (USD Million) By Type (2023-2030)
Figure 40 South America Specialty Crops Revenue (USD Million) By Applications (2023-2030)
Figure 41 Middle East and Africa Specialty Crops Revenue (USD Million) By Region (2023-2030)
Figure 42 Middle East and Africa Specialty Crops Revenue (USD Million) By Region (2023-2030)
Figure 43 Middle East and Africa Specialty Crops Revenue (USD Million) By Type (2023-2030)
Figure 44 Middle East and Africa Specialty Crops Revenue (USD Million) By Applications (2023-2030)
Figure 45 Bottom-Up and Top-Down Approaches for This Report
Figure 46 Data Triangulation
