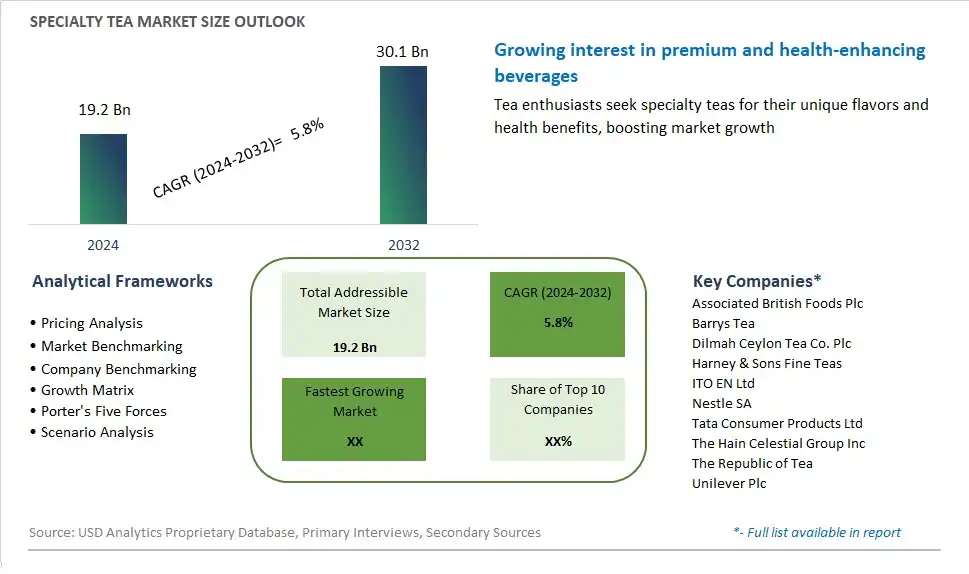
Global Specialty Tea Market Size is valued at $19.2 Billion in 2024 and is forecast to register a growth rate (CAGR) of 5.8% to reach $30.1 Billion by 2032.
The global Specialty Tea Market Comprehensive Study analyzes and forecasts the market size across 6 regions and 24 countries for diverse segments -By Application (Residential, Commercial)
An Introduction to Specialty Tea Market
In 2024, the specialty tea market is expanding rapidly, driven by the growing interest in premium, artisanal, and health-focused beverages. Specialty teas, including varieties like green, oolong, white, and herbal teas, offer unique flavors and health benefits that appeal to discerning consumers. The market is characterized by innovations in tea cultivation, processing, and blending, enhancing the quality and diversity of specialty tea offerings. The rising trend towards wellness and natural products is significantly boosting demand for organic and ethically sourced teas. Major brands are focusing on sustainable practices, eco-friendly packaging, and direct trade relationships with tea growers to ensure high standards and transparency. Additionally, the influence of tea culture and the popularity of tea ceremonies and tasting experiences are driving market growth.
Specialty Tea Competitive Landscape
The market report analyses the leading companies in the industry including Associated British Foods Plc, Barrys Tea, Dilmah Ceylon Tea Co. Plc, Harney & Sons Fine Teas, ITO EN Ltd, Nestle SA, Tata Consumer Products Ltd, The Hain Celestial Group Inc, The Republic of Tea, Unilever Plc, and Others.
Specialty Tea Market Dynamics
Specialty Tea Market Trend: Growing Demand for Health and Wellness Products
One prominent market trend in the specialty tea market is the growing demand for health and wellness products. Consumers are increasingly seeking beverages that offer both enjoyment and functional benefits, such as improved digestion, relaxation, and immune support. Specialty teas, known for their unique flavors and potential health benefits derived from natural ingredients and botanicals, are well-positioned to capitalize on this trend. With consumers becoming more health-conscious and proactive about self-care, specialty teas are experiencing heightened demand as a desirable beverage option that combines indulgence with wellness.
Market Driver: Shift Towards Premium and Artisanal Beverages
A key market driver for specialty tea is the shift towards premium and artisanal beverages. As consumers seek unique and elevated culinary experiences, there is a growing preference for high-quality, handcrafted products that offer superior taste, authenticity, and storytelling. Specialty teas, sourced from premium tea estates and crafted using traditional methods, appeal to discerning consumers looking for distinctive flavors and sensory experiences. The emphasis on quality and craftsmanship in specialty tea production drives consumer interest and willingness to pay a premium for teas that offer exceptional taste and provenance.
Market Opportunity: Expansion into Functional and Ready-to-Drink Segments
The growing popularity of specialty tea presents a significant opportunity for expansion into functional and ready-to-drink segments. With the rise of convenience-driven lifestyles and on-the-go consumption habits, there is demand for specialty tea products that offer convenience, portability, and added functionality. Manufacturers can capitalize on this opportunity by developing innovative formulations, such as functional teas with added vitamins, antioxidants, or adaptogens, and ready-to-drink formats like bottled or canned specialty tea beverages. Additionally, there is potential for collaboration with health and wellness brands, retailers, and foodservice providers to create curated assortments and experiential offerings that cater to diverse consumer preferences and occasions. By tapping into the growing demand for functional and convenient specialty tea products, stakeholders in the market can expand their reach and capture new market segments.
Specialty Tea Market Share Analysis: Commercial Application held the dominant market share in 2024
Within the specialty tea market, the commercial application segment stands as the largest, driven by several pivotal factors. Commercial establishments such as cafes, restaurants, hotels, and tea houses cater to a diverse clientele seeking unique and premium tea experiences. The growing trend of tea consumption as a social and cultural activity, coupled with the increasing popularity of specialty teas among discerning consumers, fuels the demand for specialty teas in commercial settings. Further, commercial establishments often offer a wide variety of specialty tea blends and flavors, enticing customers with innovative and curated tea menus. Additionally, the rise of specialty tea-focused businesses and franchises further amplifies the market share of the commercial application segment. As consumers continue to seek elevated tea experiences outside the confines of their homes, the commercial application segment retains its dominance in the specialty tea market landscape.
Specialty Tea Market Segmentation
By Application
Residential
Commercial
Countries Analyzed
North America (US, Canada, Mexico)
Europe (Germany, UK, France, Spain, Italy, Russia, Rest of Europe)
Asia Pacific (China, India, Japan, South Korea, Australia, South East Asia, Rest of Asia)
South America (Brazil, Argentina, Rest of South America)
Middle East and Africa (Saudi Arabia, UAE, Rest of Middle East, South Africa, Egypt, Rest of Africa)
Specialty Tea Companies Profiled in the Study
Associated British Foods Plc
Barrys Tea
Dilmah Ceylon Tea Co. Plc
Harney & Sons Fine Teas
ITO EN Ltd
Nestle SA
Tata Consumer Products Ltd
The Hain Celestial Group Inc
The Republic of Tea
Unilever Plc
*- List Not Exhaustive
Chapter 1. TABLE OF CONTENTS
Chapter 2. Introduction to Specialty Tea Market
2.1. Market Overview
2.2. Key Statistics and Report Highlights
2.3. Scope of the Comprehensive Study
2.3.1. Market Definition
2.3.2 Countries and Regions Covered
2.3.3 Research Objective
2.3.4 Units, Currency, and Conversions
2.3.5 Industry Value Chain
2.4. Key Market Segments
2.5. Key Companies
2.6. Study Period
Chapter 3. Strategic Analysis Review
3.1. Specialty Tea Pricing Analysis and Forecast
3.2. Porter’s Five Forces
3.3. Market Ecosystem
3.4. SWOT Analysis
3.5. Regulatory Scenario
3.3. Effects of Inflation, Russia-Ukraine War, moderating economic growth, and other macroeconomic factors
Chapter 4. Competitive Landscape
4.1. Market Share Analysis
4.1.1. Global Specialty Tea Market Share by Company, 2023
4.1.2. Product Offerings of Leading Specialty Tea Companies
4.2. Market Entropy
4.2.1. New Product Launches in the Industry
4.2.2. Mergers, Acquisitions, Joint ventures, and Partnerships
4.3. Key Strategies and Best Practices
Chapter 5. Global Market Projections: Best, Reference, and Low Case Scenarios
5.1. Growth Analysis- Case Scenario Definitions
5.2. Low Growth Case Scenario Forecasts
5.3. Reference Growth Case Scenario Forecasts
5.4. High Growth Case Scenario Forecasts
Chapter 6. Market Dynamics
6.1. Specialty Tea Market Drivers
6.2. Specialty Tea Market Challenges
6.6. Specialty Tea Market Opportunities
6.4. Specialty Tea Market Trends
Chapter 7. Global Specialty Tea Market Outlook Trends
7.1. Global Specialty Tea Revenue (USD Million) and CAGR (%) by Type (2021-2032)
7.2. Global Specialty Tea Revenue (USD Million) and CAGR (%) by Application (2021-2032)
7.3. Global Specialty Tea Revenue (USD Million) and CAGR (%) by Product (2021-2032)
By Application
Residential
Commercial
Chapter 8. Global Specialty Tea Regional Analysis and Outlook
8.1. Global Specialty Tea Revenue (USD Million) By Regions (2021- 2032)
8.2. North America Specialty Tea Revenue (USD Million) by Country (2021-2032)
8.2.1. United States Specialty Tea Regional Analysis and Outlook
8.2.2. Canada Specialty Tea Regional Analysis and Outlook
8.2.3. Mexico Specialty Tea Regional Analysis and Outlook
8.3. Europe Specialty Tea Revenue (USD Million), by Country (2021-2032)
8.3.1. Germany Specialty Tea Regional Analysis and Outlook
8.3.2. France Specialty Tea Regional Analysis and Outlook
8.3.3. United Kingdom Specialty Tea Regional Analysis and Outlook
8.3.4. Spain Specialty Tea Regional Analysis and Outlook
8.3.5. Italy Specialty Tea Regional Analysis and Outlook
8.3.6. Russia Specialty Tea Regional Analysis and Outlook
8.3.7. Rest of Europe Specialty Tea Regional Analysis and Outlook
8.4. Asia Pacific Specialty Tea Revenue (USD Million) by Country (2021-2032)
8.4.1. China Specialty Tea Regional Analysis and Outlook
8.4.2. Japan Specialty Tea Regional Analysis and Outlook
8.4.3. India Specialty Tea Regional Analysis and Outlook
8.4.4. South Korea Specialty Tea Regional Analysis and Outlook
8.4.5. Australia Specialty Tea Regional Analysis and Outlook
8.4.6. South East Asia Specialty Tea Regional Analysis and Outlook
8.4.7. Rest of Asia Pacific Specialty Tea Regional Analysis and Outlook
8.5. South America Specialty Tea Revenue (USD Million), by Country (2021-2032)
8.5.1. Brazil Specialty Tea Regional Analysis and Outlook
8.5.2. Argentina Specialty Tea Regional Analysis and Outlook
8.5.3. Rest of South America Specialty Tea Regional Analysis and Outlook
8.6. Middle East and Africa Specialty Tea Revenue (USD Million) by Country (2021-2032)
8.6.1. Middle East Specialty Tea Regional Analysis and Outlook
8.6.2. Africa Specialty Tea Regional Analysis and Outlook
Chapter 9. North America Specialty Tea Analysis and Outlook
9.1. North America Specialty Tea Revenue (USD Million) by Segments (2021-2032)
9.1.1. North America Specialty Tea Revenue (USD Million) by Type (2021-2032)
9.1.2. North America Specialty Tea Revenue (USD Million) by Application (2021-2032)
9.1.3. North America Specialty Tea Revenue (USD Million) by Product (2021-2032)
By Application
Residential
Commercial
Chapter 10. Europe Specialty Tea Analysis and Outlook
10.1. Europe Specialty Tea Revenue (USD Million), by Segments (USD Million) (2021-2032)
10.1.1. Europe Specialty Tea Revenue (USD Million) by Type (2021-2032)
10.1.2. Europe Specialty Tea Revenue (USD Million) by Application (2021-2032)
10.1.3. Europe Specialty Tea Revenue (USD Million) by Product (2021-2032)
By Application
Residential
Commercial
Chapter 11. Asia Pacific Specialty Tea Analysis and Outlook
11.1. Asia Pacific Specialty Tea Revenue (USD Million), and Revenue (USD Million) by Segments (2021-2032)
11.1.1. Asia Pacific Specialty Tea Revenue (USD Million) by Type (2021-2032)
11.1.2. Asia Pacific Specialty Tea Revenue (USD Million) by Application (2021-2032)
11.1.3. Asia Pacific Specialty Tea Revenue (USD Million) by Product (2021-2032)
By Application
Residential
Commercial
Chapter 12. South America Specialty Tea Analysis and Outlook
12.1. South America Specialty Tea Revenue (USD Million), by Segments (2021-2032)
12.1.1. South America Specialty Tea Revenue (USD Million) by Type (2021-2032)
12.1.2. South America Specialty Tea Revenue (USD Million) by Application (2021-2032)
12.1.3. South America Specialty Tea Revenue (USD Million) by Product (2021-2032)
By Application
Residential
Commercial
Chapter 13. Middle East and Africa Specialty Tea Analysis and Outlook
13.1. Middle East and Africa Specialty Tea Revenue (USD Million), by Segments (2021-2032)
13.1.1. Middle East and Africa Specialty Tea Revenue (USD Million) by Type (2021-2032)
13.1.2. Middle East and Africa Specialty Tea Revenue (USD Million) by Application (2021-2032)
13.1.3. Middle East and Africa Specialty Tea Revenue (USD Million) by Product (2021-2032)
By Application
Residential
Commercial
Chapter 14. Specialty Tea Company Profiles
14.1 Business Overview
14.2 Product Profiles
14.3 SWOT Profiles
14.5 Recent Developments
14.6 Financial Profile
List of Companies
Associated British Foods Plc
Barrys Tea
Dilmah Ceylon Tea Co. Plc
Harney & Sons Fine Teas
ITO EN Ltd
Nestle SA
Tata Consumer Products Ltd
The Hain Celestial Group Inc
The Republic of Tea
Unilever Plc
15. Methodology and Data Sources
15.1 Customization Offerings
15.2 Subscription Services
15.3 Related Reports
15.4 Publisher Expertise
LIST OF TABLES
Table 1 Market Segmentation Analysis
Table 2 Global Specialty Tea Market Share of Leading Companies, 2023
Table 3 Product Offerings of Leading Companies
Table 4 Low Growth Scenario Forecasts
Table 5 Reference Case Growth Scenario
Table 6 High Growth Case Scenario
Table 7 Global Specialty Tea Revenue (USD Million) And CAGR (%) By Type (2021-2032)
Table 8 Global Specialty Tea Revenue (USD Million) And CAGR (%) By Application (2021-2032)
Table 9 Global Specialty Tea Revenue (USD Million) And CAGR (%) By Product (2021-2032)
Table 10 Global Specialty Tea Market Revenue (USD Million) By Regions (2021-2032)
Table 11 Global Specialty Tea Market Share (%) By Regions (2021-2032)
Table 12 North America Specialty Tea Revenue (USD Million) By Country (2021-2032)
Table 13 Europe Specialty Tea Revenue (USD Million) By Country (2021-2032)
Table 14 Asia Pacific Specialty Tea Revenue (USD Million) By Country (2021-2032)
Table 15 South America Specialty Tea Revenue (USD Million) By Country (2021-2032)
Table 16 Middle East and Africa Specialty Tea Revenue (USD Million) By Region (2021-2032)
Table 17 North America Specialty Tea Revenue (USD Million) By Type (2021-2032)
Table 18 North America Specialty Tea Revenue (USD Million) By Application (2021-2032)
Table 19 North America Specialty Tea Revenue (USD Million) By Product (2021-2032)
Table 20 Europe Specialty Tea Revenue (USD Million) By Type (2021-2032)
Table 21 Europe Specialty Tea Revenue (USD Million) By Application (2021-2032)
Table 22 Europe Specialty Tea Revenue (USD Million) By Product (2021-2032)
Table 23 Asia Pacific Specialty Tea Revenue (USD Million) By Type (2021-2032)
Table 24 Asia Pacific Specialty Tea Revenue (USD Million) By Application (2021-2032)
Table 25 Asia Pacific Specialty Tea Revenue (USD Million) By Product (2021-2032)
Table 26 South America Specialty Tea Revenue (USD Million) By Type (2021-2032)
Table 27 South America Specialty Tea Revenue (USD Million) By Application (2021-2032)
Table 28 South America Specialty Tea Revenue (USD Million) By Product (2021-2032)
Table 29 Middle East and Africa Specialty Tea Revenue (USD Million) By Type (2021-2032)
Table 30 Middle East and Africa Specialty Tea Revenue (USD Million) By Application (2021-2032)
Table 31 Middle East and Africa Specialty Tea Revenue (USD Million) By Product (2021-2032)
LIST OF FIGURES
Figure 1. Market Scope
Figure 2. Pricing Forecasts Per Unit, 2023- 2032
Figure 3. Porter’s Five Forces
Figure 4. Global Specialty Tea Market Revenue (USD Million) By Regions (2021-2032)
Figure 5. Global Specialty Tea Market Share (%) By Regions (2023)
Figure 6. North America Specialty Tea Revenue (USD Million) By Country (2021-2032)
Figure 7. United States Specialty Tea Revenue (USD Million) By Country (2021-2032)
Figure 8. Canada Specialty Tea Revenue (USD Million) By Country (2021-2032)
Figure 9. Mexico Specialty Tea Revenue (USD Million) By Country (2021-2032)
Figure 10. Europe Specialty Tea Revenue (USD Million) By Country (2021-2032)
Figure 11. Germany Specialty Tea Revenue (USD Million) By Country (2021-2032)
Figure 12. France Specialty Tea Revenue (USD Million) By Country (2021-2032)
Figure 13. United Kingdom Specialty Tea Revenue (USD Million) By Country (2021-2032)
Figure 14. Spain Specialty Tea Revenue (USD Million) By Country (2021-2032)
Figure 15. Italy Specialty Tea Revenue (USD Million) By Country (2021-2032)
Figure 16. Russia Specialty Tea Revenue (USD Million) By Country (2021-2032)
Figure 17. Rest of Europe Specialty Tea Revenue (USD Million) By Country (2021-2032)
Figure 11. Asia Pacific Specialty Tea Revenue (USD Million) By Country (2021-2032)
Figure 12. China Specialty Tea Revenue (USD Million) By Country (2021-2032)
Figure 13. Japan Specialty Tea Revenue (USD Million) By Country (2021-2032)
Figure 14. India Specialty Tea Revenue (USD Million) By Country (2021-2032)
Figure 15. South Korea Specialty Tea Revenue (USD Million) By Country (2021-2032)
Figure 16. Australia Specialty Tea Revenue (USD Million) By Country (2021-2032)
Figure 17. South East Asia Specialty Tea Revenue (USD Million) By Country (2021-2032)
Figure 18. South America Specialty Tea Revenue (USD Million) By Country (2021-2032)
Figure 19. Brazil Specialty Tea Revenue (USD Million) By Country (2021-2032)
Figure 20. Argentina Specialty Tea Revenue (USD Million) By Country (2021-2032)
Figure 21. Rest of Asia Pacific Specialty Tea Revenue (USD Million) By Country (2021-2032)
Figure 22. Middle East and Africa Specialty Tea Revenue (USD Million) By Region (2021-2032)
Figure 23. Saudi Arabia Specialty Tea Revenue (USD Million) By Region (2021-2032)
Figure 24. The UAE Specialty Tea Revenue (USD Million) By Region (2021-2032)
Figure 25. Rest of Middle East Specialty Tea Revenue (USD Million) By Region (2021-2032)
Figure 26. South Africa Specialty Tea Revenue (USD Million) By Region (2021-2032)
Figure 27. Africa Specialty Tea Revenue (USD Million) By Region (2021-2032)
Figure 28. North America Specialty Tea Revenue (USD Million) By Type (2021-2032)
Figure 29. North America Specialty Tea Revenue (USD Million) By Application (2021-2032)
Figure 30. North America Specialty Tea Revenue (USD Million) By Product (2021-2032)
Figure 31. Europe Specialty Tea Revenue (USD Million) By Type (2021-2032)
Figure 32. Europe Specialty Tea Revenue (USD Million) By Application (2021-2032)
Figure 33. Europe Specialty Tea Revenue (USD Million) By Product (2021-2032)
Figure 34. Asia Pacific Specialty Tea Revenue (USD Million) By Type (2021-2032)
Figure 35. Asia Pacific Specialty Tea Revenue (USD Million) By Application (2021-2032)
Figure 36. Asia Pacific Specialty Tea Revenue (USD Million) By Product (2021-2032)
Figure 37. South America Specialty Tea Revenue (USD Million) By Type (2021-2032)
Figure 38. South America Specialty Tea Revenue (USD Million) By Application (2021-2032)
Figure 39. South America Specialty Tea Revenue (USD Million) By Product (2021-2032)
Figure 40. Middle East and Africa Specialty Tea Revenue (USD Million) By Type (2021-2032)
Figure 41. Middle East and Africa Specialty Tea Revenue (USD Million) By Application (2021-2032)
Figure 42. Middle East and Africa Specialty Tea Revenue (USD Million) By Product (2021-2032)
By Application
Residential
Commercial
Countries Analyzed
North America (US, Canada, Mexico)
Europe (Germany, UK, France, Spain, Italy, Russia, Rest of Europe)
Asia Pacific (China, India, Japan, South Korea, Australia, South East Asia, Rest of Asia)
South America (Brazil, Argentina, Rest of South America)
Middle East and Africa (Saudi Arabia, UAE, Rest of Middle East, South Africa, Egypt, Rest of Africa)
