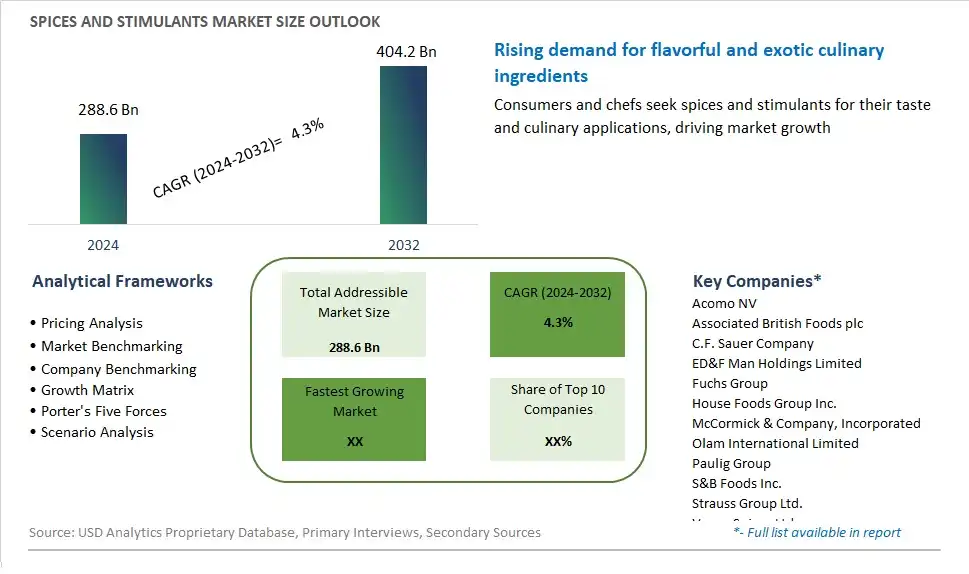
Global Spices and Stimulants Market Size is valued at $288.6 Billion in 2024 and is forecast to register a growth rate (CAGR) of 4.3% to reach $404.2 Billion by 2032.
The global Spices and Stimulants Market Comprehensive Study analyzes and forecasts the market size across 6 regions and 24 countries for diverse segments -By Type (Spices, Stimulants), By Application (Supermarkets/Hypermarkets, Independent Retailers, Specialist Retailers, Others)
An Introduction to Spices and Stimulants Market
The spices and stimulants market in 2024 is experiencing robust growth, driven by the increasing demand for flavorful and health-promoting ingredients. Spices, including cinnamon, turmeric, and black pepper, are essential for enhancing the taste and nutritional value of foods. Stimulants, such as caffeine and guarana, are popular for their energizing effects. The market is characterized by a wide variety of products, ranging from whole and ground spices to spice blends and extracts. Innovations in sourcing and processing techniques are enhancing the quality and potency of spices and stimulants. The growing trend towards natural and organic products, along with the rising interest in global cuisines, is significantly boosting market demand. Major producers are focusing on sustainable and ethical sourcing practices to meet consumer preferences for high-quality and responsibly sourced ingredients.
Spices and Stimulants Competitive Landscape
The market report analyses the leading companies in the industry including Acomo NV, Associated British Foods plc, C.F. Sauer Company, ED&F Man Holdings Limited, Fuchs Group, House Foods Group Inc., McCormick & Company, Incorporated, Olam International Limited, Paulig Group, S&B Foods Inc., Strauss Group Ltd., Vanns Spices Ltd., Wei Chuan Foods Corporation, and Others.
Spices and Stimulants Market Dynamics
Spices and Stimulants Market Trend: Increasing Consumer Interest in Global Cuisine and Flavor Exploration
One prominent market trend in spices and stimulants is the increasing consumer interest in global cuisine and flavor exploration. As globalization continues to connect people and cultures, consumers are becoming more adventurous in their culinary experiences, seeking out exotic flavors and ingredients from around the world. This trend is driving the demand for a diverse range of spices and stimulants, including herbs, spices, coffee, and tea, to enhance the taste and aroma of dishes and beverages. With consumers eager to explore new flavors and recreate authentic international cuisines at home, the market for spices and stimulants is experiencing growth and diversification.
Market Driver: Growing Awareness of Health Benefits and Functional Properties
A key market driver for spices and stimulants is the growing awareness of their health benefits and functional properties. Many spices and stimulants, such as turmeric, ginger, cinnamon, coffee, and green tea, are renowned for their potential health-promoting properties, including antioxidant, anti-inflammatory, and metabolism-boosting effects. As consumers prioritize health and wellness, there is increasing demand for products that offer both culinary enjoyment and functional benefits. The perceived health benefits of spices and stimulants drive consumer purchasing decisions, influencing their choices in food and beverage products, dietary supplements, and wellness products.
Market Opportunity: Innovation in Product Formulations and Value-Added Offerings
The growing demand for spices and stimulants presents a significant opportunity for innovation in product formulations and value-added offerings. Manufacturers can capitalize on this trend by developing innovative spice blends, flavored stimulant beverages, and functional food and beverage products that cater to evolving consumer preferences and lifestyles. For example, there is potential to create gourmet spice blends tailored to specific cuisines or dietary preferences, as well as ready-to-drink coffee and tea beverages infused with natural flavors and functional ingredients. Additionally, there is opportunity for collaboration with health and wellness brands, culinary experts, and foodservice providers to create curated assortments and experiential offerings that appeal to discerning consumers seeking unique flavor experiences and functional benefits. By leveraging opportunities for innovation and value-added offerings, stakeholders in the spices and stimulants market can differentiate themselves and capture market share in an increasingly competitive landscape.
Spices and Stimulants Market Share Analysis: Spices held the dominant market share in 2024
Among the categories in the spices and stimulants market, spices emerge as the largest segment, driven by several crucial factors. Spices have been integral to culinary traditions worldwide for centuries, serving as essential ingredients in diverse cuisines across cultures. The widespread use of spices in culinary applications, ranging from seasoning and flavoring to preserving and coloring, underscores their significance in the global food industry. Additionally, the growing consumer interest in exploring exotic flavors and ethnic cuisines further fuels the demand for spices. Further, the expanding popularity of natural and organic ingredients in food products enhances the appeal of spices, known for their rich aroma, distinctive taste profiles, and potential health benefits. As consumers continue to seek authentic and flavorful culinary experiences, the spices segment maintains its prominence, commanding the largest share in the spices and stimulants market.
Spices and Stimulants Market Share Analysis: Supermarkets/Hypermarkets market is poised to register the fastest growth rae over the forecast period to 2032
Among the various application segments in the spices and stimulants market, supermarkets and hypermarkets emerge as the fastest-growing, propelled by several key factors. The increasing consumer preference for convenient one-stop shopping experiences and the rising prominence of organized retail formats contribute to the rapid expansion of supermarkets and hypermarkets. These retail channels offer a wide assortment of spices and stimulants, providing consumers with ample choices and opportunities to explore new flavors and products. Further, the growing urbanization and changing lifestyle patterns lead to greater reliance on supermarkets and hypermarkets for grocery shopping, further boosting the demand for spices and stimulants in these outlets. Additionally, aggressive marketing strategies, promotional campaigns, and product placement initiatives implemented by retailers drive impulse purchases and stimulate market growth. As supermarkets and hypermarkets continue to expand their footprint globally, they serve as catalysts for the accelerated growth of the spices and stimulants market, catering to the evolving preferences and demands of discerning consumers.
Spices and Stimulants Market Segmentation
By Type
Spices
Stimulants
By Application
Supermarkets/Hypermarkets
Independent Retailers
Specialist Retailers
Others
Countries Analyzed
North America (US, Canada, Mexico)
Europe (Germany, UK, France, Spain, Italy, Russia, Rest of Europe)
Asia Pacific (China, India, Japan, South Korea, Australia, South East Asia, Rest of Asia)
South America (Brazil, Argentina, Rest of South America)
Middle East and Africa (Saudi Arabia, UAE, Rest of Middle East, South Africa, Egypt, Rest of Africa)
Spices and Stimulants Companies Profiled in the Study
Acomo NV
Associated British Foods plc
C.F. Sauer Company
ED&F Man Holdings Limited
Fuchs Group
House Foods Group Inc.
McCormick & Company, Incorporated
Olam International Limited
Paulig Group
S&B Foods Inc.
Strauss Group Ltd.
Vanns Spices Ltd.
Wei Chuan Foods Corporation
*- List Not Exhaustive
Chapter 1. TABLE OF CONTENTS
Chapter 2. Introduction to Spices and Stimulants Market
2.1. Market Overview
2.2. Key Statistics and Report Highlights
2.3. Scope of the Comprehensive Study
2.3.1. Market Definition
2.3.2 Countries and Regions Covered
2.3.3 Research Objective
2.3.4 Units, Currency, and Conversions
2.3.5 Industry Value Chain
2.4. Key Market Segments
2.5. Key Companies
2.6. Study Period
Chapter 3. Strategic Analysis Review
3.1. Spices and Stimulants Pricing Analysis and Forecast
3.2. Porter’s Five Forces
3.3. Market Ecosystem
3.4. SWOT Analysis
3.5. Regulatory Scenario
3.3. Effects of Inflation, Russia-Ukraine War, moderating economic growth, and other macroeconomic factors
Chapter 4. Competitive Landscape
4.1. Market Share Analysis
4.1.1. Global Spices and Stimulants Market Share by Company, 2023
4.1.2. Product Offerings of Leading Spices and Stimulants Companies
4.2. Market Entropy
4.2.1. New Product Launches in the Industry
4.2.2. Mergers, Acquisitions, Joint ventures, and Partnerships
4.3. Key Strategies and Best Practices
Chapter 5. Global Market Projections: Best, Reference, and Low Case Scenarios
5.1. Growth Analysis- Case Scenario Definitions
5.2. Low Growth Case Scenario Forecasts
5.3. Reference Growth Case Scenario Forecasts
5.4. High Growth Case Scenario Forecasts
Chapter 6. Market Dynamics
6.1. Spices and Stimulants Market Drivers
6.2. Spices and Stimulants Market Challenges
6.6. Spices and Stimulants Market Opportunities
6.4. Spices and Stimulants Market Trends
Chapter 7. Global Spices and Stimulants Market Outlook Trends
7.1. Global Spices and Stimulants Revenue (USD Million) and CAGR (%) by Type (2021-2032)
7.2. Global Spices and Stimulants Revenue (USD Million) and CAGR (%) by Application (2021-2032)
7.3. Global Spices and Stimulants Revenue (USD Million) and CAGR (%) by Product (2021-2032)
By Type
Spices
Stimulants
By Application
Supermarkets/Hypermarkets
Independent Retailers
Specialist Retailers
Others
Chapter 8. Global Spices and Stimulants Regional Analysis and Outlook
8.1. Global Spices and Stimulants Revenue (USD Million) By Regions (2021- 2032)
8.2. North America Spices and Stimulants Revenue (USD Million) by Country (2021-2032)
8.2.1. United States Spices and Stimulants Regional Analysis and Outlook
8.2.2. Canada Spices and Stimulants Regional Analysis and Outlook
8.2.3. Mexico Spices and Stimulants Regional Analysis and Outlook
8.3. Europe Spices and Stimulants Revenue (USD Million), by Country (2021-2032)
8.3.1. Germany Spices and Stimulants Regional Analysis and Outlook
8.3.2. France Spices and Stimulants Regional Analysis and Outlook
8.3.3. United Kingdom Spices and Stimulants Regional Analysis and Outlook
8.3.4. Spain Spices and Stimulants Regional Analysis and Outlook
8.3.5. Italy Spices and Stimulants Regional Analysis and Outlook
8.3.6. Russia Spices and Stimulants Regional Analysis and Outlook
8.3.7. Rest of Europe Spices and Stimulants Regional Analysis and Outlook
8.4. Asia Pacific Spices and Stimulants Revenue (USD Million) by Country (2021-2032)
8.4.1. China Spices and Stimulants Regional Analysis and Outlook
8.4.2. Japan Spices and Stimulants Regional Analysis and Outlook
8.4.3. India Spices and Stimulants Regional Analysis and Outlook
8.4.4. South Korea Spices and Stimulants Regional Analysis and Outlook
8.4.5. Australia Spices and Stimulants Regional Analysis and Outlook
8.4.6. South East Asia Spices and Stimulants Regional Analysis and Outlook
8.4.7. Rest of Asia Pacific Spices and Stimulants Regional Analysis and Outlook
8.5. South America Spices and Stimulants Revenue (USD Million), by Country (2021-2032)
8.5.1. Brazil Spices and Stimulants Regional Analysis and Outlook
8.5.2. Argentina Spices and Stimulants Regional Analysis and Outlook
8.5.3. Rest of South America Spices and Stimulants Regional Analysis and Outlook
8.6. Middle East and Africa Spices and Stimulants Revenue (USD Million) by Country (2021-2032)
8.6.1. Middle East Spices and Stimulants Regional Analysis and Outlook
8.6.2. Africa Spices and Stimulants Regional Analysis and Outlook
Chapter 9. North America Spices and Stimulants Analysis and Outlook
9.1. North America Spices and Stimulants Revenue (USD Million) by Segments (2021-2032)
9.1.1. North America Spices and Stimulants Revenue (USD Million) by Type (2021-2032)
9.1.2. North America Spices and Stimulants Revenue (USD Million) by Application (2021-2032)
9.1.3. North America Spices and Stimulants Revenue (USD Million) by Product (2021-2032)
By Type
Spices
Stimulants
By Application
Supermarkets/Hypermarkets
Independent Retailers
Specialist Retailers
Others
Chapter 10. Europe Spices and Stimulants Analysis and Outlook
10.1. Europe Spices and Stimulants Revenue (USD Million), by Segments (USD Million) (2021-2032)
10.1.1. Europe Spices and Stimulants Revenue (USD Million) by Type (2021-2032)
10.1.2. Europe Spices and Stimulants Revenue (USD Million) by Application (2021-2032)
10.1.3. Europe Spices and Stimulants Revenue (USD Million) by Product (2021-2032)
By Type
Spices
Stimulants
By Application
Supermarkets/Hypermarkets
Independent Retailers
Specialist Retailers
Others
Chapter 11. Asia Pacific Spices and Stimulants Analysis and Outlook
11.1. Asia Pacific Spices and Stimulants Revenue (USD Million), and Revenue (USD Million) by Segments (2021-2032)
11.1.1. Asia Pacific Spices and Stimulants Revenue (USD Million) by Type (2021-2032)
11.1.2. Asia Pacific Spices and Stimulants Revenue (USD Million) by Application (2021-2032)
11.1.3. Asia Pacific Spices and Stimulants Revenue (USD Million) by Product (2021-2032)
By Type
Spices
Stimulants
By Application
Supermarkets/Hypermarkets
Independent Retailers
Specialist Retailers
Others
Chapter 12. South America Spices and Stimulants Analysis and Outlook
12.1. South America Spices and Stimulants Revenue (USD Million), by Segments (2021-2032)
12.1.1. South America Spices and Stimulants Revenue (USD Million) by Type (2021-2032)
12.1.2. South America Spices and Stimulants Revenue (USD Million) by Application (2021-2032)
12.1.3. South America Spices and Stimulants Revenue (USD Million) by Product (2021-2032)
By Type
Spices
Stimulants
By Application
Supermarkets/Hypermarkets
Independent Retailers
Specialist Retailers
Others
Chapter 13. Middle East and Africa Spices and Stimulants Analysis and Outlook
13.1. Middle East and Africa Spices and Stimulants Revenue (USD Million), by Segments (2021-2032)
13.1.1. Middle East and Africa Spices and Stimulants Revenue (USD Million) by Type (2021-2032)
13.1.2. Middle East and Africa Spices and Stimulants Revenue (USD Million) by Application (2021-2032)
13.1.3. Middle East and Africa Spices and Stimulants Revenue (USD Million) by Product (2021-2032)
By Type
Spices
Stimulants
By Application
Supermarkets/Hypermarkets
Independent Retailers
Specialist Retailers
Others
Chapter 14. Spices and Stimulants Company Profiles
14.1 Business Overview
14.2 Product Profiles
14.3 SWOT Profiles
14.5 Recent Developments
14.6 Financial Profile
List of Companies
Acomo NV
Associated British Foods plc
C.F. Sauer Company
ED&F Man Holdings Limited
Fuchs Group
House Foods Group Inc.
McCormick & Company, Incorporated
Olam International Limited
Paulig Group
S&B Foods Inc.
Strauss Group Ltd.
Vanns Spices Ltd.
Wei Chuan Foods Corporation
15. Methodology and Data Sources
15.1 Customization Offerings
15.2 Subscription Services
15.3 Related Reports
15.4 Publisher Expertise
LIST OF TABLES
Table 1 Market Segmentation Analysis
Table 2 Global Spices and Stimulants Market Share of Leading Companies, 2023
Table 3 Product Offerings of Leading Companies
Table 4 Low Growth Scenario Forecasts
Table 5 Reference Case Growth Scenario
Table 6 High Growth Case Scenario
Table 7 Global Spices and Stimulants Revenue (USD Million) And CAGR (%) By Type (2021-2032)
Table 8 Global Spices and Stimulants Revenue (USD Million) And CAGR (%) By Application (2021-2032)
Table 9 Global Spices and Stimulants Revenue (USD Million) And CAGR (%) By Product (2021-2032)
Table 10 Global Spices and Stimulants Market Revenue (USD Million) By Regions (2021-2032)
Table 11 Global Spices and Stimulants Market Share (%) By Regions (2021-2032)
Table 12 North America Spices and Stimulants Revenue (USD Million) By Country (2021-2032)
Table 13 Europe Spices and Stimulants Revenue (USD Million) By Country (2021-2032)
Table 14 Asia Pacific Spices and Stimulants Revenue (USD Million) By Country (2021-2032)
Table 15 South America Spices and Stimulants Revenue (USD Million) By Country (2021-2032)
Table 16 Middle East and Africa Spices and Stimulants Revenue (USD Million) By Region (2021-2032)
Table 17 North America Spices and Stimulants Revenue (USD Million) By Type (2021-2032)
Table 18 North America Spices and Stimulants Revenue (USD Million) By Application (2021-2032)
Table 19 North America Spices and Stimulants Revenue (USD Million) By Product (2021-2032)
Table 20 Europe Spices and Stimulants Revenue (USD Million) By Type (2021-2032)
Table 21 Europe Spices and Stimulants Revenue (USD Million) By Application (2021-2032)
Table 22 Europe Spices and Stimulants Revenue (USD Million) By Product (2021-2032)
Table 23 Asia Pacific Spices and Stimulants Revenue (USD Million) By Type (2021-2032)
Table 24 Asia Pacific Spices and Stimulants Revenue (USD Million) By Application (2021-2032)
Table 25 Asia Pacific Spices and Stimulants Revenue (USD Million) By Product (2021-2032)
Table 26 South America Spices and Stimulants Revenue (USD Million) By Type (2021-2032)
Table 27 South America Spices and Stimulants Revenue (USD Million) By Application (2021-2032)
Table 28 South America Spices and Stimulants Revenue (USD Million) By Product (2021-2032)
Table 29 Middle East and Africa Spices and Stimulants Revenue (USD Million) By Type (2021-2032)
Table 30 Middle East and Africa Spices and Stimulants Revenue (USD Million) By Application (2021-2032)
Table 31 Middle East and Africa Spices and Stimulants Revenue (USD Million) By Product (2021-2032)
LIST OF FIGURES
Figure 1. Market Scope
Figure 2. Pricing Forecasts Per Unit, 2023- 2032
Figure 3. Porter’s Five Forces
Figure 4. Global Spices and Stimulants Market Revenue (USD Million) By Regions (2021-2032)
Figure 5. Global Spices and Stimulants Market Share (%) By Regions (2023)
Figure 6. North America Spices and Stimulants Revenue (USD Million) By Country (2021-2032)
Figure 7. United States Spices and Stimulants Revenue (USD Million) By Country (2021-2032)
Figure 8. Canada Spices and Stimulants Revenue (USD Million) By Country (2021-2032)
Figure 9. Mexico Spices and Stimulants Revenue (USD Million) By Country (2021-2032)
Figure 10. Europe Spices and Stimulants Revenue (USD Million) By Country (2021-2032)
Figure 11. Germany Spices and Stimulants Revenue (USD Million) By Country (2021-2032)
Figure 12. France Spices and Stimulants Revenue (USD Million) By Country (2021-2032)
Figure 13. United Kingdom Spices and Stimulants Revenue (USD Million) By Country (2021-2032)
Figure 14. Spain Spices and Stimulants Revenue (USD Million) By Country (2021-2032)
Figure 15. Italy Spices and Stimulants Revenue (USD Million) By Country (2021-2032)
Figure 16. Russia Spices and Stimulants Revenue (USD Million) By Country (2021-2032)
Figure 17. Rest of Europe Spices and Stimulants Revenue (USD Million) By Country (2021-2032)
Figure 11. Asia Pacific Spices and Stimulants Revenue (USD Million) By Country (2021-2032)
Figure 12. China Spices and Stimulants Revenue (USD Million) By Country (2021-2032)
Figure 13. Japan Spices and Stimulants Revenue (USD Million) By Country (2021-2032)
Figure 14. India Spices and Stimulants Revenue (USD Million) By Country (2021-2032)
Figure 15. South Korea Spices and Stimulants Revenue (USD Million) By Country (2021-2032)
Figure 16. Australia Spices and Stimulants Revenue (USD Million) By Country (2021-2032)
Figure 17. South East Asia Spices and Stimulants Revenue (USD Million) By Country (2021-2032)
Figure 18. South America Spices and Stimulants Revenue (USD Million) By Country (2021-2032)
Figure 19. Brazil Spices and Stimulants Revenue (USD Million) By Country (2021-2032)
Figure 20. Argentina Spices and Stimulants Revenue (USD Million) By Country (2021-2032)
Figure 21. Rest of Asia Pacific Spices and Stimulants Revenue (USD Million) By Country (2021-2032)
Figure 22. Middle East and Africa Spices and Stimulants Revenue (USD Million) By Region (2021-2032)
Figure 23. Saudi Arabia Spices and Stimulants Revenue (USD Million) By Region (2021-2032)
Figure 24. The UAE Spices and Stimulants Revenue (USD Million) By Region (2021-2032)
Figure 25. Rest of Middle East Spices and Stimulants Revenue (USD Million) By Region (2021-2032)
Figure 26. South Africa Spices and Stimulants Revenue (USD Million) By Region (2021-2032)
Figure 27. Africa Spices and Stimulants Revenue (USD Million) By Region (2021-2032)
Figure 28. North America Spices and Stimulants Revenue (USD Million) By Type (2021-2032)
Figure 29. North America Spices and Stimulants Revenue (USD Million) By Application (2021-2032)
Figure 30. North America Spices and Stimulants Revenue (USD Million) By Product (2021-2032)
Figure 31. Europe Spices and Stimulants Revenue (USD Million) By Type (2021-2032)
Figure 32. Europe Spices and Stimulants Revenue (USD Million) By Application (2021-2032)
Figure 33. Europe Spices and Stimulants Revenue (USD Million) By Product (2021-2032)
Figure 34. Asia Pacific Spices and Stimulants Revenue (USD Million) By Type (2021-2032)
Figure 35. Asia Pacific Spices and Stimulants Revenue (USD Million) By Application (2021-2032)
Figure 36. Asia Pacific Spices and Stimulants Revenue (USD Million) By Product (2021-2032)
Figure 37. South America Spices and Stimulants Revenue (USD Million) By Type (2021-2032)
Figure 38. South America Spices and Stimulants Revenue (USD Million) By Application (2021-2032)
Figure 39. South America Spices and Stimulants Revenue (USD Million) By Product (2021-2032)
Figure 40. Middle East and Africa Spices and Stimulants Revenue (USD Million) By Type (2021-2032)
Figure 41. Middle East and Africa Spices and Stimulants Revenue (USD Million) By Application (2021-2032)
Figure 42. Middle East and Africa Spices and Stimulants Revenue (USD Million) By Product (2021-2032)
By Type
Spices
Stimulants
By Application
Supermarkets/Hypermarkets
Independent Retailers
Specialist Retailers
Others
Countries Analyzed
North America (US, Canada, Mexico)
Europe (Germany, UK, France, Spain, Italy, Russia, Rest of Europe)
Asia Pacific (China, India, Japan, South Korea, Australia, South East Asia, Rest of Asia)
South America (Brazil, Argentina, Rest of South America)
Middle East and Africa (Saudi Arabia, UAE, Rest of Middle East, South Africa, Egypt, Rest of Africa)
