<h3><Strong><i>Global Spices Market Size is valued at $22.8 Billion in 2024 and is forecast to register a growth rate (CAGR) of 5.9% to reach $36.1 Billion by 2032.</h3></Strong></i>The global Spices Market Comprehensive Study analyzes and forecasts the market size across 6 regions and 24 countries for diverse segments -By Product (Pepper, Ginger, Cinnamon, Cumin, Turmeric, Cardamom, Coriander, Cloves, Others), By Form (Powder, Whole, Chopped/Crushed)
<h2>An Introduction to Spices Market</h2>The spices market continues to flourish in 2024, driven by the enduring consumer preference for diverse flavors, culinary exploration, and the growing awareness of the health benefits associated with spices. Spices, derived from various plant parts such as seeds, bark, roots, and fruits, play a pivotal role in enhancing the taste, aroma, and nutritional value of food and beverages. With globalization and increasing multiculturalism, there is a growing demand for exotic and ethnic spices, driving market growth. Furthermore, the pharmaceutical and nutraceutical industries are harnessing the medicinal properties of spices for their antioxidant, anti-inflammatory, and antimicrobial properties, widening the market scope beyond culinary applications. As consumers prioritize natural and organic ingredients, the demand for premium and ethically sourced spices is witnessing an upsurge, shaping the dynamics of the global spices market.
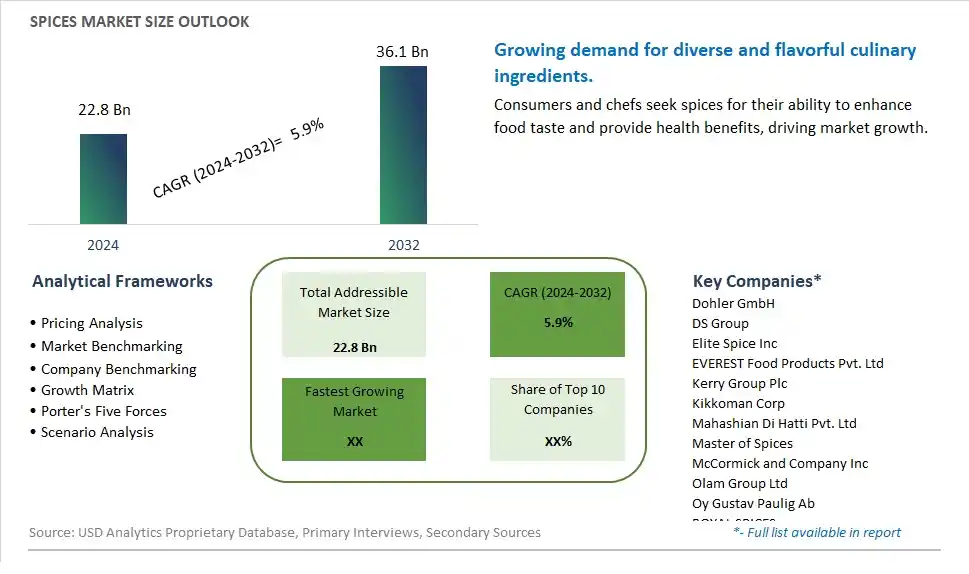
<h2>Spices Competitive Landscape</h2>The market report analyses the leading companies in the industry including Dohler GmbH, DS Group, Elite Spice Inc, EVEREST Food Products Pvt. Ltd, Kerry Group Plc, Kikkoman Corp, Mahashian Di Hatti Pvt. Ltd, Master of Spices, McCormick and Company Inc, Olam Group Ltd, Oy Gustav Paulig Ab, ROYAL SPICES, SOLINA, The Bart Ingredients Co., The Speculaas Spice Co. Ltd, Touton SA, UK Blending Ltd, and Others.<h2>Spices Market Dynamics</h2><h3>Spices Market Trend: Increasing Demand for Ethnic and Global Cuisine</h3>One prominent trend in the spices market is the increasing demand for ethnic and global cuisine. As consumers become more adventurous in their culinary exploration and seek authentic flavors from around the world, there's a rising interest in incorporating a diverse range of spices into their cooking. Spices play a crucial role in adding depth, complexity, and authenticity to various dishes, making them essential ingredients in ethnic and global cuisines such as Indian, Thai, Mexican, and Middle Eastern cuisines. This trend is driving the expansion of the spices market as consumers seek out a wide variety of spices to recreate their favorite international dishes at home and experiment with new flavor profiles and culinary experiences.<h3>Market Driver: Growing Health and Wellness Consciousness</h3>A key driver in the spices market is the growing health and wellness consciousness among consumers. With increasing awareness of the potential health benefits of spices, such as antioxidant properties, anti-inflammatory effects, and digestive health support, there's a rising demand for spices as functional ingredients in cooking and food preparation. Spices are valued not only for their flavor-enhancing properties but also for their potential contributions to overall health and well-being. This driver fuels market growth as consumers seek out spices known for their medicinal and nutritional properties, such as turmeric, ginger, cinnamon, and cayenne pepper, incorporating them into their diets to promote health and vitality.<h3>Market Opportunity: Expansion into Convenient and Ready-to-Use Spice Blends</h3>An emerging opportunity in the spices market is the expansion into convenient and ready-to-use spice blends. While individual spices offer versatility and customization in cooking, there's a growing demand for pre-mixed spice blends that offer convenience and time-saving benefits for busy consumers. Spice blends simplify the cooking process by combining complementary spices and seasonings in pre-measured proportions, allowing home cooks to create flavorful dishes with ease and consistency. Additionally, spice blends offer a convenient solution for consumers looking to experiment with new flavors and cuisines without the need to purchase multiple individual spices. By offering a diverse range of ready-to-use spice blends for various cuisines and cooking styles, spice manufacturers can capitalize on the convenience trend and expand their product offerings to cater to the evolving needs and preferences of modern consumers.<h3>Spices Market Share Analysis: Pepper held the dominant market share in 2024</h3>In the Spices market, the "Pepper" segment is the largest, commanding significant prominence for several compelling reasons. Pepper, known as the "King of Spices," holds a central position in global culinary traditions and is widely used across diverse cuisines worldwide. Its bold, pungent flavor profile and versatile application in both savory and sweet dishes contribute to its enduring popularity among consumers and chefs alike. Further, pepper's rich history as a prized commodity in international trade further enhances its significance in the global spice market. Additionally, the rising consumer interest in authentic and exotic flavors, coupled with the growing demand for natural and organic ingredients, drives the continued dominance of the Pepper segment. With its widespread usage, culinary versatility, and enduring appeal, pepper remains at the forefront of the Spices market, shaping the landscape of global cuisine and flavor profiles.<h3>Spices Market Share Analysis: Powder market is poised to register the fastest growth rae over the forecast period to 2032</h3>Among the segments delineated in the Spices market, the "Powder" segment is the fastest-growing, driven by several key factors. Powdered spices offer convenience, versatility, and ease of use, making them increasingly popular among consumers and food manufacturers alike. With busy lifestyles and a growing demand for convenient meal solutions, powdered spices provide a quick and efficient way to add flavor and aroma to dishes without the need for additional preparation or processing. Further, powdered spices have a longer shelf life compared to whole or chopped/crushed forms, contributing to their appeal for both consumers and retailers seeking extended product storage and inventory management. Additionally, the rise of global cuisine and multicultural dining preferences fuels the demand for powdered spices as essential ingredients in a wide range of dishes, from traditional recipes to fusion cuisine. With their convenience, versatility, and widespread application in culinary creations, the Powder segment is poised to sustain its rapid growth, reshaping the landscape of the Spices market towards convenient and flavorful culinary experiences.<h2>Spices Market Segmentation</h2><Strong>By Product</Strong>
Pepper
Ginger
Cinnamon
Cumin
Turmeric
Cardamom
Coriander
Cloves
Others
<Strong>By Form</Strong>
Powder
Whole
Chopped/Crushed
<Strong>Countries Analyzed</Strong>
North America (US, Canada, Mexico)
Europe (Germany, UK, France, Spain, Italy, Russia, Rest of Europe)
Asia Pacific (China, India, Japan, South Korea, Australia, South East Asia, Rest of Asia)
South America (Brazil, Argentina, Rest of South America)
Middle East and Africa (Saudi Arabia, UAE, Rest of Middle East, South Africa, Egypt, Rest of Africa)<h2>Spices Companies Profiled in the Study</h2>Dohler GmbH
DS Group
Elite Spice Inc
EVEREST Food Products Pvt. Ltd
Kerry Group Plc
Kikkoman Corp
Mahashian Di Hatti Pvt. Ltd
Master of Spices
McCormick and Company Inc
Olam Group Ltd
Oy Gustav Paulig Ab
ROYAL SPICES
SOLINA
The Bart Ingredients Co.
The Speculaas Spice Co. Ltd
Touton SA
UK Blending Ltd
*- List Not Exhaustive
<Strong>Chapter 1. TABLE OF CONTENTS</Strong>
<Strong>Chapter 2. Introduction to Spices Market </Strong>
2.1. Market Overview
2.2. Key Statistics and Report Highlights
2.3. Scope of the Comprehensive Study
2.3.1. Market Definition
2.3.2 Countries and Regions Covered
2.3.3 Research Objective
2.3.4 Units, Currency, and Conversions
2.3.5 Industry Value Chain
2.4. Key Market Segments
2.5. Key Companies
2.6. Study Period
<Strong>Chapter 3. Strategic Analysis Review</Strong>
3.1. Spices Pricing Analysis and Forecast
3.2. Porter’s Five Forces
3.3. Market Ecosystem
3.4. SWOT Analysis
3.5. Regulatory Scenario
3.3. Effects of Inflation, Russia-Ukraine War, moderating economic growth, and other macroeconomic factors
<Strong>Chapter 4. Competitive Landscape</Strong>
4.1. Market Share Analysis
4.1.1. Global Spices Market Share by Company, 2023
4.1.2. Product Offerings of Leading Spices Companies
4.2. Market Entropy
4.2.1. New Product Launches in the Industry
4.2.2. Mergers, Acquisitions, Joint ventures, and Partnerships
4.3. Key Strategies and Best Practices
<Strong>Chapter 5. Global Market Projections: Best, Reference, and Low Case Scenarios</Strong>
5.1. Growth Analysis- Case Scenario Definitions
5.2. Low Growth Case Scenario Forecasts
5.3. Reference Growth Case Scenario Forecasts
5.4. High Growth Case Scenario Forecasts
<Strong>Chapter 6. Market Dynamics</Strong>
6.1. Spices Market Drivers
6.2. Spices Market Challenges
6.6. Spices Market Opportunities
6.4. Spices Market Trends
<Strong>Chapter 7. Global Spices Market Outlook Trends</Strong>
7.1. Global Spices Revenue (USD Million) and CAGR (%) by Type (2021-2032)
7.2. Global Spices Revenue (USD Million) and CAGR (%) by Application (2021-2032)
7.3. Global Spices Revenue (USD Million) and CAGR (%) by Product (2021-2032)
<Strong>By Product</Strong>
Pepper
Ginger
Cinnamon
Cumin
Turmeric
Cardamom
Coriander
Cloves
Others
<Strong>By Form</Strong>
Powder
Whole
Chopped/Crushed
<Strong>Chapter 8. Global Spices Regional Analysis and Outlook</Strong>
8.1. Global Spices Revenue (USD Million) By Regions (2021- 2032)
8.2. North America Spices Revenue (USD Million) by Country (2021-2032)
8.2.1. United States Spices Regional Analysis and Outlook
8.2.2. Canada Spices Regional Analysis and Outlook
8.2.3. Mexico Spices Regional Analysis and Outlook
8.3. Europe Spices Revenue (USD Million), by Country (2021-2032)
8.3.1. Germany Spices Regional Analysis and Outlook
8.3.2. France Spices Regional Analysis and Outlook
8.3.3. United Kingdom Spices Regional Analysis and Outlook
8.3.4. Spain Spices Regional Analysis and Outlook
8.3.5. Italy Spices Regional Analysis and Outlook
8.3.6. Russia Spices Regional Analysis and Outlook
8.3.7. Rest of Europe Spices Regional Analysis and Outlook
8.4. Asia Pacific Spices Revenue (USD Million) by Country (2021-2032)
8.4.1. China Spices Regional Analysis and Outlook
8.4.2. Japan Spices Regional Analysis and Outlook
8.4.3. India Spices Regional Analysis and Outlook
8.4.4. South Korea Spices Regional Analysis and Outlook
8.4.5. Australia Spices Regional Analysis and Outlook
8.4.6. South East Asia Spices Regional Analysis and Outlook
8.4.7. Rest of Asia Pacific Spices Regional Analysis and Outlook
8.5. South America Spices Revenue (USD Million), by Country (2021-2032)
8.5.1. Brazil Spices Regional Analysis and Outlook
8.5.2. Argentina Spices Regional Analysis and Outlook
8.5.3. Rest of South America Spices Regional Analysis and Outlook
8.6. Middle East and Africa Spices Revenue (USD Million) by Country (2021-2032)
8.6.1. Middle East Spices Regional Analysis and Outlook
8.6.2. Africa Spices Regional Analysis and Outlook
<Strong>Chapter 9. North America Spices Analysis and Outlook</Strong>
9.1. North America Spices Revenue (USD Million) by Segments (2021-2032)
9.1.1. North America Spices Revenue (USD Million) by Type (2021-2032)
9.1.2. North America Spices Revenue (USD Million) by Application (2021-2032)
9.1.3. North America Spices Revenue (USD Million) by Product (2021-2032)
<Strong>By Product</Strong>
Pepper
Ginger
Cinnamon
Cumin
Turmeric
Cardamom
Coriander
Cloves
Others
<Strong>By Form</Strong>
Powder
Whole
Chopped/Crushed
<Strong>Chapter 10. Europe Spices Analysis and Outlook</Strong>
10.1. Europe Spices Revenue (USD Million), by Segments (USD Million) (2021-2032)
10.1.1. Europe Spices Revenue (USD Million) by Type (2021-2032)
10.1.2. Europe Spices Revenue (USD Million) by Application (2021-2032)
10.1.3. Europe Spices Revenue (USD Million) by Product (2021-2032)
<Strong>By Product</Strong>
Pepper
Ginger
Cinnamon
Cumin
Turmeric
Cardamom
Coriander
Cloves
Others
<Strong>By Form</Strong>
Powder
Whole
Chopped/Crushed
<Strong>Chapter 11. Asia Pacific Spices Analysis and Outlook</Strong>
11.1. Asia Pacific Spices Revenue (USD Million), and Revenue (USD Million) by Segments (2021-2032)
11.1.1. Asia Pacific Spices Revenue (USD Million) by Type (2021-2032)
11.1.2. Asia Pacific Spices Revenue (USD Million) by Application (2021-2032)
11.1.3. Asia Pacific Spices Revenue (USD Million) by Product (2021-2032)
<Strong>By Product</Strong>
Pepper
Ginger
Cinnamon
Cumin
Turmeric
Cardamom
Coriander
Cloves
Others
<Strong>By Form</Strong>
Powder
Whole
Chopped/Crushed
<Strong>Chapter 12. South America Spices Analysis and Outlook</Strong>
12.1. South America Spices Revenue (USD Million), by Segments (2021-2032)
12.1.1. South America Spices Revenue (USD Million) by Type (2021-2032)
12.1.2. South America Spices Revenue (USD Million) by Application (2021-2032)
12.1.3. South America Spices Revenue (USD Million) by Product (2021-2032)
<Strong>By Product</Strong>
Pepper
Ginger
Cinnamon
Cumin
Turmeric
Cardamom
Coriander
Cloves
Others
<Strong>By Form</Strong>
Powder
Whole
Chopped/Crushed
<Strong>Chapter 13. Middle East and Africa Spices Analysis and Outlook</Strong>
13.1. Middle East and Africa Spices Revenue (USD Million), by Segments (2021-2032)
13.1.1. Middle East and Africa Spices Revenue (USD Million) by Type (2021-2032)
13.1.2. Middle East and Africa Spices Revenue (USD Million) by Application (2021-2032)
13.1.3. Middle East and Africa Spices Revenue (USD Million) by Product (2021-2032)
<Strong>By Product</Strong>
Pepper
Ginger
Cinnamon
Cumin
Turmeric
Cardamom
Coriander
Cloves
Others
<Strong>By Form</Strong>
Powder
Whole
Chopped/Crushed
<Strong>Chapter 14. Spices Company Profiles</Strong>
14.1 Business Overview
14.2 Product Profiles
14.3 SWOT Profiles
14.5 Recent Developments
14.6 Financial Profile
List of Companies
Dohler GmbH
DS Group
Elite Spice Inc
EVEREST Food Products Pvt. Ltd
Kerry Group Plc
Kikkoman Corp
Mahashian Di Hatti Pvt. Ltd
Master of Spices
McCormick and Company Inc
Olam Group Ltd
Oy Gustav Paulig Ab
ROYAL SPICES
SOLINA
The Bart Ingredients Co.
The Speculaas Spice Co. Ltd
Touton SA
UK Blending Ltd
<Strong>15. Methodology and Data Sources</Strong>
15.1 Customization Offerings
15.2 Subscription Services
15.3 Related Reports
15.4 Publisher Expertise
<Strong>LIST OF TABLES</Strong>
Table 1 Market Segmentation Analysis
Table 2 Global Spices Market Share of Leading Companies, 2023
Table 3 Product Offerings of Leading Companies
Table 4 Low Growth Scenario Forecasts
Table 5 Reference Case Growth Scenario
Table 6 High Growth Case Scenario
Table 7 Global Spices Revenue (USD Million) And CAGR (%) By Type (2021-2032)
Table 8 Global Spices Revenue (USD Million) And CAGR (%) By Application (2021-2032)
Table 9 Global Spices Revenue (USD Million) And CAGR (%) By Product (2021-2032)
Table 10 Global Spices Market Revenue (USD Million) By Regions (2021-2032)
Table 11 Global Spices Market Share (%) By Regions (2021-2032)
Table 12 North America Spices Revenue (USD Million) By Country (2021-2032)
Table 13 Europe Spices Revenue (USD Million) By Country (2021-2032)
Table 14 Asia Pacific Spices Revenue (USD Million) By Country (2021-2032)
Table 15 South America Spices Revenue (USD Million) By Country (2021-2032)
Table 16 Middle East and Africa Spices Revenue (USD Million) By Region (2021-2032)
Table 17 North America Spices Revenue (USD Million) By Type (2021-2032)
Table 18 North America Spices Revenue (USD Million) By Application (2021-2032)
Table 19 North America Spices Revenue (USD Million) By Product (2021-2032)
Table 20 Europe Spices Revenue (USD Million) By Type (2021-2032)
Table 21 Europe Spices Revenue (USD Million) By Application (2021-2032)
Table 22 Europe Spices Revenue (USD Million) By Product (2021-2032)
Table 23 Asia Pacific Spices Revenue (USD Million) By Type (2021-2032)
Table 24 Asia Pacific Spices Revenue (USD Million) By Application (2021-2032)
Table 25 Asia Pacific Spices Revenue (USD Million) By Product (2021-2032)
Table 26 South America Spices Revenue (USD Million) By Type (2021-2032)
Table 27 South America Spices Revenue (USD Million) By Application (2021-2032)
Table 28 South America Spices Revenue (USD Million) By Product (2021-2032)
Table 29 Middle East and Africa Spices Revenue (USD Million) By Type (2021-2032)
Table 30 Middle East and Africa Spices Revenue (USD Million) By Application (2021-2032)
Table 31 Middle East and Africa Spices Revenue (USD Million) By Product (2021-2032)
<Strong>LIST OF FIGURES</Strong>
Figure 1. Market Scope
Figure 2. Pricing Forecasts Per Unit, 2023- 2032
Figure 3. Porter’s Five Forces
Figure 4. Global Spices Market Revenue (USD Million) By Regions (2021-2032)
Figure 5. Global Spices Market Share (%) By Regions (2023)
Figure 6. North America Spices Revenue (USD Million) By Country (2021-2032)
Figure 7. United States Spices Revenue (USD Million) By Country (2021-2032)
Figure 8. Canada Spices Revenue (USD Million) By Country (2021-2032)
Figure 9. Mexico Spices Revenue (USD Million) By Country (2021-2032)
Figure 10. Europe Spices Revenue (USD Million) By Country (2021-2032)
Figure 11. Germany Spices Revenue (USD Million) By Country (2021-2032)
Figure 12. France Spices Revenue (USD Million) By Country (2021-2032)
Figure 13. United Kingdom Spices Revenue (USD Million) By Country (2021-2032)
Figure 14. Spain Spices Revenue (USD Million) By Country (2021-2032)
Figure 15. Italy Spices Revenue (USD Million) By Country (2021-2032)
Figure 16. Russia Spices Revenue (USD Million) By Country (2021-2032)
Figure 17. Rest of Europe Spices Revenue (USD Million) By Country (2021-2032)
Figure 11. Asia Pacific Spices Revenue (USD Million) By Country (2021-2032)
Figure 12. China Spices Revenue (USD Million) By Country (2021-2032)
Figure 13. Japan Spices Revenue (USD Million) By Country (2021-2032)
Figure 14. India Spices Revenue (USD Million) By Country (2021-2032)
Figure 15. South Korea Spices Revenue (USD Million) By Country (2021-2032)
Figure 16. Australia Spices Revenue (USD Million) By Country (2021-2032)
Figure 17. South East Asia Spices Revenue (USD Million) By Country (2021-2032)
Figure 18. South America Spices Revenue (USD Million) By Country (2021-2032)
Figure 19. Brazil Spices Revenue (USD Million) By Country (2021-2032)
Figure 20. Argentina Spices Revenue (USD Million) By Country (2021-2032)
Figure 21. Rest of Asia Pacific Spices Revenue (USD Million) By Country (2021-2032)
Figure 22. Middle East and Africa Spices Revenue (USD Million) By Region (2021-2032)
Figure 23. Saudi Arabia Spices Revenue (USD Million) By Region (2021-2032)
Figure 24. The UAE Spices Revenue (USD Million) By Region (2021-2032)
Figure 25. Rest of Middle East Spices Revenue (USD Million) By Region (2021-2032)
Figure 26. South Africa Spices Revenue (USD Million) By Region (2021-2032)
Figure 27. Africa Spices Revenue (USD Million) By Region (2021-2032)
Figure 28. North America Spices Revenue (USD Million) By Type (2021-2032)
Figure 29. North America Spices Revenue (USD Million) By Application (2021-2032)
Figure 30. North America Spices Revenue (USD Million) By Product (2021-2032)
Figure 31. Europe Spices Revenue (USD Million) By Type (2021-2032)
Figure 32. Europe Spices Revenue (USD Million) By Application (2021-2032)
Figure 33. Europe Spices Revenue (USD Million) By Product (2021-2032)
Figure 34. Asia Pacific Spices Revenue (USD Million) By Type (2021-2032)
Figure 35. Asia Pacific Spices Revenue (USD Million) By Application (2021-2032)
Figure 36. Asia Pacific Spices Revenue (USD Million) By Product (2021-2032)
Figure 37. South America Spices Revenue (USD Million) By Type (2021-2032)
Figure 38. South America Spices Revenue (USD Million) By Application (2021-2032)
Figure 39. South America Spices Revenue (USD Million) By Product (2021-2032)
Figure 40. Middle East and Africa Spices Revenue (USD Million) By Type (2021-2032)
Figure 41. Middle East and Africa Spices Revenue (USD Million) By Application (2021-2032)
Figure 42. Middle East and Africa Spices Revenue (USD Million) By Product (2021-2032)
