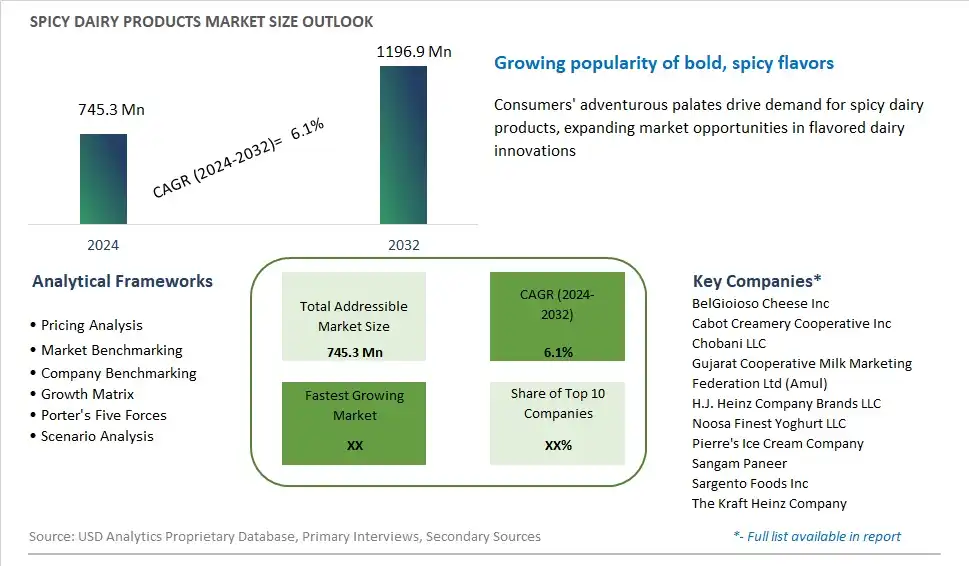
Global Spicy Dairy Products Market Size is valued at $745.3 Million in 2024 and is forecast to register a growth rate (CAGR) of 6.1% to reach $1196.9 Million by 2032.
The global Spicy Dairy Products Market Comprehensive Study analyzes and forecasts the market size across 6 regions and 24 countries for diverse segments -By Spices (Spicy Jalapeno, Cracked Black Pepper, Cheddar, Garlic, Chilly, Cardamom, Peppered Pepper Jack, Herbs, Others), By Form (Solid, Liquid, Others), By Product (Buttermilk, Yogurt, Cheese, Condensed Milk, Ice Cream, Curd, Paneer, Butter, Processed Milk Casein, Others)
An Introduction to Spicy Dairy Products Market
In 2024, the spicy dairy products market is experiencing growth as consumers seek bold and adventurous flavor experiences in their dairy consumption. This market segment encompasses a variety of products, including spicy cheeses, flavored yogurts, and spicy dips and spreads, offering consumers a diverse range of options to satisfy their cravings for heat and flavor. Manufacturers are innovating with unique spice blends and chili varieties to create products that deliver a balance of creaminess and spice, appealing to a wide range of palates. As consumers continue to explore new culinary trends and flavor sensations, the spicy dairy products market is poised for continued expansion as an exciting and flavorful category within the dairy industry.
Spicy Dairy Products Competitive Landscape
The market report analyses the leading companies in the industry including BelGioioso Cheese Inc, Cabot Creamery Cooperative Inc, Chobani LLC, Gujarat Cooperative Milk Marketing Federation Ltd (Amul), H.J. Heinz Company Brands LLC, Noosa Finest Yoghurt LLC, Pierre's Ice Cream Company, Sangam Paneer, Sargento Foods Inc, The Kraft Heinz Company, and Others.
Spicy Dairy Products Market Dynamics
Spicy Dairy Products Market Trend: Growing Demand for Spicy Flavors in Dairy
Consumers' increasing interest in bold and adventurous flavors has led to a noticeable trend in the dairy market towards spicy dairy products. Spicy flavors, such as jalapeño, sriracha, or chipotle, are gaining popularity among consumers seeking unique taste experiences. This trend is driven by the desire for excitement and novelty in food choices, as well as the influence of diverse culinary traditions from around the world. As a result, manufacturers are expanding their product offerings to include spicy variants of traditional dairy products like cheese, yogurt, and spreads to cater to this evolving consumer preference.
Market Driver: Flavor Innovation and Differentiation
Flavor innovation and differentiation serve as significant drivers behind the growth of spicy dairy products. In a crowded dairy market, manufacturers are constantly seeking ways to stand out and capture consumers' attention. Introducing spicy flavors into dairy products presents an opportunity for differentiation and innovation, allowing brands to offer unique and exciting options that appeal to adventurous consumers. By leveraging spicy ingredients and creative flavor profiles, dairy producers can attract new consumers and retain existing ones, driving sales and market growth.
Market Opportunity: Expansion of Product Portfolio and Market Reach
An opportunity for growth in the spicy dairy products market lies in the expansion of product portfolios and market reach. Brands can capitalize on the growing demand for spicy flavors by introducing a diverse range of products beyond traditional offerings. This includes exploring new dairy categories such as spicy cream cheese, spicy flavored milk, or spicy dips and sauces. Furthermore, there is potential for expansion into new geographic markets and consumer segments, including regions with a strong affinity for spicy cuisine and consumers seeking adventurous taste experiences. By broadening their product range and market presence, dairy manufacturers can tap into untapped opportunities and drive revenue growth.
Spicy Dairy Products Market Share Analysis: Cheddar Dominates as the Leading Spice Flavor held the dominant market share in 2024
Within the diverse array of spicy dairy products, the cheddar segment is the largest and most influential player, commanding a significant portion of the market share. Cheddar's widespread popularity stems from its bold and savory flavor profile, which appeals to a broad spectrum of consumers across various demographics. Whether incorporated into cheese spreads, dips, or flavored cheeses, cheddar adds a distinct and irresistible zest to dairy products, making it a staple in households and food establishments alike. Further, cheddar's versatility allows for seamless integration into a multitude of culinary creations, ranging from traditional dishes to innovative gourmet offerings. As consumers increasingly seek flavor diversity and indulgent experiences, the demand for cheddar-infused dairy products continues to soar, solidifying its position as the dominant spice flavor in the spicy dairy products market.
Spicy Dairy Products Market Share Analysis: Liquid Form market is poised to register the fastest growth rae over the forecast period to 2032
In the dynamic landscape of the spicy dairy products market, the liquid form segment stands out as the fastest-growing category, experiencing remarkable expansion driven by evolving consumer preferences and culinary trends. Liquid spicy dairy products offer unparalleled versatility and convenience, allowing for easy incorporation into a wide range of recipes, including sauces, dressings, and beverages. This form facilitates seamless blending of spices with dairy bases, resulting in rich and flavorful culinary experiences. Additionally, the liquid format enables manufacturers to experiment with innovative flavor combinations and product formulations, catering to the increasingly adventurous palates of consumers. Further, the rise of health-conscious consumer preferences has fueled the demand for functional and nutritious liquid dairy products infused with spicy elements, further propelling the growth of this segment. As a result, the liquid form segment emerges as a pivotal driver of growth within the spicy dairy products market, reshaping the industry landscape and offering exciting opportunities for innovation and expansion.
Spicy Dairy Products Market Share Analysis: Cheese Reigns held the dominant market share in 2024
Amidst the diverse array of spicy dairy products, the cheese segment is the largest and most influential category, commanding a substantial portion of the market share. Cheese's widespread popularity stems from its versatility, as it serves as a cornerstone ingredient in a multitude of culinary applications, ranging from appetizers to main courses and even desserts. The inherent richness and tanginess of cheese provide an ideal canvas for the infusion of spicy flavors, creating a tantalizing blend that appeals to a broad spectrum of consumers. Further, cheese's extended shelf life and suitability for both fresh and aged varieties contribute to its enduring appeal among consumers and food manufacturers alike. As consumers increasingly seek indulgent and flavor-rich culinary experiences, the demand for spicy cheese products continues to soar, solidifying cheese as the undisputed leader in the spicy dairy products market.
Spicy Dairy Products Market Segmentation
By Spices
Spicy Jalapeno
Cracked Black Pepper
Cheddar
Garlic
Chilly
Cardamom
Peppered Pepper Jack
Herbs
Others
By Form
Solid
Liquid
Others
By Product
Buttermilk
Yogurt
Cheese
Condensed Milk
Ice Cream
Curd
Paneer
Butter
Processed Milk Casein
Others
Countries Analyzed
North America (US, Canada, Mexico)
Europe (Germany, UK, France, Spain, Italy, Russia, Rest of Europe)
Asia Pacific (China, India, Japan, South Korea, Australia, South East Asia, Rest of Asia)
South America (Brazil, Argentina, Rest of South America)
Middle East and Africa (Saudi Arabia, UAE, Rest of Middle East, South Africa, Egypt, Rest of Africa)
Spicy Dairy Products Companies Profiled in the Study
BelGioioso Cheese Inc
Cabot Creamery Cooperative Inc
Chobani LLC
Gujarat Cooperative Milk Marketing Federation Ltd (Amul)
H.J. Heinz Company Brands LLC
Noosa Finest Yoghurt LLC
Pierre's Ice Cream Company
Sangam Paneer
Sargento Foods Inc
The Kraft Heinz Company
*- List Not Exhaustive
Chapter 1. TABLE OF CONTENTS
Chapter 2. Introduction to Spicy Dairy Products Market
2.1. Market Overview
2.2. Key Statistics and Report Highlights
2.3. Scope of the Comprehensive Study
2.3.1. Market Definition
2.3.2 Countries and Regions Covered
2.3.3 Research Objective
2.3.4 Units, Currency, and Conversions
2.3.5 Industry Value Chain
2.4. Key Market Segments
2.5. Key Companies
2.6. Study Period
Chapter 3. Strategic Analysis Review
3.1. Spicy Dairy Products Pricing Analysis and Forecast
3.2. Porter’s Five Forces
3.3. Market Ecosystem
3.4. SWOT Analysis
3.5. Regulatory Scenario
3.3. Effects of Inflation, Russia-Ukraine War, moderating economic growth, and other macroeconomic factors
Chapter 4. Competitive Landscape
4.1. Market Share Analysis
4.1.1. Global Spicy Dairy Products Market Share by Company, 2023
4.1.2. Product Offerings of Leading Spicy Dairy Products Companies
4.2. Market Entropy
4.2.1. New Product Launches in the Industry
4.2.2. Mergers, Acquisitions, Joint ventures, and Partnerships
4.3. Key Strategies and Best Practices
Chapter 5. Global Market Projections: Best, Reference, and Low Case Scenarios
5.1. Growth Analysis- Case Scenario Definitions
5.2. Low Growth Case Scenario Forecasts
5.3. Reference Growth Case Scenario Forecasts
5.4. High Growth Case Scenario Forecasts
Chapter 6. Market Dynamics
6.1. Spicy Dairy Products Market Drivers
6.2. Spicy Dairy Products Market Challenges
6.6. Spicy Dairy Products Market Opportunities
6.4. Spicy Dairy Products Market Trends
Chapter 7. Global Spicy Dairy Products Market Outlook Trends
7.1. Global Spicy Dairy Products Revenue (USD Million) and CAGR (%) by Type (2021-2032)
7.2. Global Spicy Dairy Products Revenue (USD Million) and CAGR (%) by Application (2021-2032)
7.3. Global Spicy Dairy Products Revenue (USD Million) and CAGR (%) by Product (2021-2032)
By Spices
Spicy Jalapeno
Cracked Black Pepper
Cheddar
Garlic
Chilly
Cardamom
Peppered Pepper Jack
Herbs
Others
By Form
Solid
Liquid
Others
By Product
Buttermilk
Yogurt
Cheese
Condensed Milk
Ice Cream
Curd
Paneer
Butter
Processed Milk Casein
Others
Chapter 8. Global Spicy Dairy Products Regional Analysis and Outlook
8.1. Global Spicy Dairy Products Revenue (USD Million) By Regions (2021- 2032)
8.2. North America Spicy Dairy Products Revenue (USD Million) by Country (2021-2032)
8.2.1. United States Spicy Dairy Products Regional Analysis and Outlook
8.2.2. Canada Spicy Dairy Products Regional Analysis and Outlook
8.2.3. Mexico Spicy Dairy Products Regional Analysis and Outlook
8.3. Europe Spicy Dairy Products Revenue (USD Million), by Country (2021-2032)
8.3.1. Germany Spicy Dairy Products Regional Analysis and Outlook
8.3.2. France Spicy Dairy Products Regional Analysis and Outlook
8.3.3. United Kingdom Spicy Dairy Products Regional Analysis and Outlook
8.3.4. Spain Spicy Dairy Products Regional Analysis and Outlook
8.3.5. Italy Spicy Dairy Products Regional Analysis and Outlook
8.3.6. Russia Spicy Dairy Products Regional Analysis and Outlook
8.3.7. Rest of Europe Spicy Dairy Products Regional Analysis and Outlook
8.4. Asia Pacific Spicy Dairy Products Revenue (USD Million) by Country (2021-2032)
8.4.1. China Spicy Dairy Products Regional Analysis and Outlook
8.4.2. Japan Spicy Dairy Products Regional Analysis and Outlook
8.4.3. India Spicy Dairy Products Regional Analysis and Outlook
8.4.4. South Korea Spicy Dairy Products Regional Analysis and Outlook
8.4.5. Australia Spicy Dairy Products Regional Analysis and Outlook
8.4.6. South East Asia Spicy Dairy Products Regional Analysis and Outlook
8.4.7. Rest of Asia Pacific Spicy Dairy Products Regional Analysis and Outlook
8.5. South America Spicy Dairy Products Revenue (USD Million), by Country (2021-2032)
8.5.1. Brazil Spicy Dairy Products Regional Analysis and Outlook
8.5.2. Argentina Spicy Dairy Products Regional Analysis and Outlook
8.5.3. Rest of South America Spicy Dairy Products Regional Analysis and Outlook
8.6. Middle East and Africa Spicy Dairy Products Revenue (USD Million) by Country (2021-2032)
8.6.1. Middle East Spicy Dairy Products Regional Analysis and Outlook
8.6.2. Africa Spicy Dairy Products Regional Analysis and Outlook
Chapter 9. North America Spicy Dairy Products Analysis and Outlook
9.1. North America Spicy Dairy Products Revenue (USD Million) by Segments (2021-2032)
9.1.1. North America Spicy Dairy Products Revenue (USD Million) by Type (2021-2032)
9.1.2. North America Spicy Dairy Products Revenue (USD Million) by Application (2021-2032)
9.1.3. North America Spicy Dairy Products Revenue (USD Million) by Product (2021-2032)
By Spices
Spicy Jalapeno
Cracked Black Pepper
Cheddar
Garlic
Chilly
Cardamom
Peppered Pepper Jack
Herbs
Others
By Form
Solid
Liquid
Others
By Product
Buttermilk
Yogurt
Cheese
Condensed Milk
Ice Cream
Curd
Paneer
Butter
Processed Milk Casein
Others
Chapter 10. Europe Spicy Dairy Products Analysis and Outlook
10.1. Europe Spicy Dairy Products Revenue (USD Million), by Segments (USD Million) (2021-2032)
10.1.1. Europe Spicy Dairy Products Revenue (USD Million) by Type (2021-2032)
10.1.2. Europe Spicy Dairy Products Revenue (USD Million) by Application (2021-2032)
10.1.3. Europe Spicy Dairy Products Revenue (USD Million) by Product (2021-2032)
By Spices
Spicy Jalapeno
Cracked Black Pepper
Cheddar
Garlic
Chilly
Cardamom
Peppered Pepper Jack
Herbs
Others
By Form
Solid
Liquid
Others
By Product
Buttermilk
Yogurt
Cheese
Condensed Milk
Ice Cream
Curd
Paneer
Butter
Processed Milk Casein
Others
Chapter 11. Asia Pacific Spicy Dairy Products Analysis and Outlook
11.1. Asia Pacific Spicy Dairy Products Revenue (USD Million), and Revenue (USD Million) by Segments (2021-2032)
11.1.1. Asia Pacific Spicy Dairy Products Revenue (USD Million) by Type (2021-2032)
11.1.2. Asia Pacific Spicy Dairy Products Revenue (USD Million) by Application (2021-2032)
11.1.3. Asia Pacific Spicy Dairy Products Revenue (USD Million) by Product (2021-2032)
By Spices
Spicy Jalapeno
Cracked Black Pepper
Cheddar
Garlic
Chilly
Cardamom
Peppered Pepper Jack
Herbs
Others
By Form
Solid
Liquid
Others
By Product
Buttermilk
Yogurt
Cheese
Condensed Milk
Ice Cream
Curd
Paneer
Butter
Processed Milk Casein
Others
Chapter 12. South America Spicy Dairy Products Analysis and Outlook
12.1. South America Spicy Dairy Products Revenue (USD Million), by Segments (2021-2032)
12.1.1. South America Spicy Dairy Products Revenue (USD Million) by Type (2021-2032)
12.1.2. South America Spicy Dairy Products Revenue (USD Million) by Application (2021-2032)
12.1.3. South America Spicy Dairy Products Revenue (USD Million) by Product (2021-2032)
By Spices
Spicy Jalapeno
Cracked Black Pepper
Cheddar
Garlic
Chilly
Cardamom
Peppered Pepper Jack
Herbs
Others
By Form
Solid
Liquid
Others
By Product
Buttermilk
Yogurt
Cheese
Condensed Milk
Ice Cream
Curd
Paneer
Butter
Processed Milk Casein
Others
Chapter 13. Middle East and Africa Spicy Dairy Products Analysis and Outlook
13.1. Middle East and Africa Spicy Dairy Products Revenue (USD Million), by Segments (2021-2032)
13.1.1. Middle East and Africa Spicy Dairy Products Revenue (USD Million) by Type (2021-2032)
13.1.2. Middle East and Africa Spicy Dairy Products Revenue (USD Million) by Application (2021-2032)
13.1.3. Middle East and Africa Spicy Dairy Products Revenue (USD Million) by Product (2021-2032)
By Spices
Spicy Jalapeno
Cracked Black Pepper
Cheddar
Garlic
Chilly
Cardamom
Peppered Pepper Jack
Herbs
Others
By Form
Solid
Liquid
Others
By Product
Buttermilk
Yogurt
Cheese
Condensed Milk
Ice Cream
Curd
Paneer
Butter
Processed Milk Casein
Others
Chapter 14. Spicy Dairy Products Company Profiles
14.1 Business Overview
14.2 Product Profiles
14.3 SWOT Profiles
14.5 Recent Developments
14.6 Financial Profile
List of Companies
BelGioioso Cheese Inc
Cabot Creamery Cooperative Inc
Chobani LLC
Gujarat Cooperative Milk Marketing Federation Ltd (Amul)
H.J. Heinz Company Brands LLC
Noosa Finest Yoghurt LLC
Pierre's Ice Cream Company
Sangam Paneer
Sargento Foods Inc
The Kraft Heinz Company
15. Methodology and Data Sources
15.1 Customization Offerings
15.2 Subscription Services
15.3 Related Reports
15.4 Publisher Expertise
LIST OF TABLES
Table 1 Market Segmentation Analysis
Table 2 Global Spicy Dairy Products Market Share of Leading Companies, 2023
Table 3 Product Offerings of Leading Companies
Table 4 Low Growth Scenario Forecasts
Table 5 Reference Case Growth Scenario
Table 6 High Growth Case Scenario
Table 7 Global Spicy Dairy Products Revenue (USD Million) And CAGR (%) By Type (2021-2032)
Table 8 Global Spicy Dairy Products Revenue (USD Million) And CAGR (%) By Application (2021-2032)
Table 9 Global Spicy Dairy Products Revenue (USD Million) And CAGR (%) By Product (2021-2032)
Table 10 Global Spicy Dairy Products Market Revenue (USD Million) By Regions (2021-2032)
Table 11 Global Spicy Dairy Products Market Share (%) By Regions (2021-2032)
Table 12 North America Spicy Dairy Products Revenue (USD Million) By Country (2021-2032)
Table 13 Europe Spicy Dairy Products Revenue (USD Million) By Country (2021-2032)
Table 14 Asia Pacific Spicy Dairy Products Revenue (USD Million) By Country (2021-2032)
Table 15 South America Spicy Dairy Products Revenue (USD Million) By Country (2021-2032)
Table 16 Middle East and Africa Spicy Dairy Products Revenue (USD Million) By Region (2021-2032)
Table 17 North America Spicy Dairy Products Revenue (USD Million) By Type (2021-2032)
Table 18 North America Spicy Dairy Products Revenue (USD Million) By Application (2021-2032)
Table 19 North America Spicy Dairy Products Revenue (USD Million) By Product (2021-2032)
Table 20 Europe Spicy Dairy Products Revenue (USD Million) By Type (2021-2032)
Table 21 Europe Spicy Dairy Products Revenue (USD Million) By Application (2021-2032)
Table 22 Europe Spicy Dairy Products Revenue (USD Million) By Product (2021-2032)
Table 23 Asia Pacific Spicy Dairy Products Revenue (USD Million) By Type (2021-2032)
Table 24 Asia Pacific Spicy Dairy Products Revenue (USD Million) By Application (2021-2032)
Table 25 Asia Pacific Spicy Dairy Products Revenue (USD Million) By Product (2021-2032)
Table 26 South America Spicy Dairy Products Revenue (USD Million) By Type (2021-2032)
Table 27 South America Spicy Dairy Products Revenue (USD Million) By Application (2021-2032)
Table 28 South America Spicy Dairy Products Revenue (USD Million) By Product (2021-2032)
Table 29 Middle East and Africa Spicy Dairy Products Revenue (USD Million) By Type (2021-2032)
Table 30 Middle East and Africa Spicy Dairy Products Revenue (USD Million) By Application (2021-2032)
Table 31 Middle East and Africa Spicy Dairy Products Revenue (USD Million) By Product (2021-2032)
LIST OF FIGURES
Figure 1. Market Scope
Figure 2. Pricing Forecasts Per Unit, 2023- 2032
Figure 3. Porter’s Five Forces
Figure 4. Global Spicy Dairy Products Market Revenue (USD Million) By Regions (2021-2032)
Figure 5. Global Spicy Dairy Products Market Share (%) By Regions (2023)
Figure 6. North America Spicy Dairy Products Revenue (USD Million) By Country (2021-2032)
Figure 7. United States Spicy Dairy Products Revenue (USD Million) By Country (2021-2032)
Figure 8. Canada Spicy Dairy Products Revenue (USD Million) By Country (2021-2032)
Figure 9. Mexico Spicy Dairy Products Revenue (USD Million) By Country (2021-2032)
Figure 10. Europe Spicy Dairy Products Revenue (USD Million) By Country (2021-2032)
Figure 11. Germany Spicy Dairy Products Revenue (USD Million) By Country (2021-2032)
Figure 12. France Spicy Dairy Products Revenue (USD Million) By Country (2021-2032)
Figure 13. United Kingdom Spicy Dairy Products Revenue (USD Million) By Country (2021-2032)
Figure 14. Spain Spicy Dairy Products Revenue (USD Million) By Country (2021-2032)
Figure 15. Italy Spicy Dairy Products Revenue (USD Million) By Country (2021-2032)
Figure 16. Russia Spicy Dairy Products Revenue (USD Million) By Country (2021-2032)
Figure 17. Rest of Europe Spicy Dairy Products Revenue (USD Million) By Country (2021-2032)
Figure 11. Asia Pacific Spicy Dairy Products Revenue (USD Million) By Country (2021-2032)
Figure 12. China Spicy Dairy Products Revenue (USD Million) By Country (2021-2032)
Figure 13. Japan Spicy Dairy Products Revenue (USD Million) By Country (2021-2032)
Figure 14. India Spicy Dairy Products Revenue (USD Million) By Country (2021-2032)
Figure 15. South Korea Spicy Dairy Products Revenue (USD Million) By Country (2021-2032)
Figure 16. Australia Spicy Dairy Products Revenue (USD Million) By Country (2021-2032)
Figure 17. South East Asia Spicy Dairy Products Revenue (USD Million) By Country (2021-2032)
Figure 18. South America Spicy Dairy Products Revenue (USD Million) By Country (2021-2032)
Figure 19. Brazil Spicy Dairy Products Revenue (USD Million) By Country (2021-2032)
Figure 20. Argentina Spicy Dairy Products Revenue (USD Million) By Country (2021-2032)
Figure 21. Rest of Asia Pacific Spicy Dairy Products Revenue (USD Million) By Country (2021-2032)
Figure 22. Middle East and Africa Spicy Dairy Products Revenue (USD Million) By Region (2021-2032)
Figure 23. Saudi Arabia Spicy Dairy Products Revenue (USD Million) By Region (2021-2032)
Figure 24. The UAE Spicy Dairy Products Revenue (USD Million) By Region (2021-2032)
Figure 25. Rest of Middle East Spicy Dairy Products Revenue (USD Million) By Region (2021-2032)
Figure 26. South Africa Spicy Dairy Products Revenue (USD Million) By Region (2021-2032)
Figure 27. Africa Spicy Dairy Products Revenue (USD Million) By Region (2021-2032)
Figure 28. North America Spicy Dairy Products Revenue (USD Million) By Type (2021-2032)
Figure 29. North America Spicy Dairy Products Revenue (USD Million) By Application (2021-2032)
Figure 30. North America Spicy Dairy Products Revenue (USD Million) By Product (2021-2032)
Figure 31. Europe Spicy Dairy Products Revenue (USD Million) By Type (2021-2032)
Figure 32. Europe Spicy Dairy Products Revenue (USD Million) By Application (2021-2032)
Figure 33. Europe Spicy Dairy Products Revenue (USD Million) By Product (2021-2032)
Figure 34. Asia Pacific Spicy Dairy Products Revenue (USD Million) By Type (2021-2032)
Figure 35. Asia Pacific Spicy Dairy Products Revenue (USD Million) By Application (2021-2032)
Figure 36. Asia Pacific Spicy Dairy Products Revenue (USD Million) By Product (2021-2032)
Figure 37. South America Spicy Dairy Products Revenue (USD Million) By Type (2021-2032)
Figure 38. South America Spicy Dairy Products Revenue (USD Million) By Application (2021-2032)
Figure 39. South America Spicy Dairy Products Revenue (USD Million) By Product (2021-2032)
Figure 40. Middle East and Africa Spicy Dairy Products Revenue (USD Million) By Type (2021-2032)
Figure 41. Middle East and Africa Spicy Dairy Products Revenue (USD Million) By Application (2021-2032)
Figure 42. Middle East and Africa Spicy Dairy Products Revenue (USD Million) By Product (2021-2032)
By Spices
Spicy Jalapeno
Cracked Black Pepper
Cheddar
Garlic
Chilly
Cardamom
Peppered Pepper Jack
Herbs
Others
By Form
Solid
Liquid
Others
By Product
Buttermilk
Yogurt
Cheese
Condensed Milk
Ice Cream
Curd
Paneer
Butter
Processed Milk Casein
Others
Countries Analyzed
North America (US, Canada, Mexico)
Europe (Germany, UK, France, Spain, Italy, Russia, Rest of Europe)
Asia Pacific (China, India, Japan, South Korea, Australia, South East Asia, Rest of Asia)
South America (Brazil, Argentina, Rest of South America)
Middle East and Africa (Saudi Arabia, UAE, Rest of Middle East, South Africa, Egypt, Rest of Africa)
