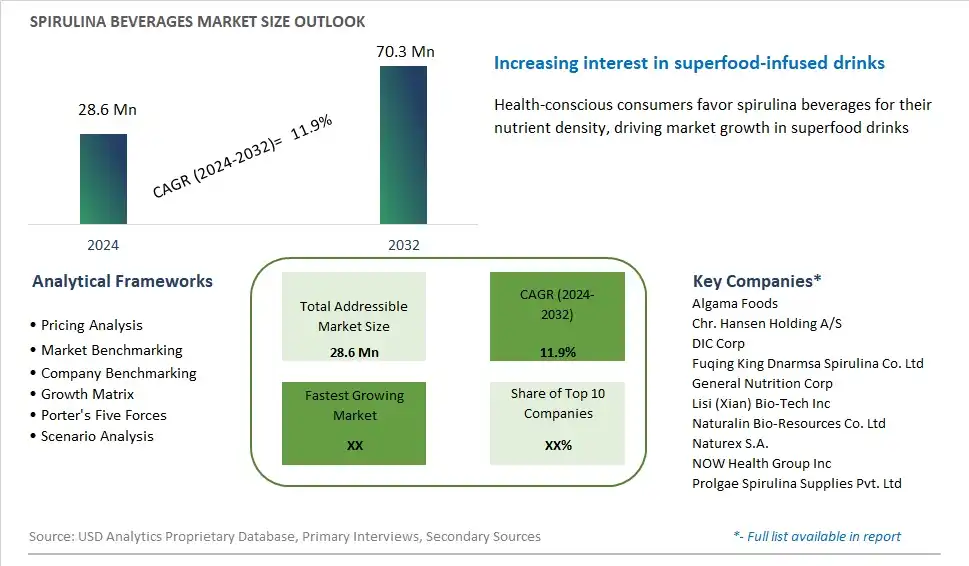
Global Spirulina Beverages Market Size is valued at $28.6 Million in 2024 and is forecast to register a growth rate (CAGR) of 11.9% to reach $70.3 Million by 2032.
The global Spirulina Beverages Market Comprehensive Study analyzes and forecasts the market size across 6 regions and 24 countries for diverse segments -By Nature (Organic, Conventional), By Distribution Channel (Hypermarkets/Supermarkets, Online Retail, Others)
An Introduction to Spirulina Beverages Market
Spirulina beverages have emerged as a niche but rapidly growing segment of the health and wellness market in 2024, driven by increasing consumer interest in plant-based nutrition and functional beverages. Spirulina, a nutrient-rich blue-green algae, is prized for its high protein content, antioxidant properties, and potential health benefits. In response to growing demand, manufacturers are introducing a variety of spirulina-based beverages, including smoothies, juices, and flavored waters, that offer a convenient and refreshing way to incorporate this superfood into daily diets. With an emphasis on natural ingredients and functional benefits, spirulina beverages appeal to health-conscious consumers seeking nutrient-dense alternatives to traditional soft drinks and energy drinks. As awareness of spirulina's health benefits continues to grow, this market segment is poised for further expansion and innovation in the years to come.
Spirulina Beverages Competitive Landscape
The market report analyses the leading companies in the industry including Algama Foods, Chr. Hansen Holding A/S, DIC Corp, Fuqing King Dnarmsa Spirulina Co. Ltd, General Nutrition Corp, Lisi (Xian) Bio-Tech Inc, Naturalin Bio-Resources Co. Ltd, Naturex S.A., NOW Health Group Inc, Prolgae Spirulina Supplies Pvt. Ltd, and Others.
Spirulina Beverages Market Dynamics
Spirulina Beverages Market Trend: Growing Interest in Health and Wellness Beverages
The market for Spirulina beverages is witnessing a prominent trend driven by the increasing consumer focus on health and wellness. Spirulina, a nutrient-rich blue-green algae, is recognized for its numerous health benefits, including high protein content, antioxidants, vitamins, and minerals. As consumers become more health-conscious and seek functional beverages that offer nutritional benefits, the demand for Spirulina-infused beverages is on the rise. This trend aligns with the broader movement towards natural and functional ingredients in the beverage industry, reflecting consumers' desire for healthier beverage options.
Market Driver: Rising Demand for Plant-Based Functional Beverages
One of the primary drivers behind the growth of Spirulina beverages is the rising demand for plant-based functional beverages. As consumers increasingly prioritize plant-based diets and seek alternatives to traditional sugary or artificially flavored drinks, there is a growing market for beverages that offer both health benefits and functionality. Spirulina, with its dense nutritional profile and potential health-promoting properties, is well-positioned to meet this demand. The market is being driven by consumers seeking beverages that not only quench their thirst but also contribute to their overall well-being, driving the adoption of Spirulina-infused beverages.
Market Opportunity: Product Innovation and Diversification
An opportunity for further growth in the Spirulina beverage market lies in product innovation and diversification. Brands can capitalize on the increasing consumer interest in functional beverages by introducing a variety of Spirulina-infused drinks beyond traditional offerings such as juices and smoothies. This includes exploring new beverage categories such as sparkling water, energy drinks, or ready-to-drink teas enhanced with Spirulina. Additionally, there is potential for the development of innovative flavor combinations and formulations that cater to different consumer preferences and occasions. By continuously innovating and diversifying their product portfolios, companies can expand their market presence and capture a larger share of the growing health and wellness beverage market.
Spirulina Beverages Market Share Analysis: Organic held the dominant market share in 2024
Within the Spirulina Beverages Market, the Organic segment stands as the largest, driven by the growing consumer preference for natural and sustainably sourced products. Organic Spirulina beverages resonate with health-conscious consumers seeking clean label options free from synthetic additives and pesticides. The organic certification assures consumers of the product's adherence to strict quality and environmental standards, aligning with their desire for ethical and eco-friendly choices. Further, the inherent nutritional benefits of Spirulina, coupled with the purity of organic cultivation methods, contribute to the segment's dominance. As consumers prioritize health and wellness, the demand for Organic Spirulina beverages continues to rise, solidifying its position as the leading segment in the market.
Spirulina Beverages Market Share Analysis: Online Retail Is the Rapidly Expanding Frontier market is poised to register the fastest growth rae over the forecast period to 2032
In the dynamic landscape of the Spirulina Beverages Market, Online Retail is the fastest-growing segment, fueled by the increasing consumer inclination towards e-commerce platforms for convenient and accessible shopping experiences. The rise of online retail channels provides Spirulina beverage manufacturers with a broader reach and the ability to connect directly with health-conscious consumers seeking functional and innovative products. Additionally, the convenience of doorstep delivery, coupled with the availability of a wide range of Spirulina beverage options online, contributes to the segment's rapid growth. Furthermore, the COVID-19 pandemic has accelerated the shift towards online shopping, as consumers prioritize safety and social distancing measures. As a result, Online Retail emerges as a pivotal distribution channel driving the expansion of the Spirulina Beverages Market, offering significant opportunities for manufacturers to capitalize on changing consumer behaviors and preferences.
Spirulina Beverages Market Segmentation
By Nature
Organic
Conventional
By Distribution Channel
Hypermarkets/Supermarkets
Online Retail
Others
Countries Analyzed
North America (US, Canada, Mexico)
Europe (Germany, UK, France, Spain, Italy, Russia, Rest of Europe)
Asia Pacific (China, India, Japan, South Korea, Australia, South East Asia, Rest of Asia)
South America (Brazil, Argentina, Rest of South America)
Middle East and Africa (Saudi Arabia, UAE, Rest of Middle East, South Africa, Egypt, Rest of Africa)
Spirulina Beverages Companies Profiled in the Study
Algama Foods
Chr. Hansen Holding A/S
DIC Corp
Fuqing King Dnarmsa Spirulina Co. Ltd
General Nutrition Corp
Lisi (Xian) Bio-Tech Inc
Naturalin Bio-Resources Co. Ltd
Naturex S.A.
NOW Health Group Inc
Prolgae Spirulina Supplies Pvt. Ltd
*- List Not Exhaustive
Chapter 1. TABLE OF CONTENTS
Chapter 2. Introduction to Spirulina Beverages Market
2.1. Market Overview
2.2. Key Statistics and Report Highlights
2.3. Scope of the Comprehensive Study
2.3.1. Market Definition
2.3.2 Countries and Regions Covered
2.3.3 Research Objective
2.3.4 Units, Currency, and Conversions
2.3.5 Industry Value Chain
2.4. Key Market Segments
2.5. Key Companies
2.6. Study Period
Chapter 3. Strategic Analysis Review
3.1. Spirulina Beverages Pricing Analysis and Forecast
3.2. Porter’s Five Forces
3.3. Market Ecosystem
3.4. SWOT Analysis
3.5. Regulatory Scenario
3.3. Effects of Inflation, Russia-Ukraine War, moderating economic growth, and other macroeconomic factors
Chapter 4. Competitive Landscape
4.1. Market Share Analysis
4.1.1. Global Spirulina Beverages Market Share by Company, 2023
4.1.2. Product Offerings of Leading Spirulina Beverages Companies
4.2. Market Entropy
4.2.1. New Product Launches in the Industry
4.2.2. Mergers, Acquisitions, Joint ventures, and Partnerships
4.3. Key Strategies and Best Practices
Chapter 5. Global Market Projections: Best, Reference, and Low Case Scenarios
5.1. Growth Analysis- Case Scenario Definitions
5.2. Low Growth Case Scenario Forecasts
5.3. Reference Growth Case Scenario Forecasts
5.4. High Growth Case Scenario Forecasts
Chapter 6. Market Dynamics
6.1. Spirulina Beverages Market Drivers
6.2. Spirulina Beverages Market Challenges
6.6. Spirulina Beverages Market Opportunities
6.4. Spirulina Beverages Market Trends
Chapter 7. Global Spirulina Beverages Market Outlook Trends
7.1. Global Spirulina Beverages Revenue (USD Million) and CAGR (%) by Type (2021-2032)
7.2. Global Spirulina Beverages Revenue (USD Million) and CAGR (%) by Application (2021-2032)
7.3. Global Spirulina Beverages Revenue (USD Million) and CAGR (%) by Product (2021-2032)
By Nature
Organic
Conventional
By Distribution Channel
Hypermarkets/Supermarkets
Online Retail
Others
Chapter 8. Global Spirulina Beverages Regional Analysis and Outlook
8.1. Global Spirulina Beverages Revenue (USD Million) By Regions (2021- 2032)
8.2. North America Spirulina Beverages Revenue (USD Million) by Country (2021-2032)
8.2.1. United States Spirulina Beverages Regional Analysis and Outlook
8.2.2. Canada Spirulina Beverages Regional Analysis and Outlook
8.2.3. Mexico Spirulina Beverages Regional Analysis and Outlook
8.3. Europe Spirulina Beverages Revenue (USD Million), by Country (2021-2032)
8.3.1. Germany Spirulina Beverages Regional Analysis and Outlook
8.3.2. France Spirulina Beverages Regional Analysis and Outlook
8.3.3. United Kingdom Spirulina Beverages Regional Analysis and Outlook
8.3.4. Spain Spirulina Beverages Regional Analysis and Outlook
8.3.5. Italy Spirulina Beverages Regional Analysis and Outlook
8.3.6. Russia Spirulina Beverages Regional Analysis and Outlook
8.3.7. Rest of Europe Spirulina Beverages Regional Analysis and Outlook
8.4. Asia Pacific Spirulina Beverages Revenue (USD Million) by Country (2021-2032)
8.4.1. China Spirulina Beverages Regional Analysis and Outlook
8.4.2. Japan Spirulina Beverages Regional Analysis and Outlook
8.4.3. India Spirulina Beverages Regional Analysis and Outlook
8.4.4. South Korea Spirulina Beverages Regional Analysis and Outlook
8.4.5. Australia Spirulina Beverages Regional Analysis and Outlook
8.4.6. South East Asia Spirulina Beverages Regional Analysis and Outlook
8.4.7. Rest of Asia Pacific Spirulina Beverages Regional Analysis and Outlook
8.5. South America Spirulina Beverages Revenue (USD Million), by Country (2021-2032)
8.5.1. Brazil Spirulina Beverages Regional Analysis and Outlook
8.5.2. Argentina Spirulina Beverages Regional Analysis and Outlook
8.5.3. Rest of South America Spirulina Beverages Regional Analysis and Outlook
8.6. Middle East and Africa Spirulina Beverages Revenue (USD Million) by Country (2021-2032)
8.6.1. Middle East Spirulina Beverages Regional Analysis and Outlook
8.6.2. Africa Spirulina Beverages Regional Analysis and Outlook
Chapter 9. North America Spirulina Beverages Analysis and Outlook
9.1. North America Spirulina Beverages Revenue (USD Million) by Segments (2021-2032)
9.1.1. North America Spirulina Beverages Revenue (USD Million) by Type (2021-2032)
9.1.2. North America Spirulina Beverages Revenue (USD Million) by Application (2021-2032)
9.1.3. North America Spirulina Beverages Revenue (USD Million) by Product (2021-2032)
By Nature
Organic
Conventional
By Distribution Channel
Hypermarkets/Supermarkets
Online Retail
Others
Chapter 10. Europe Spirulina Beverages Analysis and Outlook
10.1. Europe Spirulina Beverages Revenue (USD Million), by Segments (USD Million) (2021-2032)
10.1.1. Europe Spirulina Beverages Revenue (USD Million) by Type (2021-2032)
10.1.2. Europe Spirulina Beverages Revenue (USD Million) by Application (2021-2032)
10.1.3. Europe Spirulina Beverages Revenue (USD Million) by Product (2021-2032)
By Nature
Organic
Conventional
By Distribution Channel
Hypermarkets/Supermarkets
Online Retail
Others
Chapter 11. Asia Pacific Spirulina Beverages Analysis and Outlook
11.1. Asia Pacific Spirulina Beverages Revenue (USD Million), and Revenue (USD Million) by Segments (2021-2032)
11.1.1. Asia Pacific Spirulina Beverages Revenue (USD Million) by Type (2021-2032)
11.1.2. Asia Pacific Spirulina Beverages Revenue (USD Million) by Application (2021-2032)
11.1.3. Asia Pacific Spirulina Beverages Revenue (USD Million) by Product (2021-2032)
By Nature
Organic
Conventional
By Distribution Channel
Hypermarkets/Supermarkets
Online Retail
Others
Chapter 12. South America Spirulina Beverages Analysis and Outlook
12.1. South America Spirulina Beverages Revenue (USD Million), by Segments (2021-2032)
12.1.1. South America Spirulina Beverages Revenue (USD Million) by Type (2021-2032)
12.1.2. South America Spirulina Beverages Revenue (USD Million) by Application (2021-2032)
12.1.3. South America Spirulina Beverages Revenue (USD Million) by Product (2021-2032)
By Nature
Organic
Conventional
By Distribution Channel
Hypermarkets/Supermarkets
Online Retail
Others
Chapter 13. Middle East and Africa Spirulina Beverages Analysis and Outlook
13.1. Middle East and Africa Spirulina Beverages Revenue (USD Million), by Segments (2021-2032)
13.1.1. Middle East and Africa Spirulina Beverages Revenue (USD Million) by Type (2021-2032)
13.1.2. Middle East and Africa Spirulina Beverages Revenue (USD Million) by Application (2021-2032)
13.1.3. Middle East and Africa Spirulina Beverages Revenue (USD Million) by Product (2021-2032)
By Nature
Organic
Conventional
By Distribution Channel
Hypermarkets/Supermarkets
Online Retail
Others
Chapter 14. Spirulina Beverages Company Profiles
14.1 Business Overview
14.2 Product Profiles
14.3 SWOT Profiles
14.5 Recent Developments
14.6 Financial Profile
List of Companies
Algama Foods
Chr. Hansen Holding A/S
DIC Corp
Fuqing King Dnarmsa Spirulina Co. Ltd
General Nutrition Corp
Lisi (Xian) Bio-Tech Inc
Naturalin Bio-Resources Co. Ltd
Naturex S.A.
NOW Health Group Inc
Prolgae Spirulina Supplies Pvt. Ltd
15. Methodology and Data Sources
15.1 Customization Offerings
15.2 Subscription Services
15.3 Related Reports
15.4 Publisher Expertise
LIST OF TABLES
Table 1 Market Segmentation Analysis
Table 2 Global Spirulina Beverages Market Share of Leading Companies, 2023
Table 3 Product Offerings of Leading Companies
Table 4 Low Growth Scenario Forecasts
Table 5 Reference Case Growth Scenario
Table 6 High Growth Case Scenario
Table 7 Global Spirulina Beverages Revenue (USD Million) And CAGR (%) By Type (2021-2032)
Table 8 Global Spirulina Beverages Revenue (USD Million) And CAGR (%) By Application (2021-2032)
Table 9 Global Spirulina Beverages Revenue (USD Million) And CAGR (%) By Product (2021-2032)
Table 10 Global Spirulina Beverages Market Revenue (USD Million) By Regions (2021-2032)
Table 11 Global Spirulina Beverages Market Share (%) By Regions (2021-2032)
Table 12 North America Spirulina Beverages Revenue (USD Million) By Country (2021-2032)
Table 13 Europe Spirulina Beverages Revenue (USD Million) By Country (2021-2032)
Table 14 Asia Pacific Spirulina Beverages Revenue (USD Million) By Country (2021-2032)
Table 15 South America Spirulina Beverages Revenue (USD Million) By Country (2021-2032)
Table 16 Middle East and Africa Spirulina Beverages Revenue (USD Million) By Region (2021-2032)
Table 17 North America Spirulina Beverages Revenue (USD Million) By Type (2021-2032)
Table 18 North America Spirulina Beverages Revenue (USD Million) By Application (2021-2032)
Table 19 North America Spirulina Beverages Revenue (USD Million) By Product (2021-2032)
Table 20 Europe Spirulina Beverages Revenue (USD Million) By Type (2021-2032)
Table 21 Europe Spirulina Beverages Revenue (USD Million) By Application (2021-2032)
Table 22 Europe Spirulina Beverages Revenue (USD Million) By Product (2021-2032)
Table 23 Asia Pacific Spirulina Beverages Revenue (USD Million) By Type (2021-2032)
Table 24 Asia Pacific Spirulina Beverages Revenue (USD Million) By Application (2021-2032)
Table 25 Asia Pacific Spirulina Beverages Revenue (USD Million) By Product (2021-2032)
Table 26 South America Spirulina Beverages Revenue (USD Million) By Type (2021-2032)
Table 27 South America Spirulina Beverages Revenue (USD Million) By Application (2021-2032)
Table 28 South America Spirulina Beverages Revenue (USD Million) By Product (2021-2032)
Table 29 Middle East and Africa Spirulina Beverages Revenue (USD Million) By Type (2021-2032)
Table 30 Middle East and Africa Spirulina Beverages Revenue (USD Million) By Application (2021-2032)
Table 31 Middle East and Africa Spirulina Beverages Revenue (USD Million) By Product (2021-2032)
LIST OF FIGURES
Figure 1. Market Scope
Figure 2. Pricing Forecasts Per Unit, 2023- 2032
Figure 3. Porter’s Five Forces
Figure 4. Global Spirulina Beverages Market Revenue (USD Million) By Regions (2021-2032)
Figure 5. Global Spirulina Beverages Market Share (%) By Regions (2023)
Figure 6. North America Spirulina Beverages Revenue (USD Million) By Country (2021-2032)
Figure 7. United States Spirulina Beverages Revenue (USD Million) By Country (2021-2032)
Figure 8. Canada Spirulina Beverages Revenue (USD Million) By Country (2021-2032)
Figure 9. Mexico Spirulina Beverages Revenue (USD Million) By Country (2021-2032)
Figure 10. Europe Spirulina Beverages Revenue (USD Million) By Country (2021-2032)
Figure 11. Germany Spirulina Beverages Revenue (USD Million) By Country (2021-2032)
Figure 12. France Spirulina Beverages Revenue (USD Million) By Country (2021-2032)
Figure 13. United Kingdom Spirulina Beverages Revenue (USD Million) By Country (2021-2032)
Figure 14. Spain Spirulina Beverages Revenue (USD Million) By Country (2021-2032)
Figure 15. Italy Spirulina Beverages Revenue (USD Million) By Country (2021-2032)
Figure 16. Russia Spirulina Beverages Revenue (USD Million) By Country (2021-2032)
Figure 17. Rest of Europe Spirulina Beverages Revenue (USD Million) By Country (2021-2032)
Figure 11. Asia Pacific Spirulina Beverages Revenue (USD Million) By Country (2021-2032)
Figure 12. China Spirulina Beverages Revenue (USD Million) By Country (2021-2032)
Figure 13. Japan Spirulina Beverages Revenue (USD Million) By Country (2021-2032)
Figure 14. India Spirulina Beverages Revenue (USD Million) By Country (2021-2032)
Figure 15. South Korea Spirulina Beverages Revenue (USD Million) By Country (2021-2032)
Figure 16. Australia Spirulina Beverages Revenue (USD Million) By Country (2021-2032)
Figure 17. South East Asia Spirulina Beverages Revenue (USD Million) By Country (2021-2032)
Figure 18. South America Spirulina Beverages Revenue (USD Million) By Country (2021-2032)
Figure 19. Brazil Spirulina Beverages Revenue (USD Million) By Country (2021-2032)
Figure 20. Argentina Spirulina Beverages Revenue (USD Million) By Country (2021-2032)
Figure 21. Rest of Asia Pacific Spirulina Beverages Revenue (USD Million) By Country (2021-2032)
Figure 22. Middle East and Africa Spirulina Beverages Revenue (USD Million) By Region (2021-2032)
Figure 23. Saudi Arabia Spirulina Beverages Revenue (USD Million) By Region (2021-2032)
Figure 24. The UAE Spirulina Beverages Revenue (USD Million) By Region (2021-2032)
Figure 25. Rest of Middle East Spirulina Beverages Revenue (USD Million) By Region (2021-2032)
Figure 26. South Africa Spirulina Beverages Revenue (USD Million) By Region (2021-2032)
Figure 27. Africa Spirulina Beverages Revenue (USD Million) By Region (2021-2032)
Figure 28. North America Spirulina Beverages Revenue (USD Million) By Type (2021-2032)
Figure 29. North America Spirulina Beverages Revenue (USD Million) By Application (2021-2032)
Figure 30. North America Spirulina Beverages Revenue (USD Million) By Product (2021-2032)
Figure 31. Europe Spirulina Beverages Revenue (USD Million) By Type (2021-2032)
Figure 32. Europe Spirulina Beverages Revenue (USD Million) By Application (2021-2032)
Figure 33. Europe Spirulina Beverages Revenue (USD Million) By Product (2021-2032)
Figure 34. Asia Pacific Spirulina Beverages Revenue (USD Million) By Type (2021-2032)
Figure 35. Asia Pacific Spirulina Beverages Revenue (USD Million) By Application (2021-2032)
Figure 36. Asia Pacific Spirulina Beverages Revenue (USD Million) By Product (2021-2032)
Figure 37. South America Spirulina Beverages Revenue (USD Million) By Type (2021-2032)
Figure 38. South America Spirulina Beverages Revenue (USD Million) By Application (2021-2032)
Figure 39. South America Spirulina Beverages Revenue (USD Million) By Product (2021-2032)
Figure 40. Middle East and Africa Spirulina Beverages Revenue (USD Million) By Type (2021-2032)
Figure 41. Middle East and Africa Spirulina Beverages Revenue (USD Million) By Application (2021-2032)
Figure 42. Middle East and Africa Spirulina Beverages Revenue (USD Million) By Product (2021-2032)
By Nature
Organic
Conventional
By Distribution Channel
Hypermarkets/Supermarkets
Online Retail
Others
Countries Analyzed
North America (US, Canada, Mexico)
Europe (Germany, UK, France, Spain, Italy, Russia, Rest of Europe)
Asia Pacific (China, India, Japan, South Korea, Australia, South East Asia, Rest of Asia)
South America (Brazil, Argentina, Rest of South America)
Middle East and Africa (Saudi Arabia, UAE, Rest of Middle East, South Africa, Egypt, Rest of Africa)
