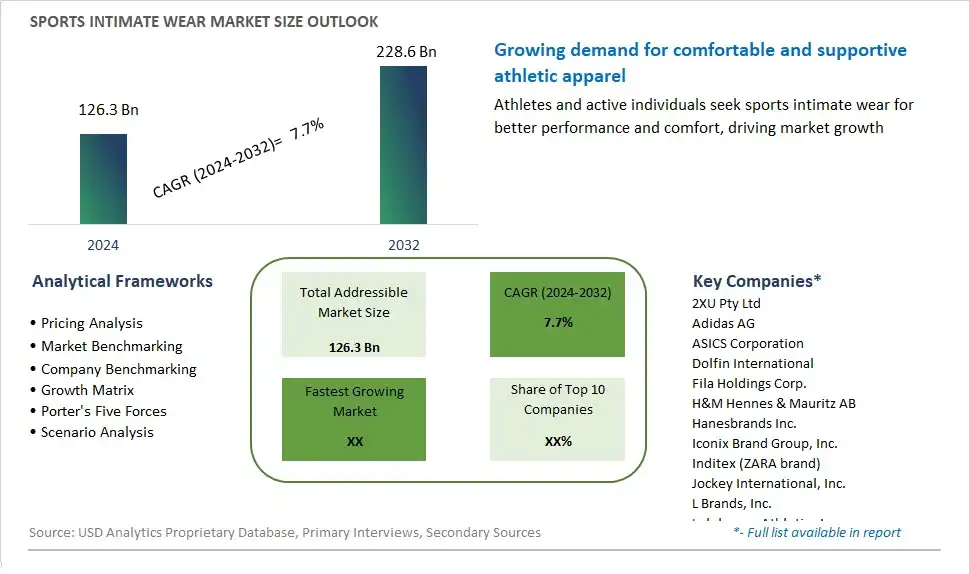
Global Sports Intimate Wear Market Size is valued at $126.3 Billion in 2024 and is forecast to register a growth rate (CAGR) of 7.7% to reach $228.6 Billion by 2032.
The global Sports Intimate Wear Market Comprehensive Study analyzes and forecasts the market size across 6 regions and 24 countries for diverse segments -By Product (Intimate Support Apparel, Swimwear, Compression Wear, Others), By Application (Specialty and Sports Shops, Department and Discount Stores, Online Retails, Others)
An Introduction to Sports Intimate Wear Market
The sports intimate wear market in 2024 is expanding rapidly, driven by the increasing demand for comfortable, functional, and stylish activewear. Sports intimate wear, including sports bras, compression shorts, and moisture-wicking underwear, is essential for enhancing performance and comfort during physical activities. The market is characterized by innovations in fabric technology, such as breathable, antimicrobial, and stretchy materials that provide support and flexibility. The growing trend towards fitness and active lifestyles, along with the influence of athleisure fashion, is significantly boosting market demand. Major brands are focusing on ergonomic designs, inclusive sizing, and sustainable materials to appeal to a diverse consumer base. Additionally, the rise of e-commerce and the popularity of social media influencers are driving market growth.
Sports Intimate Wear Competitive Landscape
The market report analyses the leading companies in the industry including 2XU Pty Ltd, Adidas AG, ASICS Corporation, Dolfin International, Fila Holdings Corp., H&M Hennes & Mauritz AB, Hanesbrands Inc., Iconix Brand Group, Inc., Inditex (ZARA brand), Jockey International, Inc., L Brands, Inc., Lululemon Athletica Inc., New Balance Athletics, Inc., Nike, Inc., Pentland Group plc, TYR Sport, Inc., Under Armour, Inc., and Others.
Sports Intimate Wear Market Dynamics
Sports Intimate Wear Market Trend: Fusion of Performance and Fashion in Athletic Apparel
One prominent market trend in sports intimate wear is the fusion of performance and fashion in athletic apparel. Consumers are increasingly demanding sports bras, underwear, and other intimate wear that not only provide functional support and comfort during physical activity but also incorporate stylish designs and trendy elements. This trend is driven by the growing popularity of athleisure fashion, where activewear seamlessly transitions from the gym to everyday wear. As consumers prioritize both performance and aesthetics in their clothing choices, there is a rising demand for sports intimate wear that combines innovative materials, supportive features, and fashionable designs to meet the diverse needs of active individuals.
Market Driver: Emphasis on Health, Fitness, and Body Positivity
A key market driver for sports intimate wear is the emphasis on health, fitness, and body positivity. With increasing awareness of the importance of physical activity and self-care, consumers are investing in activewear that empowers them to lead active and healthy lifestyles. Sports intimate wear plays a crucial role in supporting and enhancing the exercise experience, providing essential comfort, moisture-wicking properties, and performance-enhancing features. Additionally, there is a growing movement towards body positivity and inclusivity in the fashion industry, driving demand for sports intimate wear that caters to diverse body shapes, sizes, and fitness levels, fostering confidence and empowerment among consumers.
Market Opportunity: Expansion into Customization and Personalization
The growing demand for sports intimate wear presents a significant opportunity for expansion into customization and personalization. Manufacturers can capitalize on this trend by offering customizable options for sports bras, underwear, and other intimate wear, allowing consumers to tailor their garments to fit their unique preferences and needs. This includes options for adjustable straps, removable padding, different levels of support, and personalized sizing options. Furthermore, there is potential for incorporating innovative technologies, such as 3D scanning and printing, to create bespoke intimate wear solutions that provide optimal fit and comfort. By embracing opportunities for customization and personalization, stakeholders in the sports intimate wear market can differentiate their offerings and enhance the overall consumer experience, driving growth and loyalty in a competitive market landscape.
Sports Intimate Wear Market Share Analysis: Intimate Support Apparel held the dominant market share in 2024
Within the sports intimate wear market, intimate support apparel is the largest segment, driven by several pivotal factors. Intimate support apparel, including sports bras and underwear designed for athletic activities, addresses the specific comfort and performance needs of active individuals. The increasing participation in sports and fitness activities, coupled with growing awareness of the importance of proper support during exercise, fuels the demand for intimate support apparel. Further, advancements in fabric technology and design innovations have enhanced the functionality and comfort of intimate support apparel, further boosting its popularity among athletes and fitness enthusiasts. Additionally, the expanding range of styles, sizes, and performance features caters to diverse body types and activity levels, contributing to the widespread adoption of intimate support apparel. As consumers prioritize comfort, performance, and style in their athletic wear choices, intimate support apparel maintains its dominance as the largest segment in the sports intimate wear market.
Sports Intimate Wear Market Share Analysis: Online Retail market is poised to register the fastest growth rae over the forecast period to 2032
Among the various application segments in the sports intimate wear market, online retail is the fastest-growing sector, propelled by several key factors. The increasing consumer preference for online shopping, driven by convenience, accessibility, and a wide variety of options, fuels the surge in demand for sports intimate wear through digital platforms. Online retailers offer a seamless shopping experience, allowing consumers to browse through an extensive range of products, compare prices, and make purchases from the comfort of their homes. Further, the proliferation of e-commerce platforms and mobile shopping apps provides easy access to sports intimate wear for consumers across diverse demographics and geographic locations. Additionally, the availability of detailed product descriptions, customer reviews, and size guides enhances the confidence of online shoppers, driving conversion rates and fostering brand loyalty. As online retail continues to reshape the sports intimate wear market landscape, its rapid growth trajectory underscores the evolving preferences and shopping behaviors of consumers in the digital age.
Sports Intimate Wear Market Segmentation
By Product
Intimate Support Apparel
Swimwear
Compression Wear
Others
By Application
Specialty and Sports Shops
Department and Discount Stores
Online Retails
Others
Countries Analyzed
North America (US, Canada, Mexico)
Europe (Germany, UK, France, Spain, Italy, Russia, Rest of Europe)
Asia Pacific (China, India, Japan, South Korea, Australia, South East Asia, Rest of Asia)
South America (Brazil, Argentina, Rest of South America)
Middle East and Africa (Saudi Arabia, UAE, Rest of Middle East, South Africa, Egypt, Rest of Africa)
Sports Intimate Wear Companies Profiled in the Study
2XU Pty Ltd
Adidas AG
ASICS Corporation
Dolfin International
Fila Holdings Corp.
H&M Hennes & Mauritz AB
Hanesbrands Inc.
Iconix Brand Group, Inc.
Inditex (ZARA brand)
Jockey International, Inc.
L Brands, Inc.
Lululemon Athletica Inc.
New Balance Athletics, Inc.
Nike, Inc.
Pentland Group plc
TYR Sport, Inc.
Under Armour, Inc.
*- List Not Exhaustive
Chapter 1. TABLE OF CONTENTS
Chapter 2. Introduction to Sports Intimate Wear Market
2.1. Market Overview
2.2. Key Statistics and Report Highlights
2.3. Scope of the Comprehensive Study
2.3.1. Market Definition
2.3.2 Countries and Regions Covered
2.3.3 Research Objective
2.3.4 Units, Currency, and Conversions
2.3.5 Industry Value Chain
2.4. Key Market Segments
2.5. Key Companies
2.6. Study Period
Chapter 3. Strategic Analysis Review
3.1. Sports Intimate Wear Pricing Analysis and Forecast
3.2. Porter’s Five Forces
3.3. Market Ecosystem
3.4. SWOT Analysis
3.5. Regulatory Scenario
3.3. Effects of Inflation, Russia-Ukraine War, moderating economic growth, and other macroeconomic factors
Chapter 4. Competitive Landscape
4.1. Market Share Analysis
4.1.1. Global Sports Intimate Wear Market Share by Company, 2023
4.1.2. Product Offerings of Leading Sports Intimate Wear Companies
4.2. Market Entropy
4.2.1. New Product Launches in the Industry
4.2.2. Mergers, Acquisitions, Joint ventures, and Partnerships
4.3. Key Strategies and Best Practices
Chapter 5. Global Market Projections: Best, Reference, and Low Case Scenarios
5.1. Growth Analysis- Case Scenario Definitions
5.2. Low Growth Case Scenario Forecasts
5.3. Reference Growth Case Scenario Forecasts
5.4. High Growth Case Scenario Forecasts
Chapter 6. Market Dynamics
6.1. Sports Intimate Wear Market Drivers
6.2. Sports Intimate Wear Market Challenges
6.6. Sports Intimate Wear Market Opportunities
6.4. Sports Intimate Wear Market Trends
Chapter 7. Global Sports Intimate Wear Market Outlook Trends
7.1. Global Sports Intimate Wear Revenue (USD Million) and CAGR (%) by Type (2021-2032)
7.2. Global Sports Intimate Wear Revenue (USD Million) and CAGR (%) by Application (2021-2032)
7.3. Global Sports Intimate Wear Revenue (USD Million) and CAGR (%) by Product (2021-2032)
By Product
Intimate Support Apparel
Swimwear
Compression Wear
Others
By Application
Specialty and Sports Shops
Department and Discount Stores
Online Retails
Others
Chapter 8. Global Sports Intimate Wear Regional Analysis and Outlook
8.1. Global Sports Intimate Wear Revenue (USD Million) By Regions (2021- 2032)
8.2. North America Sports Intimate Wear Revenue (USD Million) by Country (2021-2032)
8.2.1. United States Sports Intimate Wear Regional Analysis and Outlook
8.2.2. Canada Sports Intimate Wear Regional Analysis and Outlook
8.2.3. Mexico Sports Intimate Wear Regional Analysis and Outlook
8.3. Europe Sports Intimate Wear Revenue (USD Million), by Country (2021-2032)
8.3.1. Germany Sports Intimate Wear Regional Analysis and Outlook
8.3.2. France Sports Intimate Wear Regional Analysis and Outlook
8.3.3. United Kingdom Sports Intimate Wear Regional Analysis and Outlook
8.3.4. Spain Sports Intimate Wear Regional Analysis and Outlook
8.3.5. Italy Sports Intimate Wear Regional Analysis and Outlook
8.3.6. Russia Sports Intimate Wear Regional Analysis and Outlook
8.3.7. Rest of Europe Sports Intimate Wear Regional Analysis and Outlook
8.4. Asia Pacific Sports Intimate Wear Revenue (USD Million) by Country (2021-2032)
8.4.1. China Sports Intimate Wear Regional Analysis and Outlook
8.4.2. Japan Sports Intimate Wear Regional Analysis and Outlook
8.4.3. India Sports Intimate Wear Regional Analysis and Outlook
8.4.4. South Korea Sports Intimate Wear Regional Analysis and Outlook
8.4.5. Australia Sports Intimate Wear Regional Analysis and Outlook
8.4.6. South East Asia Sports Intimate Wear Regional Analysis and Outlook
8.4.7. Rest of Asia Pacific Sports Intimate Wear Regional Analysis and Outlook
8.5. South America Sports Intimate Wear Revenue (USD Million), by Country (2021-2032)
8.5.1. Brazil Sports Intimate Wear Regional Analysis and Outlook
8.5.2. Argentina Sports Intimate Wear Regional Analysis and Outlook
8.5.3. Rest of South America Sports Intimate Wear Regional Analysis and Outlook
8.6. Middle East and Africa Sports Intimate Wear Revenue (USD Million) by Country (2021-2032)
8.6.1. Middle East Sports Intimate Wear Regional Analysis and Outlook
8.6.2. Africa Sports Intimate Wear Regional Analysis and Outlook
Chapter 9. North America Sports Intimate Wear Analysis and Outlook
9.1. North America Sports Intimate Wear Revenue (USD Million) by Segments (2021-2032)
9.1.1. North America Sports Intimate Wear Revenue (USD Million) by Type (2021-2032)
9.1.2. North America Sports Intimate Wear Revenue (USD Million) by Application (2021-2032)
9.1.3. North America Sports Intimate Wear Revenue (USD Million) by Product (2021-2032)
By Product
Intimate Support Apparel
Swimwear
Compression Wear
Others
By Application
Specialty and Sports Shops
Department and Discount Stores
Online Retails
Others
Chapter 10. Europe Sports Intimate Wear Analysis and Outlook
10.1. Europe Sports Intimate Wear Revenue (USD Million), by Segments (USD Million) (2021-2032)
10.1.1. Europe Sports Intimate Wear Revenue (USD Million) by Type (2021-2032)
10.1.2. Europe Sports Intimate Wear Revenue (USD Million) by Application (2021-2032)
10.1.3. Europe Sports Intimate Wear Revenue (USD Million) by Product (2021-2032)
By Product
Intimate Support Apparel
Swimwear
Compression Wear
Others
By Application
Specialty and Sports Shops
Department and Discount Stores
Online Retails
Others
Chapter 11. Asia Pacific Sports Intimate Wear Analysis and Outlook
11.1. Asia Pacific Sports Intimate Wear Revenue (USD Million), and Revenue (USD Million) by Segments (2021-2032)
11.1.1. Asia Pacific Sports Intimate Wear Revenue (USD Million) by Type (2021-2032)
11.1.2. Asia Pacific Sports Intimate Wear Revenue (USD Million) by Application (2021-2032)
11.1.3. Asia Pacific Sports Intimate Wear Revenue (USD Million) by Product (2021-2032)
By Product
Intimate Support Apparel
Swimwear
Compression Wear
Others
By Application
Specialty and Sports Shops
Department and Discount Stores
Online Retails
Others
Chapter 12. South America Sports Intimate Wear Analysis and Outlook
12.1. South America Sports Intimate Wear Revenue (USD Million), by Segments (2021-2032)
12.1.1. South America Sports Intimate Wear Revenue (USD Million) by Type (2021-2032)
12.1.2. South America Sports Intimate Wear Revenue (USD Million) by Application (2021-2032)
12.1.3. South America Sports Intimate Wear Revenue (USD Million) by Product (2021-2032)
By Product
Intimate Support Apparel
Swimwear
Compression Wear
Others
By Application
Specialty and Sports Shops
Department and Discount Stores
Online Retails
Others
Chapter 13. Middle East and Africa Sports Intimate Wear Analysis and Outlook
13.1. Middle East and Africa Sports Intimate Wear Revenue (USD Million), by Segments (2021-2032)
13.1.1. Middle East and Africa Sports Intimate Wear Revenue (USD Million) by Type (2021-2032)
13.1.2. Middle East and Africa Sports Intimate Wear Revenue (USD Million) by Application (2021-2032)
13.1.3. Middle East and Africa Sports Intimate Wear Revenue (USD Million) by Product (2021-2032)
By Product
Intimate Support Apparel
Swimwear
Compression Wear
Others
By Application
Specialty and Sports Shops
Department and Discount Stores
Online Retails
Others
Chapter 14. Sports Intimate Wear Company Profiles
14.1 Business Overview
14.2 Product Profiles
14.3 SWOT Profiles
14.5 Recent Developments
14.6 Financial Profile
List of Companies
2XU Pty Ltd
Adidas AG
ASICS Corporation
Dolfin International
Fila Holdings Corp.
H&M Hennes & Mauritz AB
Hanesbrands Inc.
Iconix Brand Group, Inc.
Inditex (ZARA brand)
Jockey International, Inc.
L Brands, Inc.
Lululemon Athletica Inc.
New Balance Athletics, Inc.
Nike, Inc.
Pentland Group plc
TYR Sport, Inc.
Under Armour, Inc.
15. Methodology and Data Sources
15.1 Customization Offerings
15.2 Subscription Services
15.3 Related Reports
15.4 Publisher Expertise
LIST OF TABLES
Table 1 Market Segmentation Analysis
Table 2 Global Sports Intimate Wear Market Share of Leading Companies, 2023
Table 3 Product Offerings of Leading Companies
Table 4 Low Growth Scenario Forecasts
Table 5 Reference Case Growth Scenario
Table 6 High Growth Case Scenario
Table 7 Global Sports Intimate Wear Revenue (USD Million) And CAGR (%) By Type (2021-2032)
Table 8 Global Sports Intimate Wear Revenue (USD Million) And CAGR (%) By Application (2021-2032)
Table 9 Global Sports Intimate Wear Revenue (USD Million) And CAGR (%) By Product (2021-2032)
Table 10 Global Sports Intimate Wear Market Revenue (USD Million) By Regions (2021-2032)
Table 11 Global Sports Intimate Wear Market Share (%) By Regions (2021-2032)
Table 12 North America Sports Intimate Wear Revenue (USD Million) By Country (2021-2032)
Table 13 Europe Sports Intimate Wear Revenue (USD Million) By Country (2021-2032)
Table 14 Asia Pacific Sports Intimate Wear Revenue (USD Million) By Country (2021-2032)
Table 15 South America Sports Intimate Wear Revenue (USD Million) By Country (2021-2032)
Table 16 Middle East and Africa Sports Intimate Wear Revenue (USD Million) By Region (2021-2032)
Table 17 North America Sports Intimate Wear Revenue (USD Million) By Type (2021-2032)
Table 18 North America Sports Intimate Wear Revenue (USD Million) By Application (2021-2032)
Table 19 North America Sports Intimate Wear Revenue (USD Million) By Product (2021-2032)
Table 20 Europe Sports Intimate Wear Revenue (USD Million) By Type (2021-2032)
Table 21 Europe Sports Intimate Wear Revenue (USD Million) By Application (2021-2032)
Table 22 Europe Sports Intimate Wear Revenue (USD Million) By Product (2021-2032)
Table 23 Asia Pacific Sports Intimate Wear Revenue (USD Million) By Type (2021-2032)
Table 24 Asia Pacific Sports Intimate Wear Revenue (USD Million) By Application (2021-2032)
Table 25 Asia Pacific Sports Intimate Wear Revenue (USD Million) By Product (2021-2032)
Table 26 South America Sports Intimate Wear Revenue (USD Million) By Type (2021-2032)
Table 27 South America Sports Intimate Wear Revenue (USD Million) By Application (2021-2032)
Table 28 South America Sports Intimate Wear Revenue (USD Million) By Product (2021-2032)
Table 29 Middle East and Africa Sports Intimate Wear Revenue (USD Million) By Type (2021-2032)
Table 30 Middle East and Africa Sports Intimate Wear Revenue (USD Million) By Application (2021-2032)
Table 31 Middle East and Africa Sports Intimate Wear Revenue (USD Million) By Product (2021-2032)
LIST OF FIGURES
Figure 1. Market Scope
Figure 2. Pricing Forecasts Per Unit, 2023- 2032
Figure 3. Porter’s Five Forces
Figure 4. Global Sports Intimate Wear Market Revenue (USD Million) By Regions (2021-2032)
Figure 5. Global Sports Intimate Wear Market Share (%) By Regions (2023)
Figure 6. North America Sports Intimate Wear Revenue (USD Million) By Country (2021-2032)
Figure 7. United States Sports Intimate Wear Revenue (USD Million) By Country (2021-2032)
Figure 8. Canada Sports Intimate Wear Revenue (USD Million) By Country (2021-2032)
Figure 9. Mexico Sports Intimate Wear Revenue (USD Million) By Country (2021-2032)
Figure 10. Europe Sports Intimate Wear Revenue (USD Million) By Country (2021-2032)
Figure 11. Germany Sports Intimate Wear Revenue (USD Million) By Country (2021-2032)
Figure 12. France Sports Intimate Wear Revenue (USD Million) By Country (2021-2032)
Figure 13. United Kingdom Sports Intimate Wear Revenue (USD Million) By Country (2021-2032)
Figure 14. Spain Sports Intimate Wear Revenue (USD Million) By Country (2021-2032)
Figure 15. Italy Sports Intimate Wear Revenue (USD Million) By Country (2021-2032)
Figure 16. Russia Sports Intimate Wear Revenue (USD Million) By Country (2021-2032)
Figure 17. Rest of Europe Sports Intimate Wear Revenue (USD Million) By Country (2021-2032)
Figure 11. Asia Pacific Sports Intimate Wear Revenue (USD Million) By Country (2021-2032)
Figure 12. China Sports Intimate Wear Revenue (USD Million) By Country (2021-2032)
Figure 13. Japan Sports Intimate Wear Revenue (USD Million) By Country (2021-2032)
Figure 14. India Sports Intimate Wear Revenue (USD Million) By Country (2021-2032)
Figure 15. South Korea Sports Intimate Wear Revenue (USD Million) By Country (2021-2032)
Figure 16. Australia Sports Intimate Wear Revenue (USD Million) By Country (2021-2032)
Figure 17. South East Asia Sports Intimate Wear Revenue (USD Million) By Country (2021-2032)
Figure 18. South America Sports Intimate Wear Revenue (USD Million) By Country (2021-2032)
Figure 19. Brazil Sports Intimate Wear Revenue (USD Million) By Country (2021-2032)
Figure 20. Argentina Sports Intimate Wear Revenue (USD Million) By Country (2021-2032)
Figure 21. Rest of Asia Pacific Sports Intimate Wear Revenue (USD Million) By Country (2021-2032)
Figure 22. Middle East and Africa Sports Intimate Wear Revenue (USD Million) By Region (2021-2032)
Figure 23. Saudi Arabia Sports Intimate Wear Revenue (USD Million) By Region (2021-2032)
Figure 24. The UAE Sports Intimate Wear Revenue (USD Million) By Region (2021-2032)
Figure 25. Rest of Middle East Sports Intimate Wear Revenue (USD Million) By Region (2021-2032)
Figure 26. South Africa Sports Intimate Wear Revenue (USD Million) By Region (2021-2032)
Figure 27. Africa Sports Intimate Wear Revenue (USD Million) By Region (2021-2032)
Figure 28. North America Sports Intimate Wear Revenue (USD Million) By Type (2021-2032)
Figure 29. North America Sports Intimate Wear Revenue (USD Million) By Application (2021-2032)
Figure 30. North America Sports Intimate Wear Revenue (USD Million) By Product (2021-2032)
Figure 31. Europe Sports Intimate Wear Revenue (USD Million) By Type (2021-2032)
Figure 32. Europe Sports Intimate Wear Revenue (USD Million) By Application (2021-2032)
Figure 33. Europe Sports Intimate Wear Revenue (USD Million) By Product (2021-2032)
Figure 34. Asia Pacific Sports Intimate Wear Revenue (USD Million) By Type (2021-2032)
Figure 35. Asia Pacific Sports Intimate Wear Revenue (USD Million) By Application (2021-2032)
Figure 36. Asia Pacific Sports Intimate Wear Revenue (USD Million) By Product (2021-2032)
Figure 37. South America Sports Intimate Wear Revenue (USD Million) By Type (2021-2032)
Figure 38. South America Sports Intimate Wear Revenue (USD Million) By Application (2021-2032)
Figure 39. South America Sports Intimate Wear Revenue (USD Million) By Product (2021-2032)
Figure 40. Middle East and Africa Sports Intimate Wear Revenue (USD Million) By Type (2021-2032)
Figure 41. Middle East and Africa Sports Intimate Wear Revenue (USD Million) By Application (2021-2032)
Figure 42. Middle East and Africa Sports Intimate Wear Revenue (USD Million) By Product (2021-2032)
By Product
Intimate Support Apparel
Swimwear
Compression Wear
Others
By Application
Specialty and Sports Shops
Department and Discount Stores
Online Retails
Others
Countries Analyzed
North America (US, Canada, Mexico)
Europe (Germany, UK, France, Spain, Italy, Russia, Rest of Europe)
Asia Pacific (China, India, Japan, South Korea, Australia, South East Asia, Rest of Asia)
South America (Brazil, Argentina, Rest of South America)
Middle East and Africa (Saudi Arabia, UAE, Rest of Middle East, South Africa, Egypt, Rest of Africa)
