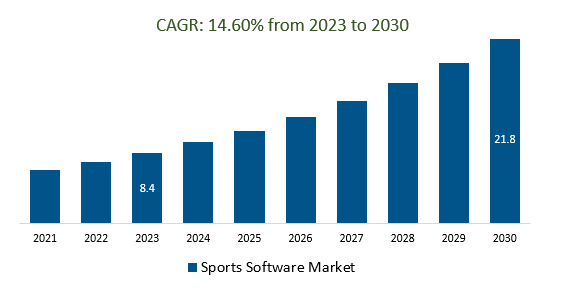
The global Sports Software Market Size is estimated to be US$ 8.4 Billion in 2023 and is poised to register 14.60% growth over the forecast period from 2023 to 2030. To reach US $ 21.8 billion in 2030.
The market growth is driven by increasing Sports teams and organizations are increasingly investing in software solutions that enhance fan engagement. These platforms include apps, social media integrations, and virtual experiences to connect fans with the teams and players they support. Leading companies focusing on Personalized Fan Experiences, Data-Driven Insights, Wearable Technology, AI-powered coaching, and others to boost market shares in the industry.
Market Overview
The Sports Software Market was characterized by robust growth and innovation, driven by technological advancements and changing consumers. The market includes software for fan experiences, performance analysis, esports management, health tracking, ticketing, athlete management, and more. Key trends include the integration of virtual reality (VR) and augmented reality (AR) for immersive experiences, the rise of esports software, data-driven insights, mobile app proliferation, and remote training solutions.
Market Dynamics
Market Trends- Companies are launching Virtual Reality (VR) and Augmented Reality (AR) to attract a consumer base
Virtual Reality (VR) and Augmented Reality (AR) are driving significant transformation in the Sports Software Market. VR immerses fans in games, aids athlete training, and supports rehabilitation. AR enhances fan engagement with real-time stats, interactive content, and enriched stadium experiences while aiding coaching, broadcasting, and sponsorship activations. These technologies are set to evolve with advanced immersion, wider accessibility, hybrid experiences, data integration, social interactions, and optimized training, reshaping the sports industry by offering immersive fan experiences, innovative training methods, enhanced analytics, and new revenue streams that bridge the physical and virtual sports worlds.
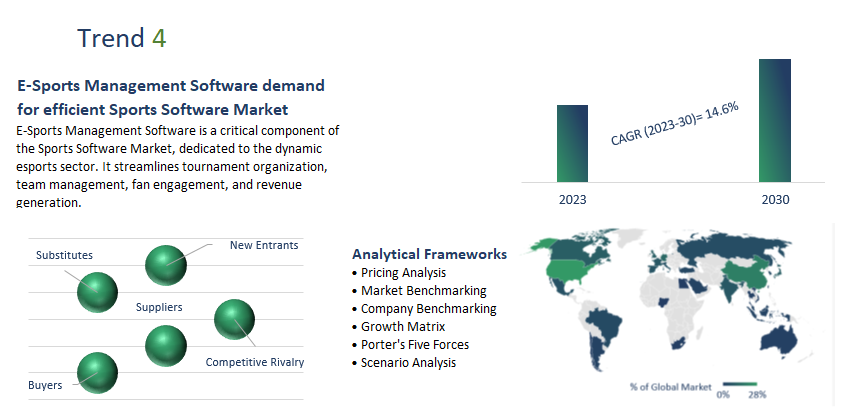
Market Driver- E-Sports Management Software demand for efficient Sports Software Market
E-Sports Management Software is a critical component of the Sports Software Market, dedicated to the dynamic esports sector. It streamlines tournament organization, team management, fan engagement, and revenue generation. As esports grow, the software's role will expand, incorporating AI-driven analytics, personalized experiences, cross-platform integration, and global scalability, transforming the way tournaments, teams, players, and fans interact within the esports ecosystem.
Market Opportunity-Introduction of Remote Training and Coaching
Remote Training and Coaching are integral aspects of the Sports Software Market, enabling athletes to receive personalized guidance, feedback, and training plans from coaches regardless of their physical location. Through digital platforms, athletes engage in customized workouts, real-time interactions, and performance monitoring, with the potential for future advancements like biometric integration, immersive experiences, AI insights, and collaborative solutions, reshaping how athletes train and receive guidance in the sports industry.
Market Segmentation
On-premise: In the Sports Software Market On-premise denotes software deployed locally on an organization's infrastructure instead of on the cloud, offering control over data but with potential drawbacks in terms of cost and scalability. While cloud solutions were becoming more popular, on-premise software was still chosen by some sports organizations, often due to security or compliance needs.
Sports associations: Sports associations are vital players in the Sports Software Market, utilizing software for streamlined event management, data analytics, fan engagement, player development, governance, compliance, and financial operations. Their adoption of technology drives the efficient organization of tournaments, data-driven decisions, athlete training, fan interaction, and sports governance, positioning them at the forefront of technological advancements in the sports industry.
Segmentation
By Component
By Deployment Model
by Application
- Clubs
- Coaches
- Leagues
- Sports associations
- Others
By Region
- North America (United States, Canada, Mexico)
- Europe (Germany, France, United Kingdom, Spain, Italy, Others)
- Asia Pacific (China, India, Japan, South Korea, Australia, Others)
- Latin America (Brazil, Argentina, Others)
- Middle East and Africa (Saudi Arabia, UAE, Kuwait, Other Middle East, South Africa, Nigeria, Other Africa)
Key Players
Leading companies profiled in the study include-
- Digital Edge Sport Inc
- EDGE10 Group Ltd
- Engage Sports LLC
- International Business Machines Corp.
- Jevin
- LeagueApps Inc
- SAP SE
- SPay Inc
- Sport 80 Services Ltd
- Sportlyzer LLC
- SportsEngine Inc
- Stats Perform group of companies
- Team Topia Inc
- TeamSideline
- TeamSnap Inc.
- TopDog Sports
- Upper Hand Inc
Sports Software Market Outlook 2023
1 Market Overview
1.1 Introduction to the Sports Software Market
1.2 Scope of the Study
1.3 Research Objective
1.3.1 Key Market Scope and Segments
1.3.2 Players Covered
1.3.3 Years Considered
2 Executive Summary
2.1 2023 Sports Software Industry- Market Statistics
3 Market Dynamics
3.1 Market Drivers
3.2 Market Challenges
3.3 Market Opportunities
3.4 Market Trends
4 Market Factor Analysis
4.1 Porter’s Five Forces
4.2 Market Entropy
4.2.1 Global Sports Software Market Companies with Area Served
4.2.2 Products Offerings Global Sports Software Market
5 COVID-19 Impact Analysis and Outlook Scenarios
5.1.1 Covid-19 Impact Analysis
5.1.2 Post-COVID-19 Scenario- Low Growth Case
5.1.3 Post-COVID-19 Scenario- Reference Growth Case
5.1.4 Post-COVID-19 Scenario- Low Growth Case
6 Global Sports Software Market Trends
6.1 Global Sports Software Revenue (USD Million) and CAGR (%) by Type (2018-2030)
6.2 Global Sports Software Revenue (USD Million) and CAGR (%) by Applications (2018-2030)
6.3 Global Sports Software Revenue (USD Million) and CAGR (%) by Regions (2018-2030)
7 Global Sports Software Market Revenue (USD Million) by Type, and Applications (2018-2022)
7.1 Global Sports Software Revenue (USD Million) by Type (2018-2022)
7.1.1 Global Sports Software Revenue (USD Million), Market Share (%) by Type (2018-2022)
7.2 Global Sports Software Revenue (USD Million) by Applications (2018-2022)
7.2.1 Global Sports Software Revenue (USD Million), Market Share (%) by Applications (2018-2022)
8 Global Sports Software Development Regional Status and Outlook
8.1 Global Sports Software Revenue (USD Million) By Regions (2018-2022)
8.2 North America Sports Software Revenue (USD Million) by Type, and Application (2018-2022)
8.2.1 North America Sports Software Revenue (USD Million) by Country (2018-2022)
8.2.2 North America Sports Software Revenue (USD Million) by Type (2018-2022)
8.2.3 North America Sports Software Revenue (USD Million) by Applications (2018-2022)
8.3 Europe Sports Software Revenue (USD Million), by Type, and Applications (USD Million) (2018-2022)
8.3.1 Europe Sports Software Revenue (USD Million), by Country (2018-2022)
8.3.2 Europe Sports Software Revenue (USD Million) by Type (2018-2022)
8.3.3 Europe Sports Software Revenue (USD Million) by Applications (2018-2022)
8.4 Asia Pacific Sports Software Revenue (USD Million), and Revenue (USD Million) by Type, and Applications (2018-2022)
8.4.1 Asia Pacific Sports Software Revenue (USD Million) by Country (2018-2022)
8.4.2 Asia Pacific Sports Software Revenue (USD Million) by Type (2018-2022)
8.4.3 Asia Pacific Sports Software Revenue (USD Million) by Applications (2018-2022)
8.5 South America Sports Software Revenue (USD Million), by Type, and Applications (2018-2022)
8.5.1 South America Sports Software Revenue (USD Million), by Country (2018-2022)
8.5.2 South America Sports Software Revenue (USD Million) by Type (2018-2022)
8.5.3 South America Sports Software Revenue (USD Million) by Applications (2018-2022)
8.6 Middle East and Africa Sports Software Revenue (USD Million), by Type, Technology, Application, Thickness (2018-2022)
8.6.1 Middle East and Africa Sports Software Revenue (USD Million) by Country (2018-2022)
8.6.2 Middle East and Africa Sports Software Revenue (USD Million) by Type (2018-2022)
8.6.3 Middle East and Africa Sports Software Revenue (USD Million) by Applications (2018-2022)
9 Company Profiles
10 Global Sports Software Market Revenue (USD Million), by Type, and Applications (2023-2030)
10.1 Global Sports Software Revenue (USD Million) and Market Share (%) by Type (2023-2030)
10.1.1 Global Sports Software Revenue (USD Million), and Market Share (%) by Type (2023-2030)
10.2 Global Sports Software Revenue (USD Million) and Market Share (%) by Applications (2023-2030)
10.2.1 Global Sports Software Revenue (USD Million), and Market Share (%) by Applications (2023-2030)
11 Global Sports Software Development Regional Status and Outlook Forecast
11.1 Global Sports Software Revenue (USD Million) By Regions (2023-2030)
11.2 North America Sports Software Revenue (USD Million) by Type, and Applications (2023-2030)
11.2.1 North America Sports Software Revenue (USD) Million by Country (2023-2030)
11.2.2 North America Sports Software Revenue (USD Million), by Type (2023-2030)
11.2.3 North America Sports Software Revenue (USD Million), Market Share (%) by Applications (2023-2030)
11.3 Europe Sports Software Revenue (USD Million), by Type, and Applications (2023-2030)
11.3.1 Europe Sports Software Revenue (USD Million), by Country (2023-2030)
11.3.2 Europe Sports Software Revenue (USD Million), by Type (2023-2030)
11.3.3 Europe Sports Software Revenue (USD Million), by Applications (2023-2030)
11.4 Asia Pacific Sports Software Revenue (USD Million) by Type, and Applications (2023-2030)
11.4.1 Asia Pacific Sports Software Revenue (USD Million), by Country (2023-2030)
11.4.2 Asia Pacific Sports Software Revenue (USD Million), by Type (2023-2030)
11.4.3 Asia Pacific Sports Software Revenue (USD Million), by Applications (2023-2030)
11.5 South America Sports Software Revenue (USD Million), by Type, and Applications (2023-2030)
11.5.1 South America Sports Software Revenue (USD Million), by Country (2023-2030)
11.5.2 South America Sports Software Revenue (USD Million), by Type (2023-2030)
11.5.3 South America Sports Software Revenue (USD Million), by Applications (2023-2030)
11.6 Middle East and Africa Sports Software Revenue (USD Million), by Type, and Applications (2023-2030)
11.6.1 Middle East and Africa Sports Software Revenue (USD Million), by Region (2023-2030)
11.6.2 Middle East and Africa Sports Software Revenue (USD Million), by Type (2023-2030)
11.6.3 Middle East and Africa Sports Software Revenue (USD Million), by Applications (2023-2030)
12 Methodology and Data Sources
12.1 Methodology/Research Approach
12.1.1 Research Programs/Design
12.1.2 Market Size Estimation
12.1.3 Market Breakdown and Data Triangulation
12.2 Data Sources
12.2.1 Secondary Sources
12.2.2 Primary Sources
12.3 Disclaimer
List Of Tables
Table 1 Market Segmentation Analysis
Table 2 Global Sports Software Market Companies with Areas Served
Table 3 Products Offerings Global Sports Software Market
Table 4 Low Growth Scenario Forecasts
Table 5 Reference Case Growth Scenario
Table 6 High Growth Case Scenario
Table 7 Global Sports Software Revenue (USD Million) And CAGR (%) By Type (2018-2030)
Table 8 Global Sports Software Revenue (USD Million) And CAGR (%) By Applications (2018-2030)
Table 9 Global Sports Software Revenue (USD Million) And CAGR (%) By Regions (2018-2030)
Table 10 Global Sports Software Revenue (USD Million) By Type (2018-2022)
Table 11 Global Sports Software Revenue Market Share (%) By Type (2018-2022)
Table 12 Global Sports Software Revenue (USD Million) By Applications (2018-2022)
Table 13 Global Sports Software Revenue Market Share (%) By Applications (2018-2022)
Table 14 Global Sports Software Market Revenue (USD Million) By Regions (2018-2022)
Table 15 Global Sports Software Market Share (%) By Regions (2018-2022)
Table 16 North America Sports Software Revenue (USD Million) By Country (2018-2022)
Table 17 North America Sports Software Revenue (USD Million) By Type (2018-2022)
Table 18 North America Sports Software Revenue (USD Million) By Applications (2018-2022)
Table 19 Europe Sports Software Revenue (USD Million) By Country (2018-2022)
Table 20 Europe Sports Software Revenue (USD Million) By Type (2018-2022)
Table 21 Europe Sports Software Revenue (USD Million) By Applications (2018-2022)
Table 22 Asia Pacific Sports Software Revenue (USD Million) By Country (2018-2022)
Table 23 Asia Pacific Sports Software Revenue (USD Million) By Type (2018-2022)
Table 24 Asia Pacific Sports Software Revenue (USD Million) By Applications (2018-2022)
Table 25 South America Sports Software Revenue (USD Million) By Country (2018-2022)
Table 26 South America Sports Software Revenue (USD Million) By Type (2018-2022)
Table 27 South America Sports Software Revenue (USD Million) By Applications (2018-2022)
Table 28 Middle East and Africa Sports Software Revenue (USD Million) By Region (2018-2022)
Table 29 Middle East and Africa Sports Software Revenue (USD Million) By Type (2018-2022)
Table 30 Middle East and Africa Sports Software Revenue (USD Million) By Applications (2018-2022)
Table 31 Financial Analysis
Table 32 Global Sports Software Revenue (USD Million) By Type (2023-2030)
Table 33 Global Sports Software Revenue Market Share (%) By Type (2023-2030)
Table 34 Global Sports Software Revenue (USD Million) By Applications (2023-2030)
Table 35 Global Sports Software Revenue Market Share (%) By Applications (2023-2030)
Table 36 Global Sports Software Market Revenue (USD Million), And Revenue (USD Million) By Regions (2023-2030)
Table 37 North America Sports Software Revenue (USD)By Country (2023-2030)
Table 38 North America Sports Software Revenue (USD Million) By Type (2023-2030)
Table 39 North America Sports Software Revenue (USD Million) By Applications (2023-2030)
Table 40 Europe Sports Software Revenue (USD Million) By Country (2023-2030)
Table 41 Europe Sports Software Revenue (USD Million) By Type (2023-2030)
Table 42 Europe Sports Software Revenue (USD Million) By Applications (2023-2030)
Table 43 Asia Pacific Sports Software Revenue (USD Million) By Country (2023-2030)
Table 44 Asia Pacific Sports Software Revenue (USD Million) By Type (2023-2030)
Table 45 Asia Pacific Sports Software Revenue (USD Million) By Applications (2023-2030)
Table 46 South America Sports Software Revenue (USD Million) By Country (2023-2030)
Table 47 South America Sports Software Revenue (USD Million) By Type (2023-2030)
Table 48 South America Sports Software Revenue (USD Million) By Applications (2023-2030)
Table 49 Middle East and Africa Sports Software Revenue (USD Million) By Region (2023-2030)
Table 50 Middle East and Africa Sports Software Revenue (USD Million) By Region (2023-2030)
Table 51 Middle East and Africa Sports Software Revenue (USD Million) By Type (2023-2030)
Table 52 Middle East and Africa Sports Software Revenue (USD Million) By Applications (2023-2030)
Table 53 Research Programs/Design for This Report
Table 54 Key Data Information from Secondary Sources
Table 55 Key Data Information from Primary Sources
List Of Figures
Figure 1 Market Scope
Figure 2 Porter’s Five Forces
Figure 3 Global Sports Software Revenue (USD Million) By Type (2018-2022)
Figure 4 Global Sports Software Revenue Market Share (%) By Type (2022)
Figure 5 Global Sports Software Revenue (USD Million) By Applications (2018-2022)
Figure 6 Global Sports Software Revenue Market Share (%) By Applications (2022)
Figure 7 Global Sports Software Market Revenue (USD Million) By Regions (2018-2022)
Figure 8 Global Sports Software Market Share (%) By Regions (2022)
Figure 9 North America Sports Software Revenue (USD Million) By Country (2018-2022)
Figure 10 North America Sports Software Revenue (USD Million) By Type (2018-2022)
Figure 11 North America Sports Software Revenue (USD Million) By Applications (2018-2022)
Figure 12 Europe Sports Software Revenue (USD Million) By Country (2018-2022)
Figure 13 Europe Sports Software Revenue (USD Million) By Type (2018-2022)
Figure 14 Europe Sports Software Revenue (USD Million) By Applications (2018-2022)
Figure 15 Asia Pacific Sports Software Revenue (USD Million) By Country (2018-2022)
Figure 16 Asia Pacific Sports Software Revenue (USD Million) By Type (2018-2022)
Figure 17 Asia Pacific Sports Software Revenue (USD Million) By Applications (2018-2022)
Figure 18 South America Sports Software Revenue (USD Million) By Country (2018-2022)
Figure 19 South America Sports Software Revenue (USD Million) By Type (2018-2022)
Figure 20 South America Sports Software Revenue (USD Million) By Applications (2018-2022)
Figure 21 Middle East and Africa Sports Software Revenue (USD Million) By Region (2018-2022)
Figure 22 Middle East and Africa Sports Software Revenue (USD Million) By Type (2018-2022)
Figure 23 Middle East and Africa Sports Software Revenue (USD Million) By Applications (2018-2022)
Figure 24 Global Sports Software Revenue (USD Million) By Type (2023-2030)
Figure 25 Global Sports Software Revenue Market Share (%) By Type (2030)
Figure 26 Global Sports Software Revenue (USD Million) By Applications (2023-2030)
Figure 27 Global Sports Software Revenue Market Share (%) By Applications (2030)
Figure 28 Global Sports Software Market Revenue (USD Million) By Regions (2023-2030)
Figure 29 North America Sports Software Revenue (USD Million) By Country (2023-2030)
Figure 30 North America Sports Software Revenue (USD Million) By Type (2023-2030)
Figure 31 North America Sports Software Revenue (USD Million) By Applications (2023-2030)
Figure 32 Europe Sports Software Revenue (USD Million) By Country (2023-2030)
Figure 33 Europe Sports Software Revenue (USD Million) By Type (2023-2030)
Figure 34 Europe Sports Software Revenue (USD Million) By Applications (2023-2030)
Figure 35 Asia Pacific Sports Software Revenue (USD Million) By Country (2023-2030)
Figure 36 Asia Pacific Sports Software Revenue (USD Million) By Type (2023-2030)
Figure 37 Asia Pacific Sports Software Revenue (USD Million) By Applications (2023-2030)
Figure 38 South America Sports Software Revenue (USD Million) By Country (2023-2030)
Figure 39 South America Sports Software Revenue (USD Million) By Type (2023-2030)
Figure 40 South America Sports Software Revenue (USD Million) By Applications (2023-2030)
Figure 41 Middle East and Africa Sports Software Revenue (USD Million) By Region (2023-2030)
Figure 42 Middle East and Africa Sports Software Revenue (USD Million) By Region (2023-2030)
Figure 43 Middle East and Africa Sports Software Revenue (USD Million) By Type (2023-2030)
Figure 44 Middle East and Africa Sports Software Revenue (USD Million) By Applications (2023-2030)
Figure 45 Bottom-Up and Top-Down Approaches For This Report
Figure 46 Data Triangulation
