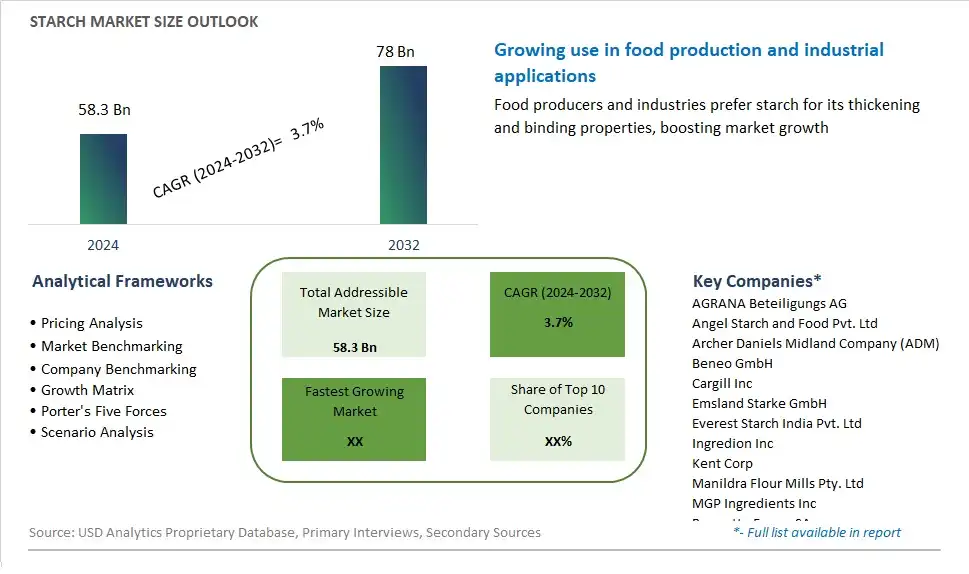
Global Starch Market Size is valued at $58.3 Billion in 2024 and is forecast to register a growth rate (CAGR) of 3.7% to reach $78 Billion by 2032.
The global Starch Market Comprehensive Study analyzes and forecasts the market size across 6 regions and 24 countries for diverse segments -By Type (Corn, Potato, Tapioca, Wheat, Others), By End-User (Retail, Industrial, Animal feed)
An Introduction to Starch Market
In 2024, the starch market is thriving, driven by the increasing demand for versatile and functional ingredients in food and industrial applications. Starch, derived from sources such as corn, potatoes, and cassava, is used in a wide range of products, including baked goods, snacks, and adhesives. The market is characterized by innovations in processing and modification techniques, enhancing the performance and applications of starch products. The growing trend towards clean-label and natural ingredients is significantly boosting demand for non-GMO and organic starches. Major producers are focusing on sustainable sourcing and production practices to meet the evolving preferences of consumers. Additionally, the rise of gluten-free and plant-based diets is driving demand for alternative starch sources.
Starch Competitive Landscape
The market report analyses the leading companies in the industry including AGRANA Beteiligungs AG, Angel Starch and Food Pvt. Ltd, Archer Daniels Midland Company (ADM), Beneo GmbH, Cargill Inc, Emsland Starke GmbH, Everest Starch India Pvt. Ltd, Ingredion Inc, Kent Corp, Manildra Flour Mills Pty. Ltd, MGP Ingredients Inc, Roquette Freres SA, Royal Avebe, SMScor, SPAC Starch Products India Pvt. Ltd, SSPL, Tate & Lyle PLC, Thai Flour Industry Co. Ltd, Varalakshmi Starch Industries P Ltd, VIMAL PPCE , and Others.
Starch Market Dynamics
Starch Market Trend: Growing Demand for Clean Label and Natural Ingredients
One prominent market trend in the starch market is the growing demand for clean label and natural ingredients. As consumers become more health-conscious and ingredient-savvy, there is increasing scrutiny of food and beverage products, with a preference for those made with simple, recognizable ingredients. Starch, derived from natural sources such as corn, wheat, tapioca, and potatoes, is sought after for its functionality as a thickening, stabilizing, and gelling agent in various food applications. This trend is driven by a desire for transparency, authenticity, and sustainability in food production, prompting manufacturers to seek out starch ingredients that are minimally processed and free from additives, preservatives, and genetically modified organisms (GMOs).
Market Driver: Growth in Food and Beverage Industry and Functional Applications
A key market driver for starch is the growth in the food and beverage industry and functional applications. Starch plays a crucial role in food formulation, providing texture, mouthfeel, and shelf stability to a wide range of products, including baked goods, sauces, soups, snacks, and dairy alternatives. Additionally, with the rise of functional foods and dietary trends focused on health and wellness, there is increasing demand for starch ingredients that offer nutritional benefits, such as resistant starches that support gut health and blood sugar management. The versatility and functionality of starch make it a valuable ingredient for manufacturers seeking to develop innovative products that meet consumer preferences for taste, texture, and nutritional value.
Market Opportunity: Expansion into Non-Food Applications and Industrial Uses
The growing demand for starch presents a significant opportunity for expansion into non-food applications and industrial uses. Beyond its traditional role in food production, starch is utilized in various non-food industries, including pharmaceuticals, textiles, papermaking, and bioplastics. There is potential for starch-based materials to replace synthetic ingredients and petrochemical-derived products in industrial applications, offering sustainable and biodegradable alternatives that reduce environmental impact. Additionally, there is opportunity for innovation in starch-based biodegradable packaging materials, coatings, adhesives, and biomaterials, addressing growing concerns about plastic pollution and waste management. By leveraging opportunities for diversification and expansion into non-food applications, stakeholders in the starch market can tap into new revenue streams and contribute to the development of sustainable solutions for a wide range of industries.
Starch Market Share Analysis: Corn Starch held the dominant market share in 2024
Within the starch market, corn starch stands as the largest segment, driven by several pivotal factors. Corn starch boasts widespread applications across various industries including food and beverage, pharmaceuticals, paper and textile, and personal care. Its versatility, neutral flavor profile, and excellent thickening and binding properties make it a staple ingredient in a multitude of products such as sauces, soups, baked goods, and confectionery items. Additionally, the abundance and cost-effectiveness of corn as a raw material contribute to the widespread adoption of corn starch by manufacturers globally. Further, technological advancements in corn processing have led to the development of modified corn starches with enhanced functionalities, further expanding its usage in specialized applications. As consumer demand for processed foods and industrial applications continues to rise, corn starch maintains its dominance as the largest segment in the starch market.
Starch Market Share Analysis: Industrial End-User market is poised to register the fastest growth rae over the forecast period to 2032
Among the end-user segments in the starch market, the industrial sector is the fastest-growing, propelled by several key factors. Industrial applications of starch encompass a diverse range of industries including textiles, paper and packaging, pharmaceuticals, and adhesives, among others. The increasing demand for starch as a raw material in industrial processes such as manufacturing, binding, and thickening drives the rapid growth of the industrial end-user segment. Further, starch-based biodegradable plastics and biofuels represent emerging markets that contribute to the expanding utilization of starch in industrial applications. Additionally, technological advancements in starch processing and modification techniques enhance the versatility and functionality of starch, further fueling its adoption across various industrial sectors. As industries continue to prioritize sustainable and renewable resources, starch remains a preferred choice, driving the rapid growth of the industrial end-user segment in the starch market.
Starch Market Segmentation
By Type
Corn
Potato
Tapioca
Wheat
Others
By End-User
Retail
Industrial
Animal feed
Countries Analyzed
North America (US, Canada, Mexico)
Europe (Germany, UK, France, Spain, Italy, Russia, Rest of Europe)
Asia Pacific (China, India, Japan, South Korea, Australia, South East Asia, Rest of Asia)
South America (Brazil, Argentina, Rest of South America)
Middle East and Africa (Saudi Arabia, UAE, Rest of Middle East, South Africa, Egypt, Rest of Africa)
Starch Companies Profiled in the Study
AGRANA Beteiligungs AG
Angel Starch and Food Pvt. Ltd
Archer Daniels Midland Company (ADM)
Beneo GmbH
Cargill Inc
Emsland Starke GmbH
Everest Starch India Pvt. Ltd
Ingredion Inc
Kent Corp
Manildra Flour Mills Pty. Ltd
MGP Ingredients Inc
Roquette Freres SA
Royal Avebe
SMScor
SPAC Starch Products India Pvt. Ltd
SSPL
Tate & Lyle PLC
Thai Flour Industry Co. Ltd
Varalakshmi Starch Industries P Ltd
VIMAL PPCE
*- List Not Exhaustive
Chapter 1. TABLE OF CONTENTS
Chapter 2. Introduction to Starch Market
2.1. Market Overview
2.2. Key Statistics and Report Highlights
2.3. Scope of the Comprehensive Study
2.3.1. Market Definition
2.3.2 Countries and Regions Covered
2.3.3 Research Objective
2.3.4 Units, Currency, and Conversions
2.3.5 Industry Value Chain
2.4. Key Market Segments
2.5. Key Companies
2.6. Study Period
Chapter 3. Strategic Analysis Review
3.1. Starch Pricing Analysis and Forecast
3.2. Porter’s Five Forces
3.3. Market Ecosystem
3.4. SWOT Analysis
3.5. Regulatory Scenario
3.3. Effects of Inflation, Russia-Ukraine War, moderating economic growth, and other macroeconomic factors
Chapter 4. Competitive Landscape
4.1. Market Share Analysis
4.1.1. Global Starch Market Share by Company, 2023
4.1.2. Product Offerings of Leading Starch Companies
4.2. Market Entropy
4.2.1. New Product Launches in the Industry
4.2.2. Mergers, Acquisitions, Joint ventures, and Partnerships
4.3. Key Strategies and Best Practices
Chapter 5. Global Market Projections: Best, Reference, and Low Case Scenarios
5.1. Growth Analysis- Case Scenario Definitions
5.2. Low Growth Case Scenario Forecasts
5.3. Reference Growth Case Scenario Forecasts
5.4. High Growth Case Scenario Forecasts
Chapter 6. Market Dynamics
6.1. Starch Market Drivers
6.2. Starch Market Challenges
6.6. Starch Market Opportunities
6.4. Starch Market Trends
Chapter 7. Global Starch Market Outlook Trends
7.1. Global Starch Revenue (USD Million) and CAGR (%) by Type (2021-2032)
7.2. Global Starch Revenue (USD Million) and CAGR (%) by Application (2021-2032)
7.3. Global Starch Revenue (USD Million) and CAGR (%) by Product (2021-2032)
By Type
Corn
Potato
Tapioca
Wheat
Others
By End-User
Retail
Industrial
Animal feed
Chapter 8. Global Starch Regional Analysis and Outlook
8.1. Global Starch Revenue (USD Million) By Regions (2021- 2032)
8.2. North America Starch Revenue (USD Million) by Country (2021-2032)
8.2.1. United States Starch Regional Analysis and Outlook
8.2.2. Canada Starch Regional Analysis and Outlook
8.2.3. Mexico Starch Regional Analysis and Outlook
8.3. Europe Starch Revenue (USD Million), by Country (2021-2032)
8.3.1. Germany Starch Regional Analysis and Outlook
8.3.2. France Starch Regional Analysis and Outlook
8.3.3. United Kingdom Starch Regional Analysis and Outlook
8.3.4. Spain Starch Regional Analysis and Outlook
8.3.5. Italy Starch Regional Analysis and Outlook
8.3.6. Russia Starch Regional Analysis and Outlook
8.3.7. Rest of Europe Starch Regional Analysis and Outlook
8.4. Asia Pacific Starch Revenue (USD Million) by Country (2021-2032)
8.4.1. China Starch Regional Analysis and Outlook
8.4.2. Japan Starch Regional Analysis and Outlook
8.4.3. India Starch Regional Analysis and Outlook
8.4.4. South Korea Starch Regional Analysis and Outlook
8.4.5. Australia Starch Regional Analysis and Outlook
8.4.6. South East Asia Starch Regional Analysis and Outlook
8.4.7. Rest of Asia Pacific Starch Regional Analysis and Outlook
8.5. South America Starch Revenue (USD Million), by Country (2021-2032)
8.5.1. Brazil Starch Regional Analysis and Outlook
8.5.2. Argentina Starch Regional Analysis and Outlook
8.5.3. Rest of South America Starch Regional Analysis and Outlook
8.6. Middle East and Africa Starch Revenue (USD Million) by Country (2021-2032)
8.6.1. Middle East Starch Regional Analysis and Outlook
8.6.2. Africa Starch Regional Analysis and Outlook
Chapter 9. North America Starch Analysis and Outlook
9.1. North America Starch Revenue (USD Million) by Segments (2021-2032)
9.1.1. North America Starch Revenue (USD Million) by Type (2021-2032)
9.1.2. North America Starch Revenue (USD Million) by Application (2021-2032)
9.1.3. North America Starch Revenue (USD Million) by Product (2021-2032)
By Type
Corn
Potato
Tapioca
Wheat
Others
By End-User
Retail
Industrial
Animal feed
Chapter 10. Europe Starch Analysis and Outlook
10.1. Europe Starch Revenue (USD Million), by Segments (USD Million) (2021-2032)
10.1.1. Europe Starch Revenue (USD Million) by Type (2021-2032)
10.1.2. Europe Starch Revenue (USD Million) by Application (2021-2032)
10.1.3. Europe Starch Revenue (USD Million) by Product (2021-2032)
By Type
Corn
Potato
Tapioca
Wheat
Others
By End-User
Retail
Industrial
Animal feed
Chapter 11. Asia Pacific Starch Analysis and Outlook
11.1. Asia Pacific Starch Revenue (USD Million), and Revenue (USD Million) by Segments (2021-2032)
11.1.1. Asia Pacific Starch Revenue (USD Million) by Type (2021-2032)
11.1.2. Asia Pacific Starch Revenue (USD Million) by Application (2021-2032)
11.1.3. Asia Pacific Starch Revenue (USD Million) by Product (2021-2032)
By Type
Corn
Potato
Tapioca
Wheat
Others
By End-User
Retail
Industrial
Animal feed
Chapter 12. South America Starch Analysis and Outlook
12.1. South America Starch Revenue (USD Million), by Segments (2021-2032)
12.1.1. South America Starch Revenue (USD Million) by Type (2021-2032)
12.1.2. South America Starch Revenue (USD Million) by Application (2021-2032)
12.1.3. South America Starch Revenue (USD Million) by Product (2021-2032)
By Type
Corn
Potato
Tapioca
Wheat
Others
By End-User
Retail
Industrial
Animal feed
Chapter 13. Middle East and Africa Starch Analysis and Outlook
13.1. Middle East and Africa Starch Revenue (USD Million), by Segments (2021-2032)
13.1.1. Middle East and Africa Starch Revenue (USD Million) by Type (2021-2032)
13.1.2. Middle East and Africa Starch Revenue (USD Million) by Application (2021-2032)
13.1.3. Middle East and Africa Starch Revenue (USD Million) by Product (2021-2032)
By Type
Corn
Potato
Tapioca
Wheat
Others
By End-User
Retail
Industrial
Animal feed
Chapter 14. Starch Company Profiles
14.1 Business Overview
14.2 Product Profiles
14.3 SWOT Profiles
14.5 Recent Developments
14.6 Financial Profile
List of Companies
AGRANA Beteiligungs AG
Angel Starch and Food Pvt. Ltd
Archer Daniels Midland Company (ADM)
Beneo GmbH
Cargill Inc
Emsland Starke GmbH
Everest Starch India Pvt. Ltd
Ingredion Inc
Kent Corp
Manildra Flour Mills Pty. Ltd
MGP Ingredients Inc
Roquette Freres SA
Royal Avebe
SMScor
SPAC Starch Products India Pvt. Ltd
SSPL
Tate & Lyle PLC
Thai Flour Industry Co. Ltd
Varalakshmi Starch Industries P Ltd
VIMAL PPCE
15. Methodology and Data Sources
15.1 Customization Offerings
15.2 Subscription Services
15.3 Related Reports
15.4 Publisher Expertise
LIST OF TABLES
Table 1 Market Segmentation Analysis
Table 2 Global Starch Market Share of Leading Companies, 2023
Table 3 Product Offerings of Leading Companies
Table 4 Low Growth Scenario Forecasts
Table 5 Reference Case Growth Scenario
Table 6 High Growth Case Scenario
Table 7 Global Starch Revenue (USD Million) And CAGR (%) By Type (2021-2032)
Table 8 Global Starch Revenue (USD Million) And CAGR (%) By Application (2021-2032)
Table 9 Global Starch Revenue (USD Million) And CAGR (%) By Product (2021-2032)
Table 10 Global Starch Market Revenue (USD Million) By Regions (2021-2032)
Table 11 Global Starch Market Share (%) By Regions (2021-2032)
Table 12 North America Starch Revenue (USD Million) By Country (2021-2032)
Table 13 Europe Starch Revenue (USD Million) By Country (2021-2032)
Table 14 Asia Pacific Starch Revenue (USD Million) By Country (2021-2032)
Table 15 South America Starch Revenue (USD Million) By Country (2021-2032)
Table 16 Middle East and Africa Starch Revenue (USD Million) By Region (2021-2032)
Table 17 North America Starch Revenue (USD Million) By Type (2021-2032)
Table 18 North America Starch Revenue (USD Million) By Application (2021-2032)
Table 19 North America Starch Revenue (USD Million) By Product (2021-2032)
Table 20 Europe Starch Revenue (USD Million) By Type (2021-2032)
Table 21 Europe Starch Revenue (USD Million) By Application (2021-2032)
Table 22 Europe Starch Revenue (USD Million) By Product (2021-2032)
Table 23 Asia Pacific Starch Revenue (USD Million) By Type (2021-2032)
Table 24 Asia Pacific Starch Revenue (USD Million) By Application (2021-2032)
Table 25 Asia Pacific Starch Revenue (USD Million) By Product (2021-2032)
Table 26 South America Starch Revenue (USD Million) By Type (2021-2032)
Table 27 South America Starch Revenue (USD Million) By Application (2021-2032)
Table 28 South America Starch Revenue (USD Million) By Product (2021-2032)
Table 29 Middle East and Africa Starch Revenue (USD Million) By Type (2021-2032)
Table 30 Middle East and Africa Starch Revenue (USD Million) By Application (2021-2032)
Table 31 Middle East and Africa Starch Revenue (USD Million) By Product (2021-2032)
LIST OF FIGURES
Figure 1. Market Scope
Figure 2. Pricing Forecasts Per Unit, 2023- 2032
Figure 3. Porter’s Five Forces
Figure 4. Global Starch Market Revenue (USD Million) By Regions (2021-2032)
Figure 5. Global Starch Market Share (%) By Regions (2023)
Figure 6. North America Starch Revenue (USD Million) By Country (2021-2032)
Figure 7. United States Starch Revenue (USD Million) By Country (2021-2032)
Figure 8. Canada Starch Revenue (USD Million) By Country (2021-2032)
Figure 9. Mexico Starch Revenue (USD Million) By Country (2021-2032)
Figure 10. Europe Starch Revenue (USD Million) By Country (2021-2032)
Figure 11. Germany Starch Revenue (USD Million) By Country (2021-2032)
Figure 12. France Starch Revenue (USD Million) By Country (2021-2032)
Figure 13. United Kingdom Starch Revenue (USD Million) By Country (2021-2032)
Figure 14. Spain Starch Revenue (USD Million) By Country (2021-2032)
Figure 15. Italy Starch Revenue (USD Million) By Country (2021-2032)
Figure 16. Russia Starch Revenue (USD Million) By Country (2021-2032)
Figure 17. Rest of Europe Starch Revenue (USD Million) By Country (2021-2032)
Figure 11. Asia Pacific Starch Revenue (USD Million) By Country (2021-2032)
Figure 12. China Starch Revenue (USD Million) By Country (2021-2032)
Figure 13. Japan Starch Revenue (USD Million) By Country (2021-2032)
Figure 14. India Starch Revenue (USD Million) By Country (2021-2032)
Figure 15. South Korea Starch Revenue (USD Million) By Country (2021-2032)
Figure 16. Australia Starch Revenue (USD Million) By Country (2021-2032)
Figure 17. South East Asia Starch Revenue (USD Million) By Country (2021-2032)
Figure 18. South America Starch Revenue (USD Million) By Country (2021-2032)
Figure 19. Brazil Starch Revenue (USD Million) By Country (2021-2032)
Figure 20. Argentina Starch Revenue (USD Million) By Country (2021-2032)
Figure 21. Rest of Asia Pacific Starch Revenue (USD Million) By Country (2021-2032)
Figure 22. Middle East and Africa Starch Revenue (USD Million) By Region (2021-2032)
Figure 23. Saudi Arabia Starch Revenue (USD Million) By Region (2021-2032)
Figure 24. The UAE Starch Revenue (USD Million) By Region (2021-2032)
Figure 25. Rest of Middle East Starch Revenue (USD Million) By Region (2021-2032)
Figure 26. South Africa Starch Revenue (USD Million) By Region (2021-2032)
Figure 27. Africa Starch Revenue (USD Million) By Region (2021-2032)
Figure 28. North America Starch Revenue (USD Million) By Type (2021-2032)
Figure 29. North America Starch Revenue (USD Million) By Application (2021-2032)
Figure 30. North America Starch Revenue (USD Million) By Product (2021-2032)
Figure 31. Europe Starch Revenue (USD Million) By Type (2021-2032)
Figure 32. Europe Starch Revenue (USD Million) By Application (2021-2032)
Figure 33. Europe Starch Revenue (USD Million) By Product (2021-2032)
Figure 34. Asia Pacific Starch Revenue (USD Million) By Type (2021-2032)
Figure 35. Asia Pacific Starch Revenue (USD Million) By Application (2021-2032)
Figure 36. Asia Pacific Starch Revenue (USD Million) By Product (2021-2032)
Figure 37. South America Starch Revenue (USD Million) By Type (2021-2032)
Figure 38. South America Starch Revenue (USD Million) By Application (2021-2032)
Figure 39. South America Starch Revenue (USD Million) By Product (2021-2032)
Figure 40. Middle East and Africa Starch Revenue (USD Million) By Type (2021-2032)
Figure 41. Middle East and Africa Starch Revenue (USD Million) By Application (2021-2032)
Figure 42. Middle East and Africa Starch Revenue (USD Million) By Product (2021-2032)
By Type
Corn
Potato
Tapioca
Wheat
Others
By End-User
Retail
Industrial
Animal feed
Countries Analyzed
North America (US, Canada, Mexico)
Europe (Germany, UK, France, Spain, Italy, Russia, Rest of Europe)
Asia Pacific (China, India, Japan, South Korea, Australia, South East Asia, Rest of Asia)
South America (Brazil, Argentina, Rest of South America)
Middle East and Africa (Saudi Arabia, UAE, Rest of Middle East, South Africa, Egypt, Rest of Africa)
