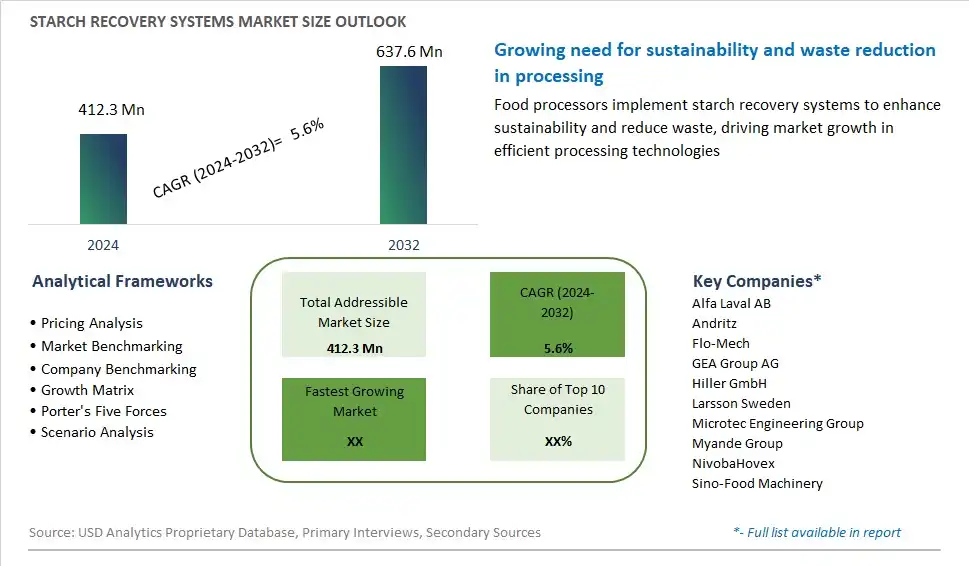
Global Starch Recovery Systems Market Size is valued at $412.3 Million in 2024 and is forecast to register a growth rate (CAGR) of 5.6% to reach $637.6 Million by 2032.
The global Starch Recovery Systems Market Comprehensive Study analyzes and forecasts the market size across 6 regions and 24 countries for diverse segments -By Component (Refining sieves, Hydrocyclones and centrifuges, Vacuum filters, Screw conveyors, Filling stations, Others), By Application (Frozen products, Chips & snack pellets, Dehydrated products, Others), By Plant size (Large scale, Medium scale, Small scale)
An Introduction to Starch Recovery Systems Market
Starch recovery systems are utilized in food processing facilities to extract starch from various raw materials such as potatoes, corn, wheat, and cassava in 2024. These systems employ processes such as wet milling, centrifugation, and drying to separate starch granules from the protein, fiber, and other components of the raw material. The recovered starch is then used in various food applications such as thickeners, stabilizers, and texturizers in products such as sauces, soups, baked goods, and snacks. Starch recovery systems offer economic and environmental benefits by reducing waste and maximizing the utilization of raw materials in food production. With increasing demand for clean label ingredients, plant-based alternatives, and sustainable food processing practices, the market for starch recovery systems is expanding, driven by innovations in extraction technology, process efficiency, and by-product valorization that enable manufacturers to optimize resource use, reduce environmental impact, and enhance profitability in food production.
Starch Recovery Systems Competitive Landscape
The market report analyses the leading companies in the industry including Alfa Laval AB, Andritz, Flo-Mech, GEA Group AG, Hiller GmbH, Larsson Sweden, Microtec Engineering Group, Myande Group, NivobaHovex, Sino-Food Machinery, and Others.
Starch Recovery Systems Market Dynamics
Starch Recovery Systems Market Trend: Sustainability and Waste Reduction
A prominent market trend for starch recovery systems is the increasing emphasis on sustainability and waste reduction in food processing industries. With growing environmental concerns and regulations aimed at minimizing waste generation and promoting resource efficiency, food manufacturers are seeking innovative solutions to recover and reuse valuable resources such as starch. Starch recovery systems enable the efficient extraction of starch from various raw materials, such as potatoes, corn, and wheat, while minimizing waste and maximizing resource utilization. This trend aligns with the broader sustainability goals of the food industry and reflects a shift towards more eco-friendly and resource-efficient manufacturing practices.
Market Driver: Cost Optimization and Operational Efficiency
A significant market driver for starch recovery systems is the need for cost optimization and operational efficiency in food processing operations. Starch is a valuable ingredient used in various food products, including baked goods, snacks, and beverages. By implementing starch recovery systems, food manufacturers can extract starch from by-products and wastewater streams, thereby reducing raw material costs and minimizing waste disposal expenses. Moreover, starch recovery systems enable higher yields and increased process efficiency, leading to cost savings and improved profitability for food processors. The drive for cost optimization and operational efficiency is motivating companies to invest in starch recovery technologies to enhance their competitive advantage and financial performance.
Market Opportunity: Expansion into Emerging Markets and Applications
An opportunity within the starch recovery systems market lies in the expansion into emerging markets and applications. While starch recovery systems are widely used in traditional applications such as starch processing plants and ethanol production facilities, there is potential for growth in new and emerging sectors. For example, as the demand for plant-based alternatives continues to rise, starch recovery systems could be utilized in the extraction of starch from alternative sources such as pulses, tubers, and root vegetables for use in plant-based food products. Additionally, expanding into emerging markets, particularly in regions experiencing rapid industrialization and urbanization, presents opportunities for starch recovery system manufacturers to tap into new customer segments and address the growing demand for processed food products. By diversifying their product offerings and targeting untapped markets and applications, companies can capitalize on the expanding opportunities within the starch recovery systems market.
Starch Recovery Systems Market Share Analysis: Refining Sieves held the dominant market share in 2024
Among the various components in the Starch Recovery Systems Market, refining sieves emerge as the largest segment, owing to their critical role in the starch extraction and purification process. Refining sieves play a pivotal role in separating starch from other components of the raw material, such as fiber, protein, and residual solids, ensuring high purity and quality of the recovered starch. These sieves utilize precise filtration mechanisms to efficiently remove impurities and fines, resulting in a refined starch product suitable for various industrial applications, including food, beverage, pharmaceuticals, and paper manufacturing. Additionally, refining sieves offer advantages such as high throughput capacity, low maintenance requirements, and versatility in accommodating different types of starch sources, ranging from corn and wheat to potatoes and tapioca. With increasing demand for sustainable and cost-effective starch recovery solutions across diverse industries, the refining sieves segment continues to dominate the Starch Recovery Systems Market, presenting significant growth opportunities for manufacturers and suppliers worldwide.
Starch Recovery Systems Market Share Analysis: Chips & Snack Pellets market is poised to register the fastest growth rae over the forecast period to 2032
The Chips & Snack Pellets segment is the fastest-growing category within the Starch Recovery Systems Market, driven by the burgeoning demand for convenient and indulgent snack foods worldwide. Chips and snack pellets manufacturers increasingly rely on starch recovery systems to optimize production processes, reduce waste, and enhance product quality. Starch recovery systems play a crucial role in recovering starch from potato processing effluents, enabling manufacturers to minimize raw material costs and maximize resource efficiency. Additionally, the rising popularity of savory snacks and convenience foods, coupled with evolving consumer preferences for healthier and more sustainable snack options, underscores the importance of starch recovery systems in the Chips & Snack Pellets segment. Further, technological advancements in starch recovery technologies, such as improved filtration methods and energy-efficient processing systems, further drive market growth by offering cost-effective and eco-friendly solutions for snack food manufacturers. With the Chips & Snack Pellets segment poised for continued expansion amidst shifting consumer trends and increasing demand for innovative snack products, the Starch Recovery Systems Market is experiencing rapid growth, presenting lucrative opportunities for industry players to capitalize on the thriving snack food sector.
Starch Recovery Systems Market Share Analysis: Large Scale Plants held the dominant market share in 2024
Within the Starch Recovery Systems Market, the Large Scale Plants segment is the largest category, primarily due to the economies of scale and operational efficiencies associated with large-scale starch production facilities. Large-scale plants benefit from significant investments in infrastructure, advanced equipment, and automated processing systems, enabling them to achieve high throughput capacities, cost-effectiveness, and consistent product quality. Further, large-scale starch recovery systems cater to the diverse needs of food, beverage, and industrial manufacturers, supplying bulk quantities of starch for various applications, including food processing, paper manufacturing, and pharmaceuticals. Additionally, large-scale plants often have access to ample sources of starch-rich raw materials and can leverage advanced technologies for starch extraction, purification, and recovery, further solidifying their dominance in the market. With increasing demand for starch-based ingredients and sustainable production practices, the Large Scale Plants segment continues to expand its market share, driving innovation and growth within the Starch Recovery Systems Market.
Starch Recovery Systems Market Segmentation
By Component
Refining sieves
Hydrocyclones and centrifuges
Vacuum filters
Screw conveyors
Filling stations
Others
By Application
Frozen products
Chips & snack pellets
Dehydrated products
Others
By Plant size
Large scale
Medium scale
Small scale
Countries Analyzed
North America (US, Canada, Mexico)
Europe (Germany, UK, France, Spain, Italy, Russia, Rest of Europe)
Asia Pacific (China, India, Japan, South Korea, Australia, South East Asia, Rest of Asia)
South America (Brazil, Argentina, Rest of South America)
Middle East and Africa (Saudi Arabia, UAE, Rest of Middle East, South Africa, Egypt, Rest of Africa)
Starch Recovery Systems Companies Profiled in the Study
Alfa Laval AB
Andritz
Flo-Mech
GEA Group AG
Hiller GmbH
Larsson Sweden
Microtec Engineering Group
Myande Group
NivobaHovex
Sino-Food Machinery
*- List Not Exhaustive
Chapter 1. TABLE OF CONTENTS
Chapter 2. Introduction to Starch Recovery Systems Market
2.1. Market Overview
2.2. Key Statistics and Report Highlights
2.3. Scope of the Comprehensive Study
2.3.1. Market Definition
2.3.2 Countries and Regions Covered
2.3.3 Research Objective
2.3.4 Units, Currency, and Conversions
2.3.5 Industry Value Chain
2.4. Key Market Segments
2.5. Key Companies
2.6. Study Period
Chapter 3. Strategic Analysis Review
3.1. Starch Recovery Systems Pricing Analysis and Forecast
3.2. Porter’s Five Forces
3.3. Market Ecosystem
3.4. SWOT Analysis
3.5. Regulatory Scenario
3.3. Effects of Inflation, Russia-Ukraine War, moderating economic growth, and other macroeconomic factors
Chapter 4. Competitive Landscape
4.1. Market Share Analysis
4.1.1. Global Starch Recovery Systems Market Share by Company, 2023
4.1.2. Product Offerings of Leading Starch Recovery Systems Companies
4.2. Market Entropy
4.2.1. New Product Launches in the Industry
4.2.2. Mergers, Acquisitions, Joint ventures, and Partnerships
4.3. Key Strategies and Best Practices
Chapter 5. Global Market Projections: Best, Reference, and Low Case Scenarios
5.1. Growth Analysis- Case Scenario Definitions
5.2. Low Growth Case Scenario Forecasts
5.3. Reference Growth Case Scenario Forecasts
5.4. High Growth Case Scenario Forecasts
Chapter 6. Market Dynamics
6.1. Starch Recovery Systems Market Drivers
6.2. Starch Recovery Systems Market Challenges
6.6. Starch Recovery Systems Market Opportunities
6.4. Starch Recovery Systems Market Trends
Chapter 7. Global Starch Recovery Systems Market Outlook Trends
7.1. Global Starch Recovery Systems Revenue (USD Million) and CAGR (%) by Type (2021-2032)
7.2. Global Starch Recovery Systems Revenue (USD Million) and CAGR (%) by Application (2021-2032)
7.3. Global Starch Recovery Systems Revenue (USD Million) and CAGR (%) by Product (2021-2032)
By Component
Refining sieves
Hydrocyclones and centrifuges
Vacuum filters
Screw conveyors
Filling stations
Others
By Application
Frozen products
Chips & snack pellets
Dehydrated products
Others
By Plant size
Large scale
Medium scale
Small scale
Chapter 8. Global Starch Recovery Systems Regional Analysis and Outlook
8.1. Global Starch Recovery Systems Revenue (USD Million) By Regions (2021- 2032)
8.2. North America Starch Recovery Systems Revenue (USD Million) by Country (2021-2032)
8.2.1. United States Starch Recovery Systems Regional Analysis and Outlook
8.2.2. Canada Starch Recovery Systems Regional Analysis and Outlook
8.2.3. Mexico Starch Recovery Systems Regional Analysis and Outlook
8.3. Europe Starch Recovery Systems Revenue (USD Million), by Country (2021-2032)
8.3.1. Germany Starch Recovery Systems Regional Analysis and Outlook
8.3.2. France Starch Recovery Systems Regional Analysis and Outlook
8.3.3. United Kingdom Starch Recovery Systems Regional Analysis and Outlook
8.3.4. Spain Starch Recovery Systems Regional Analysis and Outlook
8.3.5. Italy Starch Recovery Systems Regional Analysis and Outlook
8.3.6. Russia Starch Recovery Systems Regional Analysis and Outlook
8.3.7. Rest of Europe Starch Recovery Systems Regional Analysis and Outlook
8.4. Asia Pacific Starch Recovery Systems Revenue (USD Million) by Country (2021-2032)
8.4.1. China Starch Recovery Systems Regional Analysis and Outlook
8.4.2. Japan Starch Recovery Systems Regional Analysis and Outlook
8.4.3. India Starch Recovery Systems Regional Analysis and Outlook
8.4.4. South Korea Starch Recovery Systems Regional Analysis and Outlook
8.4.5. Australia Starch Recovery Systems Regional Analysis and Outlook
8.4.6. South East Asia Starch Recovery Systems Regional Analysis and Outlook
8.4.7. Rest of Asia Pacific Starch Recovery Systems Regional Analysis and Outlook
8.5. South America Starch Recovery Systems Revenue (USD Million), by Country (2021-2032)
8.5.1. Brazil Starch Recovery Systems Regional Analysis and Outlook
8.5.2. Argentina Starch Recovery Systems Regional Analysis and Outlook
8.5.3. Rest of South America Starch Recovery Systems Regional Analysis and Outlook
8.6. Middle East and Africa Starch Recovery Systems Revenue (USD Million) by Country (2021-2032)
8.6.1. Middle East Starch Recovery Systems Regional Analysis and Outlook
8.6.2. Africa Starch Recovery Systems Regional Analysis and Outlook
Chapter 9. North America Starch Recovery Systems Analysis and Outlook
9.1. North America Starch Recovery Systems Revenue (USD Million) by Segments (2021-2032)
9.1.1. North America Starch Recovery Systems Revenue (USD Million) by Type (2021-2032)
9.1.2. North America Starch Recovery Systems Revenue (USD Million) by Application (2021-2032)
9.1.3. North America Starch Recovery Systems Revenue (USD Million) by Product (2021-2032)
By Component
Refining sieves
Hydrocyclones and centrifuges
Vacuum filters
Screw conveyors
Filling stations
Others
By Application
Frozen products
Chips & snack pellets
Dehydrated products
Others
By Plant size
Large scale
Medium scale
Small scale
Chapter 10. Europe Starch Recovery Systems Analysis and Outlook
10.1. Europe Starch Recovery Systems Revenue (USD Million), by Segments (USD Million) (2021-2032)
10.1.1. Europe Starch Recovery Systems Revenue (USD Million) by Type (2021-2032)
10.1.2. Europe Starch Recovery Systems Revenue (USD Million) by Application (2021-2032)
10.1.3. Europe Starch Recovery Systems Revenue (USD Million) by Product (2021-2032)
By Component
Refining sieves
Hydrocyclones and centrifuges
Vacuum filters
Screw conveyors
Filling stations
Others
By Application
Frozen products
Chips & snack pellets
Dehydrated products
Others
By Plant size
Large scale
Medium scale
Small scale
Chapter 11. Asia Pacific Starch Recovery Systems Analysis and Outlook
11.1. Asia Pacific Starch Recovery Systems Revenue (USD Million), and Revenue (USD Million) by Segments (2021-2032)
11.1.1. Asia Pacific Starch Recovery Systems Revenue (USD Million) by Type (2021-2032)
11.1.2. Asia Pacific Starch Recovery Systems Revenue (USD Million) by Application (2021-2032)
11.1.3. Asia Pacific Starch Recovery Systems Revenue (USD Million) by Product (2021-2032)
By Component
Refining sieves
Hydrocyclones and centrifuges
Vacuum filters
Screw conveyors
Filling stations
Others
By Application
Frozen products
Chips & snack pellets
Dehydrated products
Others
By Plant size
Large scale
Medium scale
Small scale
Chapter 12. South America Starch Recovery Systems Analysis and Outlook
12.1. South America Starch Recovery Systems Revenue (USD Million), by Segments (2021-2032)
12.1.1. South America Starch Recovery Systems Revenue (USD Million) by Type (2021-2032)
12.1.2. South America Starch Recovery Systems Revenue (USD Million) by Application (2021-2032)
12.1.3. South America Starch Recovery Systems Revenue (USD Million) by Product (2021-2032)
By Component
Refining sieves
Hydrocyclones and centrifuges
Vacuum filters
Screw conveyors
Filling stations
Others
By Application
Frozen products
Chips & snack pellets
Dehydrated products
Others
By Plant size
Large scale
Medium scale
Small scale
Chapter 13. Middle East and Africa Starch Recovery Systems Analysis and Outlook
13.1. Middle East and Africa Starch Recovery Systems Revenue (USD Million), by Segments (2021-2032)
13.1.1. Middle East and Africa Starch Recovery Systems Revenue (USD Million) by Type (2021-2032)
13.1.2. Middle East and Africa Starch Recovery Systems Revenue (USD Million) by Application (2021-2032)
13.1.3. Middle East and Africa Starch Recovery Systems Revenue (USD Million) by Product (2021-2032)
By Component
Refining sieves
Hydrocyclones and centrifuges
Vacuum filters
Screw conveyors
Filling stations
Others
By Application
Frozen products
Chips & snack pellets
Dehydrated products
Others
By Plant size
Large scale
Medium scale
Small scale
Chapter 14. Starch Recovery Systems Company Profiles
14.1 Business Overview
14.2 Product Profiles
14.3 SWOT Profiles
14.5 Recent Developments
14.6 Financial Profile
List of Companies
Alfa Laval AB
Andritz
Flo-Mech
GEA Group AG
Hiller GmbH
Larsson Sweden
Microtec Engineering Group
Myande Group
NivobaHovex
Sino-Food Machinery
15. Methodology and Data Sources
15.1 Customization Offerings
15.2 Subscription Services
15.3 Related Reports
15.4 Publisher Expertise
LIST OF TABLES
Table 1 Market Segmentation Analysis
Table 2 Global Starch Recovery Systems Market Share of Leading Companies, 2023
Table 3 Product Offerings of Leading Companies
Table 4 Low Growth Scenario Forecasts
Table 5 Reference Case Growth Scenario
Table 6 High Growth Case Scenario
Table 7 Global Starch Recovery Systems Revenue (USD Million) And CAGR (%) By Type (2021-2032)
Table 8 Global Starch Recovery Systems Revenue (USD Million) And CAGR (%) By Application (2021-2032)
Table 9 Global Starch Recovery Systems Revenue (USD Million) And CAGR (%) By Product (2021-2032)
Table 10 Global Starch Recovery Systems Market Revenue (USD Million) By Regions (2021-2032)
Table 11 Global Starch Recovery Systems Market Share (%) By Regions (2021-2032)
Table 12 North America Starch Recovery Systems Revenue (USD Million) By Country (2021-2032)
Table 13 Europe Starch Recovery Systems Revenue (USD Million) By Country (2021-2032)
Table 14 Asia Pacific Starch Recovery Systems Revenue (USD Million) By Country (2021-2032)
Table 15 South America Starch Recovery Systems Revenue (USD Million) By Country (2021-2032)
Table 16 Middle East and Africa Starch Recovery Systems Revenue (USD Million) By Region (2021-2032)
Table 17 North America Starch Recovery Systems Revenue (USD Million) By Type (2021-2032)
Table 18 North America Starch Recovery Systems Revenue (USD Million) By Application (2021-2032)
Table 19 North America Starch Recovery Systems Revenue (USD Million) By Product (2021-2032)
Table 20 Europe Starch Recovery Systems Revenue (USD Million) By Type (2021-2032)
Table 21 Europe Starch Recovery Systems Revenue (USD Million) By Application (2021-2032)
Table 22 Europe Starch Recovery Systems Revenue (USD Million) By Product (2021-2032)
Table 23 Asia Pacific Starch Recovery Systems Revenue (USD Million) By Type (2021-2032)
Table 24 Asia Pacific Starch Recovery Systems Revenue (USD Million) By Application (2021-2032)
Table 25 Asia Pacific Starch Recovery Systems Revenue (USD Million) By Product (2021-2032)
Table 26 South America Starch Recovery Systems Revenue (USD Million) By Type (2021-2032)
Table 27 South America Starch Recovery Systems Revenue (USD Million) By Application (2021-2032)
Table 28 South America Starch Recovery Systems Revenue (USD Million) By Product (2021-2032)
Table 29 Middle East and Africa Starch Recovery Systems Revenue (USD Million) By Type (2021-2032)
Table 30 Middle East and Africa Starch Recovery Systems Revenue (USD Million) By Application (2021-2032)
Table 31 Middle East and Africa Starch Recovery Systems Revenue (USD Million) By Product (2021-2032)
LIST OF FIGURES
Figure 1. Market Scope
Figure 2. Pricing Forecasts Per Unit, 2023- 2032
Figure 3. Porter’s Five Forces
Figure 4. Global Starch Recovery Systems Market Revenue (USD Million) By Regions (2021-2032)
Figure 5. Global Starch Recovery Systems Market Share (%) By Regions (2023)
Figure 6. North America Starch Recovery Systems Revenue (USD Million) By Country (2021-2032)
Figure 7. United States Starch Recovery Systems Revenue (USD Million) By Country (2021-2032)
Figure 8. Canada Starch Recovery Systems Revenue (USD Million) By Country (2021-2032)
Figure 9. Mexico Starch Recovery Systems Revenue (USD Million) By Country (2021-2032)
Figure 10. Europe Starch Recovery Systems Revenue (USD Million) By Country (2021-2032)
Figure 11. Germany Starch Recovery Systems Revenue (USD Million) By Country (2021-2032)
Figure 12. France Starch Recovery Systems Revenue (USD Million) By Country (2021-2032)
Figure 13. United Kingdom Starch Recovery Systems Revenue (USD Million) By Country (2021-2032)
Figure 14. Spain Starch Recovery Systems Revenue (USD Million) By Country (2021-2032)
Figure 15. Italy Starch Recovery Systems Revenue (USD Million) By Country (2021-2032)
Figure 16. Russia Starch Recovery Systems Revenue (USD Million) By Country (2021-2032)
Figure 17. Rest of Europe Starch Recovery Systems Revenue (USD Million) By Country (2021-2032)
Figure 11. Asia Pacific Starch Recovery Systems Revenue (USD Million) By Country (2021-2032)
Figure 12. China Starch Recovery Systems Revenue (USD Million) By Country (2021-2032)
Figure 13. Japan Starch Recovery Systems Revenue (USD Million) By Country (2021-2032)
Figure 14. India Starch Recovery Systems Revenue (USD Million) By Country (2021-2032)
Figure 15. South Korea Starch Recovery Systems Revenue (USD Million) By Country (2021-2032)
Figure 16. Australia Starch Recovery Systems Revenue (USD Million) By Country (2021-2032)
Figure 17. South East Asia Starch Recovery Systems Revenue (USD Million) By Country (2021-2032)
Figure 18. South America Starch Recovery Systems Revenue (USD Million) By Country (2021-2032)
Figure 19. Brazil Starch Recovery Systems Revenue (USD Million) By Country (2021-2032)
Figure 20. Argentina Starch Recovery Systems Revenue (USD Million) By Country (2021-2032)
Figure 21. Rest of Asia Pacific Starch Recovery Systems Revenue (USD Million) By Country (2021-2032)
Figure 22. Middle East and Africa Starch Recovery Systems Revenue (USD Million) By Region (2021-2032)
Figure 23. Saudi Arabia Starch Recovery Systems Revenue (USD Million) By Region (2021-2032)
Figure 24. The UAE Starch Recovery Systems Revenue (USD Million) By Region (2021-2032)
Figure 25. Rest of Middle East Starch Recovery Systems Revenue (USD Million) By Region (2021-2032)
Figure 26. South Africa Starch Recovery Systems Revenue (USD Million) By Region (2021-2032)
Figure 27. Africa Starch Recovery Systems Revenue (USD Million) By Region (2021-2032)
Figure 28. North America Starch Recovery Systems Revenue (USD Million) By Type (2021-2032)
Figure 29. North America Starch Recovery Systems Revenue (USD Million) By Application (2021-2032)
Figure 30. North America Starch Recovery Systems Revenue (USD Million) By Product (2021-2032)
Figure 31. Europe Starch Recovery Systems Revenue (USD Million) By Type (2021-2032)
Figure 32. Europe Starch Recovery Systems Revenue (USD Million) By Application (2021-2032)
Figure 33. Europe Starch Recovery Systems Revenue (USD Million) By Product (2021-2032)
Figure 34. Asia Pacific Starch Recovery Systems Revenue (USD Million) By Type (2021-2032)
Figure 35. Asia Pacific Starch Recovery Systems Revenue (USD Million) By Application (2021-2032)
Figure 36. Asia Pacific Starch Recovery Systems Revenue (USD Million) By Product (2021-2032)
Figure 37. South America Starch Recovery Systems Revenue (USD Million) By Type (2021-2032)
Figure 38. South America Starch Recovery Systems Revenue (USD Million) By Application (2021-2032)
Figure 39. South America Starch Recovery Systems Revenue (USD Million) By Product (2021-2032)
Figure 40. Middle East and Africa Starch Recovery Systems Revenue (USD Million) By Type (2021-2032)
Figure 41. Middle East and Africa Starch Recovery Systems Revenue (USD Million) By Application (2021-2032)
Figure 42. Middle East and Africa Starch Recovery Systems Revenue (USD Million) By Product (2021-2032)
By Component
Refining sieves
Hydrocyclones and centrifuges
Vacuum filters
Screw conveyors
Filling stations
Others
By Application
Frozen products
Chips & snack pellets
Dehydrated products
Others
By Plant size
Large scale
Medium scale
Small scale
Countries Analyzed
North America (US, Canada, Mexico)
Europe (Germany, UK, France, Spain, Italy, Russia, Rest of Europe)
Asia Pacific (China, India, Japan, South Korea, Australia, South East Asia, Rest of Asia)
South America (Brazil, Argentina, Rest of South America)
Middle East and Africa (Saudi Arabia, UAE, Rest of Middle East, South Africa, Egypt, Rest of Africa)
