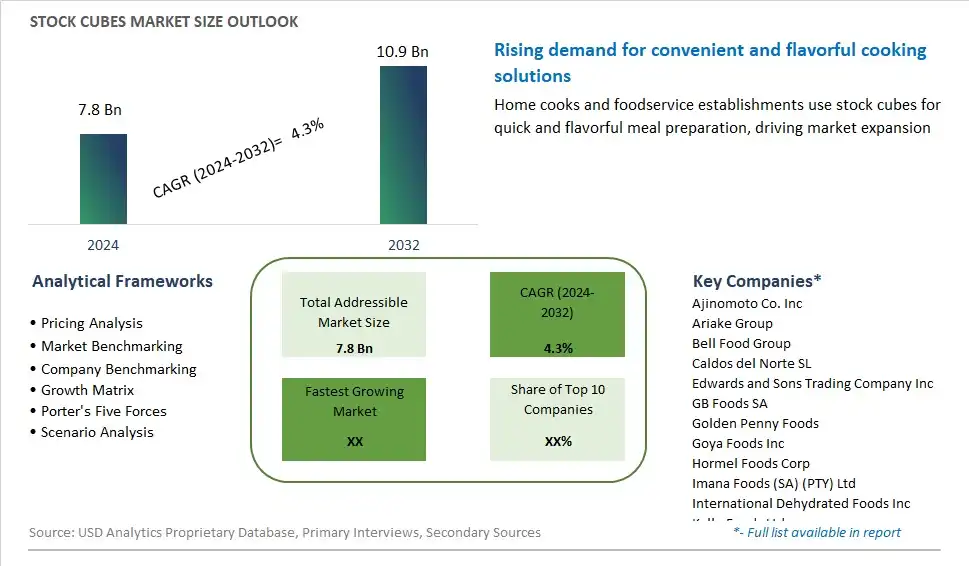
Global Stock Cubes Market Size is valued at $7.8 Billion in 2024 and is forecast to register a growth rate (CAGR) of 4.3% to reach $10.9 Billion by 2032.
The global Stock Cubes Market Comprehensive Study analyzes and forecasts the market size across 6 regions and 24 countries for diverse segments -By Type (Cubes, Granules, Powder, Others), By Product (Vegetables, Fish, Pork, Chicken, Beef), By Packaging (Boxes, Sachets Or Packets, Jars), By Nature (Organic, Vegan, Conventional), By sales channel (Food Processing Companies, Private Label Brands, Retail Sales, Food Service)
An Introduction to Stock Cubes Market
Stock cubes, also known as bouillon cubes or broth cubes, are concentrated flavoring agents widely used in culinary applications to enhance the taste and aroma of soups, stews, sauces, and gravies. In 2024, the market for stock cubes remains resilient, supported by the enduring popularity of convenience foods and the growing trend of home cooking. These compact cubes, typically composed of dehydrated broth, salt, seasonings, and flavor enhancers, offer a convenient and cost-effective solution for adding depth and richness to homemade dishes. Manufacturers are responding to evolving consumer preferences by offering a diverse array of stock cube variants, including vegetarian, organic, low-sodium, and allergen-free options. Additionally, innovations in packaging technology, such as individually wrapped cubes and portion-controlled formats, are enhancing convenience and shelf-life while minimizing food waste. The market is also witnessing increasing demand for premium and gourmet stock cubes, featuring high-quality ingredients and artisanal flavor profiles, catering to discerning home chefs and culinary enthusiasts.
Stock Cubes Competitive Landscape
The market report analyses the leading companies in the industry including Ajinomoto Co. Inc, Ariake Group, Bell Food Group, Caldos del Norte SL, Edwards and Sons Trading Company Inc, GB Foods SA, Golden Penny Foods, Goya Foods Inc, Hormel Foods Corp, Imana Foods (SA) (PTY) Ltd, International Dehydrated Foods Inc, Kallo Foods Ltd, Marigold Health Foods Ltd, Massel Australia Pty. Ltd, McCormick and Company Inc, Nestle SA, OXO Foods, Patisen, Promasidor, Rapunzel Naturkost GmbH, Tesco PLC, The Kraft Heinz Company, Unilever PLC, and Others.
Stock Cubes Market Dynamics
Stock Cubes Market Trend: Shift Towards Convenient Cooking Solutions
The market for Stock Cubes is experiencing a prominent trend driven by the increasing demand for convenient cooking solutions among consumers. With busy lifestyles and hectic schedules, consumers are seeking time-saving options that streamline meal preparation without compromising on taste or quality. Stock cubes offer a convenient way to add flavor and richness to dishes, providing a quick and easy solution for enhancing the taste of soups, stews, sauces, and gravies. This trend is reinforced by the growing popularity of home cooking and meal kits, where stock cubes serve as essential pantry staples for creating flavorful and satisfying meals with minimal effort.
Market Driver: Growing Preference for Homemade Flavors and Authenticity
The market for Stock Cubes is primarily driven by the growing preference for homemade flavors and authenticity in culinary experiences. As consumers become more discerning about the quality and origin of their food, there's a shift towards natural and authentic ingredients that replicate the taste and aroma of homemade dishes. Stock cubes, made from real meat, vegetables, herbs, and spices, offer a convenient way to infuse dishes with rich, savory flavors reminiscent of homemade broths and stocks. This driver is fueled by the desire for wholesome and comforting food experiences that evoke nostalgia and tradition, driving the adoption of stock cubes as essential flavor enhancers in home kitchens and professional cooking settings alike.
Market Opportunity: Innovation in Healthier and Specialty Varieties
The market for Stock Cubes presents a significant opportunity for innovation in healthier and specialty varieties to cater to evolving consumer preferences and dietary trends. With increasing emphasis on health and wellness, consumers are seeking alternatives to traditional stock cubes that are lower in sodium, free from artificial additives, and tailored to specific dietary requirements, such as vegetarian, vegan, gluten-free, or organic options. By leveraging innovative formulations and natural ingredients, manufacturers can develop healthier stock cube alternatives that resonate with health-conscious consumers seeking flavorful yet nutritious cooking solutions. Additionally, there's an opportunity to explore specialty varieties infused with unique flavor profiles, such as smoked, spicy, or ethnic-inspired options, to appeal to adventurous cooks and culinary enthusiasts looking to experiment with new flavors and cuisines. By capitalizing on these opportunities for innovation, companies can differentiate their product offerings, capture market share, and meet the diverse needs of today's discerning consumers.
Stock Cubes Market Share Analysis: Cubes held the dominant market share in 2024
In the Stock Cubes market, the "Cubes" segment is the largest, commanding significant prominence for several compelling reasons. Cubes are a classic and widely recognized form of stock seasoning, offering convenience and ease of use in culinary applications. With their compact size and precise portioning, stock cubes provide a convenient solution for flavoring soups, stews, sauces, and various dishes. Additionally, the solid form of cubes ensures longer shelf life and ease of storage compared to other forms such as granules or powder. Further, the distinct shape and texture of cubes make them a preferred choice for consumers seeking authenticity and tradition in their cooking. The ubiquitous presence of cube-shaped stock seasonings in households and professional kitchens alike further contributes to the dominance of the Cubes segment in the Stock Cubes market, shaping the landscape of culinary seasoning preferences globally.
Stock Cubes Market Share Analysis: Vegetable Stock Cubes market is poised to register the fastest growth rae over the forecast period to 2032
Vegetable stock cubes emerge as the fastest-growing segment in the Stock Cubes Market. The robust growth outlook is driven by the escalating consumer preference for plant-based diets, driven by health consciousness and environmental concerns. With the growing awareness of the detrimental effects of excessive meat consumption on personal health and the planet, more individuals are opting for vegetarian and vegan alternatives. Vegetable stock cubes cater to this burgeoning demand, offering a convenient and flavorsome substitute for traditional meat-based stocks. Further, the versatility of vegetable stock cubes makes them suitable for a wide range of cuisines, appealing to diverse consumer preferences. As dietary trends continue to shift towards plant-centric lifestyles, the vegetable stock cubes segment is poised for sustained growth, presenting lucrative opportunities for market players to innovate and capitalize on this burgeoning trend.
Stock Cubes Market Share Analysis: Boxes held the dominant market share in 2024
The Boxes segment stands out as the largest in the Stock Cubes Market by Packaging. This dominance can be attributed to several factors. Firstly, boxes offer a convenient and economical packaging solution, making them a popular choice among consumers seeking value for money. The sturdy and stackable nature of boxes enhances storage efficiency, appealing to households with limited space. Additionally, boxes provide ample space for branding and product information, facilitating effective marketing strategies to attract consumers. Furthermore, the traditional association of stock cubes with boxed packaging has entrenched consumer trust and familiarity with this format. As a result, manufacturers often prioritize innovation and product development within the boxed segment, further solidifying its position as the market leader. Overall, the Boxes segment's combination of practicality, affordability, and consumer preference cements its status as the largest segment in the Stock Cubes Market.
Stock Cubes Market Segmentation
By Type
Cubes
Granules
Powder
Others
By Product
Vegetables
Fish
Pork
Chicken
Beef
By Packaging
Boxes
Sachets Or Packets
Jars
By Nature
Organic
Vegan
Conventional
By sales channel
Food Processing Companies
Private Label Brands
Retail Sales
Food Service
Countries Analyzed
North America (US, Canada, Mexico)
Europe (Germany, UK, France, Spain, Italy, Russia, Rest of Europe)
Asia Pacific (China, India, Japan, South Korea, Australia, South East Asia, Rest of Asia)
South America (Brazil, Argentina, Rest of South America)
Middle East and Africa (Saudi Arabia, UAE, Rest of Middle East, South Africa, Egypt, Rest of Africa)
Stock Cubes Companies Profiled in the Study
Ajinomoto Co. Inc
Ariake Group
Bell Food Group
Caldos del Norte SL
Edwards and Sons Trading Company Inc
GB Foods SA
Golden Penny Foods
Goya Foods Inc
Hormel Foods Corp
Imana Foods (SA) (PTY) Ltd
International Dehydrated Foods Inc
Kallo Foods Ltd
Marigold Health Foods Ltd
Massel Australia Pty. Ltd
McCormick and Company Inc
Nestle SA
OXO Foods
Patisen
Promasidor
Rapunzel Naturkost GmbH
Tesco PLC
The Kraft Heinz Company
Unilever PLC
*- List Not Exhaustive
Chapter 1. TABLE OF CONTENTS
Chapter 2. Introduction to Stock Cubes Market
2.1. Market Overview
2.2. Key Statistics and Report Highlights
2.3. Scope of the Comprehensive Study
2.3.1. Market Definition
2.3.2 Countries and Regions Covered
2.3.3 Research Objective
2.3.4 Units, Currency, and Conversions
2.3.5 Industry Value Chain
2.4. Key Market Segments
2.5. Key Companies
2.6. Study Period
Chapter 3. Strategic Analysis Review
3.1. Stock Cubes Pricing Analysis and Forecast
3.2. Porter’s Five Forces
3.3. Market Ecosystem
3.4. SWOT Analysis
3.5. Regulatory Scenario
3.3. Effects of Inflation, Russia-Ukraine War, moderating economic growth, and other macroeconomic factors
Chapter 4. Competitive Landscape
4.1. Market Share Analysis
4.1.1. Global Stock Cubes Market Share by Company, 2023
4.1.2. Product Offerings of Leading Stock Cubes Companies
4.2. Market Entropy
4.2.1. New Product Launches in the Industry
4.2.2. Mergers, Acquisitions, Joint ventures, and Partnerships
4.3. Key Strategies and Best Practices
Chapter 5. Global Market Projections: Best, Reference, and Low Case Scenarios
5.1. Growth Analysis- Case Scenario Definitions
5.2. Low Growth Case Scenario Forecasts
5.3. Reference Growth Case Scenario Forecasts
5.4. High Growth Case Scenario Forecasts
Chapter 6. Market Dynamics
6.1. Stock Cubes Market Drivers
6.2. Stock Cubes Market Challenges
6.6. Stock Cubes Market Opportunities
6.4. Stock Cubes Market Trends
Chapter 7. Global Stock Cubes Market Outlook Trends
7.1. Global Stock Cubes Revenue (USD Million) and CAGR (%) by Type (2021-2032)
7.2. Global Stock Cubes Revenue (USD Million) and CAGR (%) by Application (2021-2032)
7.3. Global Stock Cubes Revenue (USD Million) and CAGR (%) by Product (2021-2032)
By Type
Cubes
Granules
Powder
Others
By Product
Vegetables
Fish
Pork
Chicken
Beef
By Packaging
Boxes
Sachets Or Packets
Jars
By Nature
Organic
Vegan
Conventional
By sales channel
Food Processing Companies
Private Label Brands
Retail Sales
Food Service
Chapter 8. Global Stock Cubes Regional Analysis and Outlook
8.1. Global Stock Cubes Revenue (USD Million) By Regions (2021- 2032)
8.2. North America Stock Cubes Revenue (USD Million) by Country (2021-2032)
8.2.1. United States Stock Cubes Regional Analysis and Outlook
8.2.2. Canada Stock Cubes Regional Analysis and Outlook
8.2.3. Mexico Stock Cubes Regional Analysis and Outlook
8.3. Europe Stock Cubes Revenue (USD Million), by Country (2021-2032)
8.3.1. Germany Stock Cubes Regional Analysis and Outlook
8.3.2. France Stock Cubes Regional Analysis and Outlook
8.3.3. United Kingdom Stock Cubes Regional Analysis and Outlook
8.3.4. Spain Stock Cubes Regional Analysis and Outlook
8.3.5. Italy Stock Cubes Regional Analysis and Outlook
8.3.6. Russia Stock Cubes Regional Analysis and Outlook
8.3.7. Rest of Europe Stock Cubes Regional Analysis and Outlook
8.4. Asia Pacific Stock Cubes Revenue (USD Million) by Country (2021-2032)
8.4.1. China Stock Cubes Regional Analysis and Outlook
8.4.2. Japan Stock Cubes Regional Analysis and Outlook
8.4.3. India Stock Cubes Regional Analysis and Outlook
8.4.4. South Korea Stock Cubes Regional Analysis and Outlook
8.4.5. Australia Stock Cubes Regional Analysis and Outlook
8.4.6. South East Asia Stock Cubes Regional Analysis and Outlook
8.4.7. Rest of Asia Pacific Stock Cubes Regional Analysis and Outlook
8.5. South America Stock Cubes Revenue (USD Million), by Country (2021-2032)
8.5.1. Brazil Stock Cubes Regional Analysis and Outlook
8.5.2. Argentina Stock Cubes Regional Analysis and Outlook
8.5.3. Rest of South America Stock Cubes Regional Analysis and Outlook
8.6. Middle East and Africa Stock Cubes Revenue (USD Million) by Country (2021-2032)
8.6.1. Middle East Stock Cubes Regional Analysis and Outlook
8.6.2. Africa Stock Cubes Regional Analysis and Outlook
Chapter 9. North America Stock Cubes Analysis and Outlook
9.1. North America Stock Cubes Revenue (USD Million) by Segments (2021-2032)
9.1.1. North America Stock Cubes Revenue (USD Million) by Type (2021-2032)
9.1.2. North America Stock Cubes Revenue (USD Million) by Application (2021-2032)
9.1.3. North America Stock Cubes Revenue (USD Million) by Product (2021-2032)
By Type
Cubes
Granules
Powder
Others
By Product
Vegetables
Fish
Pork
Chicken
Beef
By Packaging
Boxes
Sachets Or Packets
Jars
By Nature
Organic
Vegan
Conventional
By sales channel
Food Processing Companies
Private Label Brands
Retail Sales
Food Service
Chapter 10. Europe Stock Cubes Analysis and Outlook
10.1. Europe Stock Cubes Revenue (USD Million), by Segments (USD Million) (2021-2032)
10.1.1. Europe Stock Cubes Revenue (USD Million) by Type (2021-2032)
10.1.2. Europe Stock Cubes Revenue (USD Million) by Application (2021-2032)
10.1.3. Europe Stock Cubes Revenue (USD Million) by Product (2021-2032)
By Type
Cubes
Granules
Powder
Others
By Product
Vegetables
Fish
Pork
Chicken
Beef
By Packaging
Boxes
Sachets Or Packets
Jars
By Nature
Organic
Vegan
Conventional
By sales channel
Food Processing Companies
Private Label Brands
Retail Sales
Food Service
Chapter 11. Asia Pacific Stock Cubes Analysis and Outlook
11.1. Asia Pacific Stock Cubes Revenue (USD Million), and Revenue (USD Million) by Segments (2021-2032)
11.1.1. Asia Pacific Stock Cubes Revenue (USD Million) by Type (2021-2032)
11.1.2. Asia Pacific Stock Cubes Revenue (USD Million) by Application (2021-2032)
11.1.3. Asia Pacific Stock Cubes Revenue (USD Million) by Product (2021-2032)
By Type
Cubes
Granules
Powder
Others
By Product
Vegetables
Fish
Pork
Chicken
Beef
By Packaging
Boxes
Sachets Or Packets
Jars
By Nature
Organic
Vegan
Conventional
By sales channel
Food Processing Companies
Private Label Brands
Retail Sales
Food Service
Chapter 12. South America Stock Cubes Analysis and Outlook
12.1. South America Stock Cubes Revenue (USD Million), by Segments (2021-2032)
12.1.1. South America Stock Cubes Revenue (USD Million) by Type (2021-2032)
12.1.2. South America Stock Cubes Revenue (USD Million) by Application (2021-2032)
12.1.3. South America Stock Cubes Revenue (USD Million) by Product (2021-2032)
By Type
Cubes
Granules
Powder
Others
By Product
Vegetables
Fish
Pork
Chicken
Beef
By Packaging
Boxes
Sachets Or Packets
Jars
By Nature
Organic
Vegan
Conventional
By sales channel
Food Processing Companies
Private Label Brands
Retail Sales
Food Service
Chapter 13. Middle East and Africa Stock Cubes Analysis and Outlook
13.1. Middle East and Africa Stock Cubes Revenue (USD Million), by Segments (2021-2032)
13.1.1. Middle East and Africa Stock Cubes Revenue (USD Million) by Type (2021-2032)
13.1.2. Middle East and Africa Stock Cubes Revenue (USD Million) by Application (2021-2032)
13.1.3. Middle East and Africa Stock Cubes Revenue (USD Million) by Product (2021-2032)
By Type
Cubes
Granules
Powder
Others
By Product
Vegetables
Fish
Pork
Chicken
Beef
By Packaging
Boxes
Sachets Or Packets
Jars
By Nature
Organic
Vegan
Conventional
By sales channel
Food Processing Companies
Private Label Brands
Retail Sales
Food Service
Chapter 14. Stock Cubes Company Profiles
14.1 Business Overview
14.2 Product Profiles
14.3 SWOT Profiles
14.5 Recent Developments
14.6 Financial Profile
List of Companies
Ajinomoto Co. Inc
Ariake Group
Bell Food Group
Caldos del Norte SL
Edwards and Sons Trading Company Inc
GB Foods SA
Golden Penny Foods
Goya Foods Inc
Hormel Foods Corp
Imana Foods (SA) (PTY) Ltd
International Dehydrated Foods Inc
Kallo Foods Ltd
Marigold Health Foods Ltd
Massel Australia Pty. Ltd
McCormick and Company Inc
Nestle SA
OXO Foods
Patisen
Promasidor
Rapunzel Naturkost GmbH
Tesco PLC
The Kraft Heinz Company
Unilever PLC
15. Methodology and Data Sources
15.1 Customization Offerings
15.2 Subscription Services
15.3 Related Reports
15.4 Publisher Expertise
LIST OF TABLES
Table 1 Market Segmentation Analysis
Table 2 Global Stock Cubes Market Share of Leading Companies, 2023
Table 3 Product Offerings of Leading Companies
Table 4 Low Growth Scenario Forecasts
Table 5 Reference Case Growth Scenario
Table 6 High Growth Case Scenario
Table 7 Global Stock Cubes Revenue (USD Million) And CAGR (%) By Type (2021-2032)
Table 8 Global Stock Cubes Revenue (USD Million) And CAGR (%) By Application (2021-2032)
Table 9 Global Stock Cubes Revenue (USD Million) And CAGR (%) By Product (2021-2032)
Table 10 Global Stock Cubes Market Revenue (USD Million) By Regions (2021-2032)
Table 11 Global Stock Cubes Market Share (%) By Regions (2021-2032)
Table 12 North America Stock Cubes Revenue (USD Million) By Country (2021-2032)
Table 13 Europe Stock Cubes Revenue (USD Million) By Country (2021-2032)
Table 14 Asia Pacific Stock Cubes Revenue (USD Million) By Country (2021-2032)
Table 15 South America Stock Cubes Revenue (USD Million) By Country (2021-2032)
Table 16 Middle East and Africa Stock Cubes Revenue (USD Million) By Region (2021-2032)
Table 17 North America Stock Cubes Revenue (USD Million) By Type (2021-2032)
Table 18 North America Stock Cubes Revenue (USD Million) By Application (2021-2032)
Table 19 North America Stock Cubes Revenue (USD Million) By Product (2021-2032)
Table 20 Europe Stock Cubes Revenue (USD Million) By Type (2021-2032)
Table 21 Europe Stock Cubes Revenue (USD Million) By Application (2021-2032)
Table 22 Europe Stock Cubes Revenue (USD Million) By Product (2021-2032)
Table 23 Asia Pacific Stock Cubes Revenue (USD Million) By Type (2021-2032)
Table 24 Asia Pacific Stock Cubes Revenue (USD Million) By Application (2021-2032)
Table 25 Asia Pacific Stock Cubes Revenue (USD Million) By Product (2021-2032)
Table 26 South America Stock Cubes Revenue (USD Million) By Type (2021-2032)
Table 27 South America Stock Cubes Revenue (USD Million) By Application (2021-2032)
Table 28 South America Stock Cubes Revenue (USD Million) By Product (2021-2032)
Table 29 Middle East and Africa Stock Cubes Revenue (USD Million) By Type (2021-2032)
Table 30 Middle East and Africa Stock Cubes Revenue (USD Million) By Application (2021-2032)
Table 31 Middle East and Africa Stock Cubes Revenue (USD Million) By Product (2021-2032)
LIST OF FIGURES
Figure 1. Market Scope
Figure 2. Pricing Forecasts Per Unit, 2023- 2032
Figure 3. Porter’s Five Forces
Figure 4. Global Stock Cubes Market Revenue (USD Million) By Regions (2021-2032)
Figure 5. Global Stock Cubes Market Share (%) By Regions (2023)
Figure 6. North America Stock Cubes Revenue (USD Million) By Country (2021-2032)
Figure 7. United States Stock Cubes Revenue (USD Million) By Country (2021-2032)
Figure 8. Canada Stock Cubes Revenue (USD Million) By Country (2021-2032)
Figure 9. Mexico Stock Cubes Revenue (USD Million) By Country (2021-2032)
Figure 10. Europe Stock Cubes Revenue (USD Million) By Country (2021-2032)
Figure 11. Germany Stock Cubes Revenue (USD Million) By Country (2021-2032)
Figure 12. France Stock Cubes Revenue (USD Million) By Country (2021-2032)
Figure 13. United Kingdom Stock Cubes Revenue (USD Million) By Country (2021-2032)
Figure 14. Spain Stock Cubes Revenue (USD Million) By Country (2021-2032)
Figure 15. Italy Stock Cubes Revenue (USD Million) By Country (2021-2032)
Figure 16. Russia Stock Cubes Revenue (USD Million) By Country (2021-2032)
Figure 17. Rest of Europe Stock Cubes Revenue (USD Million) By Country (2021-2032)
Figure 11. Asia Pacific Stock Cubes Revenue (USD Million) By Country (2021-2032)
Figure 12. China Stock Cubes Revenue (USD Million) By Country (2021-2032)
Figure 13. Japan Stock Cubes Revenue (USD Million) By Country (2021-2032)
Figure 14. India Stock Cubes Revenue (USD Million) By Country (2021-2032)
Figure 15. South Korea Stock Cubes Revenue (USD Million) By Country (2021-2032)
Figure 16. Australia Stock Cubes Revenue (USD Million) By Country (2021-2032)
Figure 17. South East Asia Stock Cubes Revenue (USD Million) By Country (2021-2032)
Figure 18. South America Stock Cubes Revenue (USD Million) By Country (2021-2032)
Figure 19. Brazil Stock Cubes Revenue (USD Million) By Country (2021-2032)
Figure 20. Argentina Stock Cubes Revenue (USD Million) By Country (2021-2032)
Figure 21. Rest of Asia Pacific Stock Cubes Revenue (USD Million) By Country (2021-2032)
Figure 22. Middle East and Africa Stock Cubes Revenue (USD Million) By Region (2021-2032)
Figure 23. Saudi Arabia Stock Cubes Revenue (USD Million) By Region (2021-2032)
Figure 24. The UAE Stock Cubes Revenue (USD Million) By Region (2021-2032)
Figure 25. Rest of Middle East Stock Cubes Revenue (USD Million) By Region (2021-2032)
Figure 26. South Africa Stock Cubes Revenue (USD Million) By Region (2021-2032)
Figure 27. Africa Stock Cubes Revenue (USD Million) By Region (2021-2032)
Figure 28. North America Stock Cubes Revenue (USD Million) By Type (2021-2032)
Figure 29. North America Stock Cubes Revenue (USD Million) By Application (2021-2032)
Figure 30. North America Stock Cubes Revenue (USD Million) By Product (2021-2032)
Figure 31. Europe Stock Cubes Revenue (USD Million) By Type (2021-2032)
Figure 32. Europe Stock Cubes Revenue (USD Million) By Application (2021-2032)
Figure 33. Europe Stock Cubes Revenue (USD Million) By Product (2021-2032)
Figure 34. Asia Pacific Stock Cubes Revenue (USD Million) By Type (2021-2032)
Figure 35. Asia Pacific Stock Cubes Revenue (USD Million) By Application (2021-2032)
Figure 36. Asia Pacific Stock Cubes Revenue (USD Million) By Product (2021-2032)
Figure 37. South America Stock Cubes Revenue (USD Million) By Type (2021-2032)
Figure 38. South America Stock Cubes Revenue (USD Million) By Application (2021-2032)
Figure 39. South America Stock Cubes Revenue (USD Million) By Product (2021-2032)
Figure 40. Middle East and Africa Stock Cubes Revenue (USD Million) By Type (2021-2032)
Figure 41. Middle East and Africa Stock Cubes Revenue (USD Million) By Application (2021-2032)
Figure 42. Middle East and Africa Stock Cubes Revenue (USD Million) By Product (2021-2032)
By Type
Cubes
Granules
Powder
Others
By Product
Vegetables
Fish
Pork
Chicken
Beef
By Packaging
Boxes
Sachets Or Packets
Jars
By Nature
Organic
Vegan
Conventional
By sales channel
Food Processing Companies
Private Label Brands
Retail Sales
Food Service
Countries Analyzed
North America (US, Canada, Mexico)
Europe (Germany, UK, France, Spain, Italy, Russia, Rest of Europe)
Asia Pacific (China, India, Japan, South Korea, Australia, South East Asia, Rest of Asia)
South America (Brazil, Argentina, Rest of South America)
Middle East and Africa (Saudi Arabia, UAE, Rest of Middle East, South Africa, Egypt, Rest of Africa)
