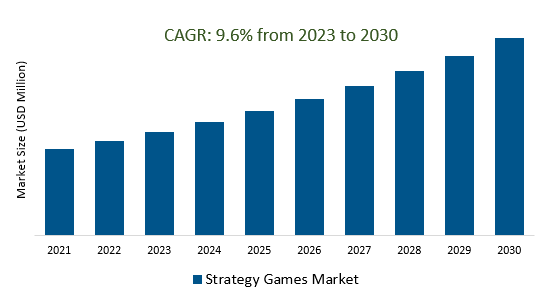
The global strategy games market Size is estimated to register 9.6% growth over the forecast period from 2023 to 2030.
The strategy games market is driven by several key factors and trends. Firstly, technological advancements continue to enhance the gaming experience, with improved hardware and graphics technology leading to more immersive games. The expansion of gaming platforms, including PCs, consoles, and mobile devices, is widening the audience for strategy games, and cross-platform play and cloud gaming are gaining importance. E-sports and competitive gaming are on the rise, particularly for real-time strategy and multiplayer online battle arena games, driving viewership and investment. Monetization models like free-to-play with in-game purchases and DLC are proving successful, and globalization efforts are targeting international markets with localized content. Community and social integration, IP licensing, and the growth of mobile strategy games are notable trends. Additionally, there's a focus on narrative and storytelling, genre fusion, AI improvements, VR and AR adoption, and ethical considerations related to game development. These drivers and trends collectively shape the strategy games market's growth and evolution.
The Rise of E-Sports is boosting the market.
The rise of E-Sports has had a profound impact on the strategy games market, fuelling its growth and popularity. With competitive gaming becoming a global phenomenon, strategy games have found a perfect niche within the E-Sports landscape. These games often require intricate planning, quick decision-making, and strategic thinking, making them ideal for competitive play. The competitive nature of E-Sports has encouraged developers to invest in enhancing the quality and competitiveness of strategy games. Esports tournaments and leagues dedicated to these games have attracted a massive following, leading to increased sales and player engagement. Furthermore, the rise of professional E-Sports teams specializing in strategy games has added a new layer of excitement and recognition to the genre, propelling it to new heights in the gaming industry.
The Rise of Cross-Platform Play and Cloud Gaming is creating a demand in the market.
The emergence of Cross-Platform Play and Cloud Gaming has ushered in a transformative era for the gaming industry. This groundbreaking trend is rapidly reshaping the landscape by allowing gamers to connect and compete across various platforms seamlessly. Cross-platform play is fostering a more inclusive and diverse gaming community, breaking down barriers between console, PC, and mobile gamers. Furthermore, the integration of Cloud Gaming services has opened new horizons for strategy game enthusiasts. It offers the convenience of playing complex, resource-intensive strategy titles on lower-end devices, reducing the hardware constraints traditionally associated with these games. As a result, developers are capitalizing on this growing demand, leading to an exciting surge in innovative strategy game titles and experiences, promising a bright future for both gamers and the industry alike.
The Use of Virtual Reality (VR) and Augmented Reality (AR) is attracting a wide customer base.
Virtual Reality (VR) and Augmented Reality (AR) have emerged as game-changing technologies in the strategy games market, captivating a diverse and growing customer base. VR immerses players in a completely digital environment, providing an unparalleled level of immersion and interactivity. This technology allows gamers to step into the shoes of military commanders, tacticians, or fantasy heroes, enhancing their strategic decision-making experience. Both VR and AR have expanded the horizons of the strategy games market, offering new and exciting ways for players to strategize and experience their favorite games. As technology continues to advance, the convergence of these immersive technologies with strategy gaming promises to further revolutionize the industry and attract an even wider and more enthusiastic audience.
Market Share Analysis:
In the strategy games market, in-app purchases reign supreme as the dominant monetization strategy.
This is primarily attributed to the willingness of strategy gamers to invest in in-game items, such as units, buildings, and resources, which can confer advantages in complex and time-intensive gameplay. In-app purchases offer versatile ways to monetize these games, ranging from temporary power-ups to permanent upgrades. The surge in popularity of free-to-play strategy games, relying solely on in-app purchases for revenue, has widened their accessibility and further bolstered this strategy's effectiveness. While advertising and paid apps remain alternative monetization methods, in-app purchases overwhelmingly drive the majority of revenue in the strategy games sector.
Client-based strategy games dominate the strategy games market.
Client-based games require players to download and install dedicated software on their computers for a more immersive and graphically demanding gaming experience compared to their web-based counterparts. Popular titles in this category include Civilization VI, Total War: Warhammer III, StarCraft II, League of Legends, Dota 2, and Counterstrike: Global Offensive. Although web-based strategy games are gaining popularity, they have not yet surpassed client-based games due to the latter's superior features and immersive gameplay.
The PC platform dominates the strategy games market.
The domination is primarily because of its superior power and performance, making it suitable for running demanding strategy games. PC gamers enjoy greater control over their gaming experience, with the ability to use mods and customizations to enhance gameplay. Additionally, the extensive library of strategy games available on PC, spanning various genres from real-time strategy to turn-based strategy, contributes to its dominance. While mobile gaming is gaining popularity for strategy games, it generally offers less complexity and demands due to the limitations of mobile devices in terms of processing power and battery life.
Asia Pacific is the most dominant region in the strategy games market.
The Asia Pacific region dominates the strategy games market, driven by its substantial and expanding gaming community and the surging appeal of mobile gaming. This growth can be attributed to several factors, including the widespread use of smartphones and mobile devices, the increasing popularity of esports and competitive gaming, the proliferation of high-speed internet access, and the rising number of regional game developers and publishers. Some of the most popular strategy games in the region include Clash of Clans, Rise of Kingdoms, State of Survival: Zombie War, PUBG Mobile, and Free Fire.
Strategy Games Market Segmentation
By Type
- Advertising
- In-App Purchase
- Paid App
By Category
- Client Type
- Web game Type
By Application
By Region
- North America (United States, Canada, Mexico)
- Europe (Germany, France, United Kingdom, Spain, Italy, Others)
- Asia Pacific (China, India, Japan, South Korea, Australia, Others)
- Latin America (Brazil, Argentina, Others)
- Middle East and Africa (Saudi Arabia, UAE, Kuwait, Other Middle East, South Africa, Nigeria, Other Africa)
Strategy Games Market Key Players
Leading Companies profiled in the study include-
- Blizzard
- Paradox Interactive
- Game-Labs
- Chucklefish
- Subset Games
- Games Workshop Group
- Ensemble Studios
- NGD Studios
- Wargaming Seattle
- Big Huge Games
- Creative Assembly
- TaleWorlds
- Firaxis Games
- Relic
*List not exhaustive
Strategy games Market Outlook 2023
1 Market Overview
1.1 Introduction to the Strategy games Market
1.2 Scope of the Study
1.3 Research Objective
1.3.1 Key Market Scope and Segments
1.3.2 Players Covered
1.3.3 Years Considered
2 Executive Summary
2.1 2023 Strategy games Industry- Market Statistics
3 Market Dynamics
3.1 Market Drivers
3.2 Market Challenges
3.3 Market Opportunities
3.4 Market Trends
4 Market Factor Analysis
4.1 Porter’s Five Forces
4.2 Market Entropy
4.2.1 Global Strategy games Market Companies with Area Served
4.2.2 Products Offerings Global Strategy games Market
5 COVID-19 Impact Analysis and Outlook Scenarios
5.1.1 Covid-19 Impact Analysis
5.1.2 Post-COVID-19 Scenario- Low Growth Case
5.1.3 Post-COVID-19 Scenario- Reference Growth Case
5.1.4 Post-COVID-19 Scenario- Low Growth Case
6 Global Strategy games Market Trends
6.1 Global Strategy games Revenue (USD Million) and CAGR (%) by Type (2018-2030)
6.2 Global Strategy games Revenue (USD Million) and CAGR (%) by Applications (2018-2030)
6.3 Global Strategy games Revenue (USD Million) and CAGR (%) by Regions (2018-2030)
7 Global Strategy games Market Revenue (USD Million) by Type, and Applications (2018-2022)
7.1 Global Strategy games Revenue (USD Million) by Type (2018-2022)
7.1.1 Global Strategy games Revenue (USD Million), Market Share (%) by Type (2018-2022)
7.2 Global Strategy games Revenue (USD Million) by Applications (2018-2022)
7.2.1 Global Strategy games Revenue (USD Million), Market Share (%) by Applications (2018-2022)
8 Global Strategy games Development Regional Status and Outlook
8.1 Global Strategy games Revenue (USD Million) By Regions (2018-2022)
8.2 North America Strategy games Revenue (USD Million) by Type, and Application (2018-2022)
8.2.1 North America Strategy games Revenue (USD Million) by Country (2018-2022)
8.2.2 North America Strategy games Revenue (USD Million) by Type (2018-2022)
8.2.3 North America Strategy games Revenue (USD Million) by Applications (2018-2022)
8.3 Europe Strategy games Revenue (USD Million), by Type, and Applications (USD Million) (2018-2022)
8.3.1 Europe Strategy games Revenue (USD Million), by Country (2018-2022)
8.3.2 Europe Strategy games Revenue (USD Million) by Type (2018-2022)
8.3.3 Europe Strategy games Revenue (USD Million) by Applications (2018-2022)
8.4 Asia Pacific Strategy games Revenue (USD Million), and Revenue (USD Million) by Type, and Applications (2018-2022)
8.4.1 Asia Pacific Strategy games Revenue (USD Million) by Country (2018-2022)
8.4.2 Asia Pacific Strategy games Revenue (USD Million) by Type (2018-2022)
8.4.3 Asia Pacific Strategy games Revenue (USD Million) by Applications (2018-2022)
8.5 South America Strategy games Revenue (USD Million), by Type, and Applications (2018-2022)
8.5.1 South America Strategy games Revenue (USD Million), by Country (2018-2022)
8.5.2 South America Strategy games Revenue (USD Million) by Type (2018-2022)
8.5.3 South America Strategy games Revenue (USD Million) by Applications (2018-2022)
8.6 Middle East and Africa Strategy games Revenue (USD Million), by Type, Technology, Application, Thickness (2018-2022)
8.6.1 Middle East and Africa Strategy games Revenue (USD Million) by Country (2018-2022)
8.6.2 Middle East and Africa Strategy games Revenue (USD Million) by Type (2018-2022)
8.6.3 Middle East and Africa Strategy games Revenue (USD Million) by Applications (2018-2022)
9 Company Profiles
10 Global Strategy games Market Revenue (USD Million), by Type, and Applications (2023-2030)
10.1 Global Strategy games Revenue (USD Million) and Market Share (%) by Type (2023-2030)
10.1.1 Global Strategy games Revenue (USD Million), and Market Share (%) by Type (2023-2030)
10.2 Global Strategy games Revenue (USD Million) and Market Share (%) by Applications (2023-2030)
10.2.1 Global Strategy games Revenue (USD Million), and Market Share (%) by Applications (2023-2030)
11 Global Strategy games Development Regional Status and Outlook Forecast
11.1 Global Strategy games Revenue (USD Million) By Regions (2023-2030)
11.2 North America Strategy games Revenue (USD Million) by Type, and Applications (2023-2030)
11.2.1 North America Strategy games Revenue (USD) Million by Country (2023-2030)
11.2.2 North America Strategy games Revenue (USD Million), by Type (2023-2030)
11.2.3 North America Strategy games Revenue (USD Million), Market Share (%) by Applications (2023-2030)
11.3 Europe Strategy games Revenue (USD Million), by Type, and Applications (2023-2030)
11.3.1 Europe Strategy games Revenue (USD Million), by Country (2023-2030)
11.3.2 Europe Strategy games Revenue (USD Million), by Type (2023-2030)
11.3.3 Europe Strategy games Revenue (USD Million), by Applications (2023-2030)
11.4 Asia Pacific Strategy games Revenue (USD Million) by Type, and Applications (2023-2030)
11.4.1 Asia Pacific Strategy games Revenue (USD Million), by Country (2023-2030)
11.4.2 Asia Pacific Strategy games Revenue (USD Million), by Type (2023-2030)
11.4.3 Asia Pacific Strategy games Revenue (USD Million), by Applications (2023-2030)
11.5 South America Strategy games Revenue (USD Million), by Type, and Applications (2023-2030)
11.5.1 South America Strategy games Revenue (USD Million), by Country (2023-2030)
11.5.2 South America Strategy games Revenue (USD Million), by Type (2023-2030)
11.5.3 South America Strategy games Revenue (USD Million), by Applications (2023-2030)
11.6 Middle East and Africa Strategy games Revenue (USD Million), by Type, and Applications (2023-2030)
11.6.1 Middle East and Africa Strategy games Revenue (USD Million), by Region (2023-2030)
11.6.2 Middle East and Africa Strategy games Revenue (USD Million), by Type (2023-2030)
11.6.3 Middle East and Africa Strategy games Revenue (USD Million), by Applications (2023-2030)
12 Methodology and Data Sources
12.1 Methodology/Research Approach
12.1.1 Research Programs/Design
12.1.2 Market Size Estimation
12.1.3 Market Breakdown and Data Triangulation
12.2 Data Sources
12.2.1 Secondary Sources
12.2.2 Primary Sources
12.3 Disclaimer
List of Tables
Table 1 Market Segmentation Analysis
Table 2 Global Strategy games Market Companies with Areas Served
Table 3 Products Offerings Global Strategy games Market
Table 4 Low Growth Scenario Forecasts
Table 5 Reference Case Growth Scenario
Table 6 High Growth Case Scenario
Table 7 Global Strategy games Revenue (USD Million) And CAGR (%) By Type (2018-2030)
Table 8 Global Strategy games Revenue (USD Million) And CAGR (%) By Applications (2018-2030)
Table 9 Global Strategy games Revenue (USD Million) And CAGR (%) By Regions (2018-2030)
Table 10 Global Strategy games Revenue (USD Million) By Type (2018-2022)
Table 11 Global Strategy games Revenue Market Share (%) By Type (2018-2022)
Table 12 Global Strategy games Revenue (USD Million) By Applications (2018-2022)
Table 13 Global Strategy games Revenue Market Share (%) By Applications (2018-2022)
Table 14 Global Strategy games Market Revenue (USD Million) By Regions (2018-2022)
Table 15 Global Strategy games Market Share (%) By Regions (2018-2022)
Table 16 North America Strategy games Revenue (USD Million) By Country (2018-2022)
Table 17 North America Strategy games Revenue (USD Million) By Type (2018-2022)
Table 18 North America Strategy games Revenue (USD Million) By Applications (2018-2022)
Table 19 Europe Strategy games Revenue (USD Million) By Country (2018-2022)
Table 20 Europe Strategy games Revenue (USD Million) By Type (2018-2022)
Table 21 Europe Strategy games Revenue (USD Million) By Applications (2018-2022)
Table 22 Asia Pacific Strategy games Revenue (USD Million) By Country (2018-2022)
Table 23 Asia Pacific Strategy games Revenue (USD Million) By Type (2018-2022)
Table 24 Asia Pacific Strategy games Revenue (USD Million) By Applications (2018-2022)
Table 25 South America Strategy games Revenue (USD Million) By Country (2018-2022)
Table 26 South America Strategy games Revenue (USD Million) By Type (2018-2022)
Table 27 South America Strategy games Revenue (USD Million) By Applications (2018-2022)
Table 28 Middle East and Africa Strategy games Revenue (USD Million) By Region (2018-2022)
Table 29 Middle East and Africa Strategy games Revenue (USD Million) By Type (2018-2022)
Table 30 Middle East and Africa Strategy games Revenue (USD Million) By Applications (2018-2022)
Table 31 Financial Analysis
Table 32 Global Strategy games Revenue (USD Million) By Type (2023-2030)
Table 33 Global Strategy games Revenue Market Share (%) By Type (2023-2030)
Table 34 Global Strategy games Revenue (USD Million) By Applications (2023-2030)
Table 35 Global Strategy games Revenue Market Share (%) By Applications (2023-2030)
Table 36 Global Strategy games Market Revenue (USD Million), And Revenue (USD Million) By Regions (2023-2030)
Table 37 North America Strategy games Revenue (USD)By Country (2023-2030)
Table 38 North America Strategy games Revenue (USD Million) By Type (2023-2030)
Table 39 North America Strategy games Revenue (USD Million) By Applications (2023-2030)
Table 40 Europe Strategy games Revenue (USD Million) By Country (2023-2030)
Table 41 Europe Strategy games Revenue (USD Million) By Type (2023-2030)
Table 42 Europe Strategy games Revenue (USD Million) By Applications (2023-2030)
Table 43 Asia Pacific Strategy games Revenue (USD Million) By Country (2023-2030)
Table 44 Asia Pacific Strategy games Revenue (USD Million) By Type (2023-2030)
Table 45 Asia Pacific Strategy games Revenue (USD Million) By Applications (2023-2030)
Table 46 South America Strategy games Revenue (USD Million) By Country (2023-2030)
Table 47 South America Strategy games Revenue (USD Million) By Type (2023-2030)
Table 48 South America Strategy games Revenue (USD Million) By Applications (2023-2030)
Table 49 Middle East and Africa Strategy games Revenue (USD Million) By Region (2023-2030)
Table 50 Middle East and Africa Strategy games Revenue (USD Million) By Region (2023-2030)
Table 51 Middle East and Africa Strategy games Revenue (USD Million) By Type (2023-2030)
Table 52 Middle East and Africa Strategy games Revenue (USD Million) By Applications (2023-2030)
Table 53 Research Programs/Design for This Report
Table 54 Key Data Information from Secondary Sources
Table 55 Key Data Information from Primary Sources
List of Figures
Figure 1 Market Scope
Figure 2 Porter’s Five Forces
Figure 3 Global Strategy games Revenue (USD Million) By Type (2018-2022)
Figure 4 Global Strategy games Revenue Market Share (%) By Type (2022)
Figure 5 Global Strategy games Revenue (USD Million) By Applications (2018-2022)
Figure 6 Global Strategy games Revenue Market Share (%) By Applications (2022)
Figure 7 Global Strategy games Market Revenue (USD Million) By Regions (2018-2022)
Figure 8 Global Strategy games Market Share (%) By Regions (2022)
Figure 9 North America Strategy games Revenue (USD Million) By Country (2018-2022)
Figure 10 North America Strategy games Revenue (USD Million) By Type (2018-2022)
Figure 11 North America Strategy games Revenue (USD Million) By Applications (2018-2022)
Figure 12 Europe Strategy games Revenue (USD Million) By Country (2018-2022)
Figure 13 Europe Strategy games Revenue (USD Million) By Type (2018-2022)
Figure 14 Europe Strategy games Revenue (USD Million) By Applications (2018-2022)
Figure 15 Asia Pacific Strategy games Revenue (USD Million) By Country (2018-2022)
Figure 16 Asia Pacific Strategy games Revenue (USD Million) By Type (2018-2022)
Figure 17 Asia Pacific Strategy games Revenue (USD Million) By Applications (2018-2022)
Figure 18 South America Strategy games Revenue (USD Million) By Country (2018-2022)
Figure 19 South America Strategy games Revenue (USD Million) By Type (2018-2022)
Figure 20 South America Strategy games Revenue (USD Million) By Applications (2018-2022)
Figure 21 Middle East and Africa Strategy games Revenue (USD Million) By Region (2018-2022)
Figure 22 Middle East and Africa Strategy games Revenue (USD Million) By Type (2018-2022)
Figure 23 Middle East and Africa Strategy games Revenue (USD Million) By Applications (2018-2022)
Figure 24 Global Strategy games Revenue (USD Million) By Type (2023-2030)
Figure 25 Global Strategy games Revenue Market Share (%) By Type (2030)
Figure 26 Global Strategy games Revenue (USD Million) By Applications (2023-2030)
Figure 27 Global Strategy games Revenue Market Share (%) By Applications (2030)
Figure 28 Global Strategy games Market Revenue (USD Million) By Regions (2023-2030)
Figure 29 North America Strategy games Revenue (USD Million) By Country (2023-2030)
Figure 30 North America Strategy games Revenue (USD Million) By Type (2023-2030)
Figure 31 North America Strategy games Revenue (USD Million) By Applications (2023-2030)
Figure 32 Europe Strategy games Revenue (USD Million) By Country (2023-2030)
Figure 33 Europe Strategy games Revenue (USD Million) By Type (2023-2030)
Figure 34 Europe Strategy games Revenue (USD Million) By Applications (2023-2030)
Figure 35 Asia Pacific Strategy games Revenue (USD Million) By Country (2023-2030)
Figure 36 Asia Pacific Strategy games Revenue (USD Million) By Type (2023-2030)
Figure 37 Asia Pacific Strategy games Revenue (USD Million) By Applications (2023-2030)
Figure 38 South America Strategy games Revenue (USD Million) By Country (2023-2030)
Figure 39 South America Strategy games Revenue (USD Million) By Type (2023-2030)
Figure 40 South America Strategy games Revenue (USD Million) By Applications (2023-2030)
Figure 41 Middle East and Africa Strategy games Revenue (USD Million) By Region (2023-2030)
Figure 42 Middle East and Africa Strategy games Revenue (USD Million) By Region (2023-2030)
Figure 43 Middle East and Africa Strategy games Revenue (USD Million) By Type (2023-2030)
Figure 44 Middle East and Africa Strategy games Revenue (USD Million) By Applications (2023-2030)
Figure 45 Bottom-Up and Top-Down Approaches For This Report
Figure 46 Data Triangulation
