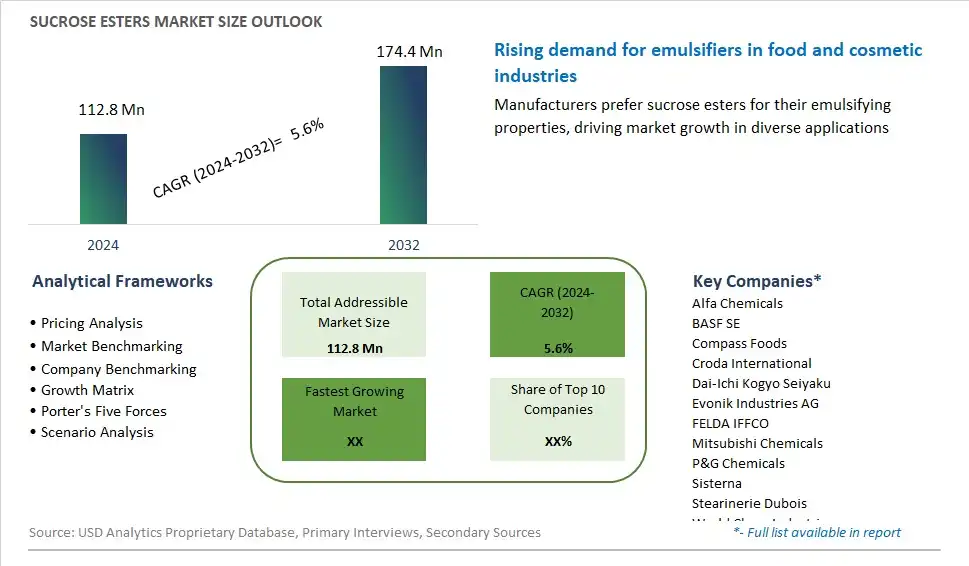
Global Sucrose Esters Market Size is valued at $112.8 Million in 2024 and is forecast to register a growth rate (CAGR) of 5.6% to reach $174.4 Million by 2032.
The global Sucrose Esters Market Comprehensive Study analyzes and forecasts the market size across 6 regions and 24 countries for diverse segments -By Form (Powder, Liquid, Pellet), By Function (Protein & Starch Interaction, Antimicrobial Property, Controlled Sugar Crystallization, Emulsification, Aeration), By Application (Food, Personal Care Products, Detergents & Cleansers, Others)
An Introduction to Sucrose Esters Market
Sucrose esters are a class of food additives widely used as emulsifiers, stabilizers, and surfactants in various food and beverage products in 2024. These compounds are derived from sucrose and fatty acids and are known for their ability to improve the texture, shelf life, and sensory attributes of food formulations. Sucrose esters are commonly used in bakery products, dairy desserts, confectionery items, and beverages to enhance emulsion stability, reduce fat content, and improve mouthfeel. With their versatile functionality and clean label appeal, sucrose esters are increasingly favored by food manufacturers seeking natural and effective ingredients to meet consumer demands for quality, convenience, and health-conscious options. The market for sucrose esters is expanding, driven by innovations in formulation technology, regulatory approvals, and consumer preferences for clean label and functional ingredients in food products.
Sucrose Esters Competitive Landscape
The market report analyses the leading companies in the industry including Alfa Chemicals, BASF SE, Compass Foods, Croda International, Dai-Ichi Kogyo Seiyaku, Evonik Industries AG, FELDA IFFCO, Mitsubishi Chemicals, P&G Chemicals, Sisterna, Stearinerie Dubois, World Chem Industries, and Others.
Sucrose Esters Market Dynamics
Sucrose Esters Market Trend: Increasing Demand for Clean Label and Natural Ingredients
A prominent market trend for sucrose esters is the increasing demand for clean label and natural ingredients in food and beverage products. Consumers are becoming more conscious about the ingredients used in their food, leading to a preference for products with simpler and more natural ingredient lists. Sucrose esters, derived from sugar and fatty acids, are perceived as natural emulsifiers and stabilizers, making them attractive ingredients for clean label formulations. Food manufacturers are incorporating sucrose esters into a wide range of products, including bakery goods, confectionery, dairy products, and beverages, to meet consumer demand for natural and minimally processed foods.
Market Driver: Functional Benefits and Versatility in Food Applications
A significant market driver for sucrose esters is their functional benefits and versatility in food applications. Sucrose esters serve as effective emulsifiers, stabilizers, and surfactants, enabling improved texture, mouthfeel, and shelf stability in various food and beverage formulations. They are widely used in food processing to create smooth textures, prevent ingredient separation, and enhance product consistency. Moreover, sucrose esters can function across a broad pH range and tolerate high temperatures, making them suitable for a wide range of food processing conditions. As food manufacturers seek ingredients that can enhance product performance and meet specific formulation requirements, sucrose esters present as a valuable solution due to their functional versatility and efficacy.
Market Opportunity: Expansion into Clean Label and Plant-Based Product Development
An opportunity within the sucrose esters market lies in the expansion into clean label and plant-based product development. With the growing consumer demand for clean label alternatives and plant-based foods, there is an opportunity for sucrose esters suppliers to position their products as natural and sustainable ingredients for these applications. Sucrose esters can play a crucial role in clean label formulations by replacing synthetic emulsifiers and stabilizers while maintaining product quality and functionality. Additionally, as plant-based alternatives continue to gain traction in various food and beverage categories, sucrose esters offer formulators an effective means to achieve desired textures and stability in plant-based products, thereby tapping into the expanding market for plant-based alternatives across global markets. By leveraging their functional benefits and aligning with clean label and plant-based trends, suppliers of sucrose esters can capitalize on the growing opportunities in the food industry.
Sucrose Esters Market Share Analysis: Powder Form held the dominant market share in 2024
Within the Sucrose Esters Market, the Powder Form segment is the largest category, primarily due to its ease of handling, versatility, and extensive applications across various industries. Powdered sucrose esters offer a convenient and concentrated form of emulsifiers and stabilizers, making them highly desirable for food and beverage manufacturers. Their fine particle size allows for rapid dispersion and uniform distribution within product formulations, enhancing emulsification, texture, and shelf stability. Additionally, powdered sucrose esters are favored for their compatibility with a wide range of ingredients and processing conditions, making them suitable for use in diverse applications such as bakery products, confectionery, dairy, and beverages. Further, the powdered form's longer shelf life and ease of storage compared to liquid and pellet forms contribute to its dominance in the market. With increasing consumer demand for clean label ingredients and functional food additives, the Powder Form segment continues to lead the Sucrose Esters Market, presenting significant opportunities for manufacturers to innovate and expand their product offerings to meet evolving industry needs.
Sucrose Esters Market Share Analysis: Antimicrobial Property market is poised to register the fastest growth rae over the forecast period to 2032
Among the functions in the Sucrose Esters Market, the Antimicrobial Property segment is the fastest-growing category, fueled by increasing demand for natural preservatives and shelf-life extenders in food and beverage products. Sucrose esters with antimicrobial properties offer effective solutions for inhibiting the growth of spoilage microorganisms and pathogens, thereby enhancing product safety and extending shelf life. As consumers prioritize food safety and seek healthier, minimally processed options, manufacturers are increasingly incorporating antimicrobial sucrose esters into a wide range of products, including bakery goods, dairy products, beverages, and ready-to-eat meals. Further, the antimicrobial properties of sucrose esters complement clean label trends, as they provide an alternative to synthetic preservatives while ensuring product integrity and quality. With stringent regulations on food safety and hygiene, coupled with rising consumer awareness of foodborne illnesses, the Antimicrobial Property segment is poised for rapid growth, presenting lucrative opportunities for manufacturers to meet the evolving demands of the food and beverage industry within the Sucrose Esters Market.
Sucrose Esters Market Share Analysis: Food held the dominant market share in 2024
Within the Sucrose Esters Market, the Food segment is the largest category, driven by the extensive applications of sucrose esters across various food products and subcategories. Sucrose esters are widely used in dairy products, confectioneries, bakery products, beverages, soups & sauces, meat products, cereals, and other food items as emulsifiers, stabilizers, and flavor enhancers. In dairy products, sucrose esters improve texture, mouthfeel, and stability, while in confectioneries and bakery products, they aid in emulsification, foam stabilization, and moisture retention. Further, sucrose esters enhance the sensory attributes and shelf stability of beverages, soups & sauces, and meat products, contributing to their overall quality and consumer acceptance. With the growing demand for processed foods, convenience products, and functional ingredients in the food industry, the Food segment continues to dominate the Sucrose Esters Market, presenting significant opportunities for manufacturers to innovate and diversify their product offerings to meet evolving consumer needs and preferences.
Sucrose Esters Market Segmentation
By Form
Powder
Liquid
Pellet
By Function
Protein & Starch Interaction
Antimicrobial Property
Controlled Sugar Crystallization
Emulsification
Aeration
By Application
Food
-Dairy Products
-Confectioneries
-Bakery Products
-Beverages
-Soups & Sauces
-Meat Products
-Cereals
-Others
Personal Care Products
Detergents & Cleansers
Others
Countries Analyzed
North America (US, Canada, Mexico)
Europe (Germany, UK, France, Spain, Italy, Russia, Rest of Europe)
Asia Pacific (China, India, Japan, South Korea, Australia, South East Asia, Rest of Asia)
South America (Brazil, Argentina, Rest of South America)
Middle East and Africa (Saudi Arabia, UAE, Rest of Middle East, South Africa, Egypt, Rest of Africa)
Sucrose Esters Companies Profiled in the Study
Alfa Chemicals
BASF SE
Compass Foods
Croda International
Dai-Ichi Kogyo Seiyaku
Evonik Industries AG
FELDA IFFCO
Mitsubishi Chemicals
P&G Chemicals
Sisterna
Stearinerie Dubois
World Chem Industries
*- List Not Exhaustive
Chapter 1. TABLE OF CONTENTS
Chapter 2. Introduction to Sucrose Esters Market
2.1. Market Overview
2.2. Key Statistics and Report Highlights
2.3. Scope of the Comprehensive Study
2.3.1. Market Definition
2.3.2 Countries and Regions Covered
2.3.3 Research Objective
2.3.4 Units, Currency, and Conversions
2.3.5 Industry Value Chain
2.4. Key Market Segments
2.5. Key Companies
2.6. Study Period
Chapter 3. Strategic Analysis Review
3.1. Sucrose Esters Pricing Analysis and Forecast
3.2. Porter’s Five Forces
3.3. Market Ecosystem
3.4. SWOT Analysis
3.5. Regulatory Scenario
3.3. Effects of Inflation, Russia-Ukraine War, moderating economic growth, and other macroeconomic factors
Chapter 4. Competitive Landscape
4.1. Market Share Analysis
4.1.1. Global Sucrose Esters Market Share by Company, 2023
4.1.2. Product Offerings of Leading Sucrose Esters Companies
4.2. Market Entropy
4.2.1. New Product Launches in the Industry
4.2.2. Mergers, Acquisitions, Joint ventures, and Partnerships
4.3. Key Strategies and Best Practices
Chapter 5. Global Market Projections: Best, Reference, and Low Case Scenarios
5.1. Growth Analysis- Case Scenario Definitions
5.2. Low Growth Case Scenario Forecasts
5.3. Reference Growth Case Scenario Forecasts
5.4. High Growth Case Scenario Forecasts
Chapter 6. Market Dynamics
6.1. Sucrose Esters Market Drivers
6.2. Sucrose Esters Market Challenges
6.6. Sucrose Esters Market Opportunities
6.4. Sucrose Esters Market Trends
Chapter 7. Global Sucrose Esters Market Outlook Trends
7.1. Global Sucrose Esters Revenue (USD Million) and CAGR (%) by Type (2021-2032)
7.2. Global Sucrose Esters Revenue (USD Million) and CAGR (%) by Application (2021-2032)
7.3. Global Sucrose Esters Revenue (USD Million) and CAGR (%) by Product (2021-2032)
By Form
Powder
Liquid
Pellet
By Function
Protein & Starch Interaction
Antimicrobial Property
Controlled Sugar Crystallization
Emulsification
Aeration
By Application
Food
-Dairy Products
-Confectioneries
-Bakery Products
-Beverages
-Soups & Sauces
-Meat Products
-Cereals
-Others
Personal Care Products
Detergents & Cleansers
Others
Chapter 8. Global Sucrose Esters Regional Analysis and Outlook
8.1. Global Sucrose Esters Revenue (USD Million) By Regions (2021- 2032)
8.2. North America Sucrose Esters Revenue (USD Million) by Country (2021-2032)
8.2.1. United States Sucrose Esters Regional Analysis and Outlook
8.2.2. Canada Sucrose Esters Regional Analysis and Outlook
8.2.3. Mexico Sucrose Esters Regional Analysis and Outlook
8.3. Europe Sucrose Esters Revenue (USD Million), by Country (2021-2032)
8.3.1. Germany Sucrose Esters Regional Analysis and Outlook
8.3.2. France Sucrose Esters Regional Analysis and Outlook
8.3.3. United Kingdom Sucrose Esters Regional Analysis and Outlook
8.3.4. Spain Sucrose Esters Regional Analysis and Outlook
8.3.5. Italy Sucrose Esters Regional Analysis and Outlook
8.3.6. Russia Sucrose Esters Regional Analysis and Outlook
8.3.7. Rest of Europe Sucrose Esters Regional Analysis and Outlook
8.4. Asia Pacific Sucrose Esters Revenue (USD Million) by Country (2021-2032)
8.4.1. China Sucrose Esters Regional Analysis and Outlook
8.4.2. Japan Sucrose Esters Regional Analysis and Outlook
8.4.3. India Sucrose Esters Regional Analysis and Outlook
8.4.4. South Korea Sucrose Esters Regional Analysis and Outlook
8.4.5. Australia Sucrose Esters Regional Analysis and Outlook
8.4.6. South East Asia Sucrose Esters Regional Analysis and Outlook
8.4.7. Rest of Asia Pacific Sucrose Esters Regional Analysis and Outlook
8.5. South America Sucrose Esters Revenue (USD Million), by Country (2021-2032)
8.5.1. Brazil Sucrose Esters Regional Analysis and Outlook
8.5.2. Argentina Sucrose Esters Regional Analysis and Outlook
8.5.3. Rest of South America Sucrose Esters Regional Analysis and Outlook
8.6. Middle East and Africa Sucrose Esters Revenue (USD Million) by Country (2021-2032)
8.6.1. Middle East Sucrose Esters Regional Analysis and Outlook
8.6.2. Africa Sucrose Esters Regional Analysis and Outlook
Chapter 9. North America Sucrose Esters Analysis and Outlook
9.1. North America Sucrose Esters Revenue (USD Million) by Segments (2021-2032)
9.1.1. North America Sucrose Esters Revenue (USD Million) by Type (2021-2032)
9.1.2. North America Sucrose Esters Revenue (USD Million) by Application (2021-2032)
9.1.3. North America Sucrose Esters Revenue (USD Million) by Product (2021-2032)
By Form
Powder
Liquid
Pellet
By Function
Protein & Starch Interaction
Antimicrobial Property
Controlled Sugar Crystallization
Emulsification
Aeration
By Application
Food
-Dairy Products
-Confectioneries
-Bakery Products
-Beverages
-Soups & Sauces
-Meat Products
-Cereals
-Others
Personal Care Products
Detergents & Cleansers
Others
Chapter 10. Europe Sucrose Esters Analysis and Outlook
10.1. Europe Sucrose Esters Revenue (USD Million), by Segments (USD Million) (2021-2032)
10.1.1. Europe Sucrose Esters Revenue (USD Million) by Type (2021-2032)
10.1.2. Europe Sucrose Esters Revenue (USD Million) by Application (2021-2032)
10.1.3. Europe Sucrose Esters Revenue (USD Million) by Product (2021-2032)
By Form
Powder
Liquid
Pellet
By Function
Protein & Starch Interaction
Antimicrobial Property
Controlled Sugar Crystallization
Emulsification
Aeration
By Application
Food
-Dairy Products
-Confectioneries
-Bakery Products
-Beverages
-Soups & Sauces
-Meat Products
-Cereals
-Others
Personal Care Products
Detergents & Cleansers
Others
Chapter 11. Asia Pacific Sucrose Esters Analysis and Outlook
11.1. Asia Pacific Sucrose Esters Revenue (USD Million), and Revenue (USD Million) by Segments (2021-2032)
11.1.1. Asia Pacific Sucrose Esters Revenue (USD Million) by Type (2021-2032)
11.1.2. Asia Pacific Sucrose Esters Revenue (USD Million) by Application (2021-2032)
11.1.3. Asia Pacific Sucrose Esters Revenue (USD Million) by Product (2021-2032)
By Form
Powder
Liquid
Pellet
By Function
Protein & Starch Interaction
Antimicrobial Property
Controlled Sugar Crystallization
Emulsification
Aeration
By Application
Food
-Dairy Products
-Confectioneries
-Bakery Products
-Beverages
-Soups & Sauces
-Meat Products
-Cereals
-Others
Personal Care Products
Detergents & Cleansers
Others
Chapter 12. South America Sucrose Esters Analysis and Outlook
12.1. South America Sucrose Esters Revenue (USD Million), by Segments (2021-2032)
12.1.1. South America Sucrose Esters Revenue (USD Million) by Type (2021-2032)
12.1.2. South America Sucrose Esters Revenue (USD Million) by Application (2021-2032)
12.1.3. South America Sucrose Esters Revenue (USD Million) by Product (2021-2032)
By Form
Powder
Liquid
Pellet
By Function
Protein & Starch Interaction
Antimicrobial Property
Controlled Sugar Crystallization
Emulsification
Aeration
By Application
Food
-Dairy Products
-Confectioneries
-Bakery Products
-Beverages
-Soups & Sauces
-Meat Products
-Cereals
-Others
Personal Care Products
Detergents & Cleansers
Others
Chapter 13. Middle East and Africa Sucrose Esters Analysis and Outlook
13.1. Middle East and Africa Sucrose Esters Revenue (USD Million), by Segments (2021-2032)
13.1.1. Middle East and Africa Sucrose Esters Revenue (USD Million) by Type (2021-2032)
13.1.2. Middle East and Africa Sucrose Esters Revenue (USD Million) by Application (2021-2032)
13.1.3. Middle East and Africa Sucrose Esters Revenue (USD Million) by Product (2021-2032)
By Form
Powder
Liquid
Pellet
By Function
Protein & Starch Interaction
Antimicrobial Property
Controlled Sugar Crystallization
Emulsification
Aeration
By Application
Food
-Dairy Products
-Confectioneries
-Bakery Products
-Beverages
-Soups & Sauces
-Meat Products
-Cereals
-Others
Personal Care Products
Detergents & Cleansers
Others
Chapter 14. Sucrose Esters Company Profiles
14.1 Business Overview
14.2 Product Profiles
14.3 SWOT Profiles
14.5 Recent Developments
14.6 Financial Profile
List of Companies
Alfa Chemicals
BASF SE
Compass Foods
Croda International
Dai-Ichi Kogyo Seiyaku
Evonik Industries AG
FELDA IFFCO
Mitsubishi Chemicals
P&G Chemicals
Sisterna
Stearinerie Dubois
World Chem Industries
15. Methodology and Data Sources
15.1 Customization Offerings
15.2 Subscription Services
15.3 Related Reports
15.4 Publisher Expertise
LIST OF TABLES
Table 1 Market Segmentation Analysis
Table 2 Global Sucrose Esters Market Share of Leading Companies, 2023
Table 3 Product Offerings of Leading Companies
Table 4 Low Growth Scenario Forecasts
Table 5 Reference Case Growth Scenario
Table 6 High Growth Case Scenario
Table 7 Global Sucrose Esters Revenue (USD Million) And CAGR (%) By Type (2021-2032)
Table 8 Global Sucrose Esters Revenue (USD Million) And CAGR (%) By Application (2021-2032)
Table 9 Global Sucrose Esters Revenue (USD Million) And CAGR (%) By Product (2021-2032)
Table 10 Global Sucrose Esters Market Revenue (USD Million) By Regions (2021-2032)
Table 11 Global Sucrose Esters Market Share (%) By Regions (2021-2032)
Table 12 North America Sucrose Esters Revenue (USD Million) By Country (2021-2032)
Table 13 Europe Sucrose Esters Revenue (USD Million) By Country (2021-2032)
Table 14 Asia Pacific Sucrose Esters Revenue (USD Million) By Country (2021-2032)
Table 15 South America Sucrose Esters Revenue (USD Million) By Country (2021-2032)
Table 16 Middle East and Africa Sucrose Esters Revenue (USD Million) By Region (2021-2032)
Table 17 North America Sucrose Esters Revenue (USD Million) By Type (2021-2032)
Table 18 North America Sucrose Esters Revenue (USD Million) By Application (2021-2032)
Table 19 North America Sucrose Esters Revenue (USD Million) By Product (2021-2032)
Table 20 Europe Sucrose Esters Revenue (USD Million) By Type (2021-2032)
Table 21 Europe Sucrose Esters Revenue (USD Million) By Application (2021-2032)
Table 22 Europe Sucrose Esters Revenue (USD Million) By Product (2021-2032)
Table 23 Asia Pacific Sucrose Esters Revenue (USD Million) By Type (2021-2032)
Table 24 Asia Pacific Sucrose Esters Revenue (USD Million) By Application (2021-2032)
Table 25 Asia Pacific Sucrose Esters Revenue (USD Million) By Product (2021-2032)
Table 26 South America Sucrose Esters Revenue (USD Million) By Type (2021-2032)
Table 27 South America Sucrose Esters Revenue (USD Million) By Application (2021-2032)
Table 28 South America Sucrose Esters Revenue (USD Million) By Product (2021-2032)
Table 29 Middle East and Africa Sucrose Esters Revenue (USD Million) By Type (2021-2032)
Table 30 Middle East and Africa Sucrose Esters Revenue (USD Million) By Application (2021-2032)
Table 31 Middle East and Africa Sucrose Esters Revenue (USD Million) By Product (2021-2032)
LIST OF FIGURES
Figure 1. Market Scope
Figure 2. Pricing Forecasts Per Unit, 2023- 2032
Figure 3. Porter’s Five Forces
Figure 4. Global Sucrose Esters Market Revenue (USD Million) By Regions (2021-2032)
Figure 5. Global Sucrose Esters Market Share (%) By Regions (2023)
Figure 6. North America Sucrose Esters Revenue (USD Million) By Country (2021-2032)
Figure 7. United States Sucrose Esters Revenue (USD Million) By Country (2021-2032)
Figure 8. Canada Sucrose Esters Revenue (USD Million) By Country (2021-2032)
Figure 9. Mexico Sucrose Esters Revenue (USD Million) By Country (2021-2032)
Figure 10. Europe Sucrose Esters Revenue (USD Million) By Country (2021-2032)
Figure 11. Germany Sucrose Esters Revenue (USD Million) By Country (2021-2032)
Figure 12. France Sucrose Esters Revenue (USD Million) By Country (2021-2032)
Figure 13. United Kingdom Sucrose Esters Revenue (USD Million) By Country (2021-2032)
Figure 14. Spain Sucrose Esters Revenue (USD Million) By Country (2021-2032)
Figure 15. Italy Sucrose Esters Revenue (USD Million) By Country (2021-2032)
Figure 16. Russia Sucrose Esters Revenue (USD Million) By Country (2021-2032)
Figure 17. Rest of Europe Sucrose Esters Revenue (USD Million) By Country (2021-2032)
Figure 11. Asia Pacific Sucrose Esters Revenue (USD Million) By Country (2021-2032)
Figure 12. China Sucrose Esters Revenue (USD Million) By Country (2021-2032)
Figure 13. Japan Sucrose Esters Revenue (USD Million) By Country (2021-2032)
Figure 14. India Sucrose Esters Revenue (USD Million) By Country (2021-2032)
Figure 15. South Korea Sucrose Esters Revenue (USD Million) By Country (2021-2032)
Figure 16. Australia Sucrose Esters Revenue (USD Million) By Country (2021-2032)
Figure 17. South East Asia Sucrose Esters Revenue (USD Million) By Country (2021-2032)
Figure 18. South America Sucrose Esters Revenue (USD Million) By Country (2021-2032)
Figure 19. Brazil Sucrose Esters Revenue (USD Million) By Country (2021-2032)
Figure 20. Argentina Sucrose Esters Revenue (USD Million) By Country (2021-2032)
Figure 21. Rest of Asia Pacific Sucrose Esters Revenue (USD Million) By Country (2021-2032)
Figure 22. Middle East and Africa Sucrose Esters Revenue (USD Million) By Region (2021-2032)
Figure 23. Saudi Arabia Sucrose Esters Revenue (USD Million) By Region (2021-2032)
Figure 24. The UAE Sucrose Esters Revenue (USD Million) By Region (2021-2032)
Figure 25. Rest of Middle East Sucrose Esters Revenue (USD Million) By Region (2021-2032)
Figure 26. South Africa Sucrose Esters Revenue (USD Million) By Region (2021-2032)
Figure 27. Africa Sucrose Esters Revenue (USD Million) By Region (2021-2032)
Figure 28. North America Sucrose Esters Revenue (USD Million) By Type (2021-2032)
Figure 29. North America Sucrose Esters Revenue (USD Million) By Application (2021-2032)
Figure 30. North America Sucrose Esters Revenue (USD Million) By Product (2021-2032)
Figure 31. Europe Sucrose Esters Revenue (USD Million) By Type (2021-2032)
Figure 32. Europe Sucrose Esters Revenue (USD Million) By Application (2021-2032)
Figure 33. Europe Sucrose Esters Revenue (USD Million) By Product (2021-2032)
Figure 34. Asia Pacific Sucrose Esters Revenue (USD Million) By Type (2021-2032)
Figure 35. Asia Pacific Sucrose Esters Revenue (USD Million) By Application (2021-2032)
Figure 36. Asia Pacific Sucrose Esters Revenue (USD Million) By Product (2021-2032)
Figure 37. South America Sucrose Esters Revenue (USD Million) By Type (2021-2032)
Figure 38. South America Sucrose Esters Revenue (USD Million) By Application (2021-2032)
Figure 39. South America Sucrose Esters Revenue (USD Million) By Product (2021-2032)
Figure 40. Middle East and Africa Sucrose Esters Revenue (USD Million) By Type (2021-2032)
Figure 41. Middle East and Africa Sucrose Esters Revenue (USD Million) By Application (2021-2032)
Figure 42. Middle East and Africa Sucrose Esters Revenue (USD Million) By Product (2021-2032)
By Form
Powder
Liquid
Pellet
By Function
Protein & Starch Interaction
Antimicrobial Property
Controlled Sugar Crystallization
Emulsification
Aeration
By Application
Food
-Dairy Products
-Confectioneries
-Bakery Products
-Beverages
-Soups & Sauces
-Meat Products
-Cereals
-Others
Personal Care Products
Detergents & Cleansers
Others
Countries Analyzed
North America (US, Canada, Mexico)
Europe (Germany, UK, France, Spain, Italy, Russia, Rest of Europe)
Asia Pacific (China, India, Japan, South Korea, Australia, South East Asia, Rest of Asia)
South America (Brazil, Argentina, Rest of South America)
Middle East and Africa (Saudi Arabia, UAE, Rest of Middle East, South Africa, Egypt, Rest of Africa)
