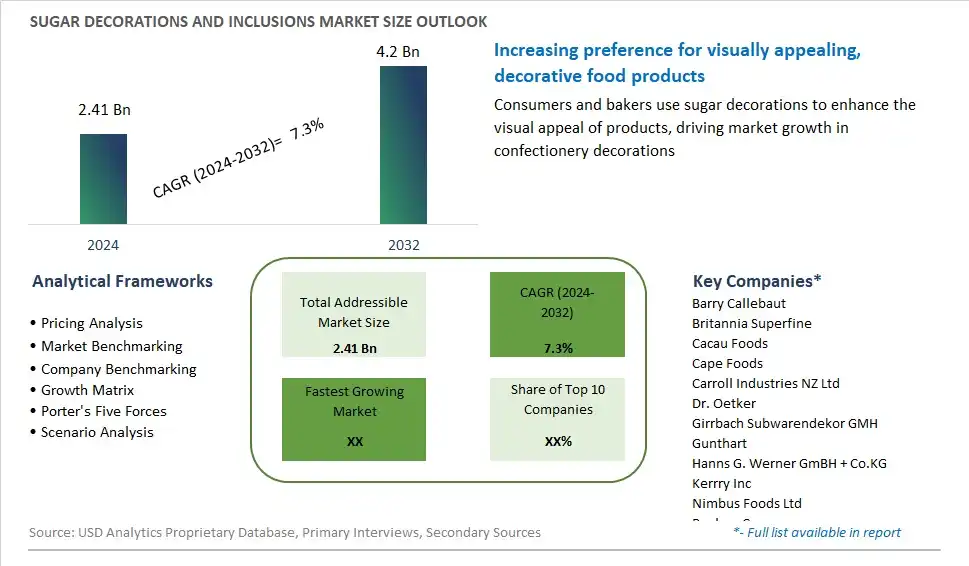
Global Sugar Decorations and Inclusions Market Size is valued at $2.41 Billion in 2024 and is forecast to register a growth rate (CAGR) of 7.3% to reach $4.2 Billion by 2032.
The global Sugar Decorations and Inclusions Market Comprehensive Study analyzes and forecasts the market size across 6 regions and 24 countries for diverse segments -By Type (Jimmies, Quins, Dragee, Nonpareils, Caramel Inclusions, Sanding & Course Sugar, Single Pieces), By Application (Cereals & Snack Bars, Ice-Creams & Frozen Desserts, Chocolates & Confectionery Products, Cakes & Pastries, Others), By Colorant (Artificial, Natural), By End-User (Food Manufacturers, Foodservice, Home Bakers)
An Introduction to Sugar Decorations and Inclusions Market
Sugar decorations and inclusions are decorative elements made from sugar or sugar-based ingredients used to enhance the visual appeal and texture of baked goods, desserts, and confectionery products in 2024. These decorations come in various shapes, colors, and sizes and are commonly used to adorn cakes, cupcakes, pastries, and chocolates, adding aesthetic value and indulgence to the finished product. Sugar decorations may include sugar flowers, pearls, shapes, or intricate designs, while sugar inclusions may consist of sprinkles, confetti, or crunchy toppings. With the growing demand for premium and artisanal baked goods, the market for sugar decorations and inclusions is expanding, driven by innovations in design, formulation, and application techniques that enable manufacturers to create visually stunning and Instagram-worthy treats to delight consumers and cater to special occasions, celebrations, and festive seasons.
Sugar Decorations and Inclusions Competitive Landscape
The market report analyses the leading companies in the industry including Barry Callebaut, Britannia Superfine, Cacau Foods, Cape Foods, Carroll Industries NZ Ltd, Dr. Oetker, Girrbach Subwarendekor GMH, Gunthart, Hanns G. Werner GmBH + Co.KG, Kerrry Inc, Nimbus Foods Ltd, Paulaur Corp, Pecan Deluxe Candy Company, Shantou Hehe Technology Co Ltd, Signature Brands LLC, The American Sprinkle Company, The Baker’s Kitchen, The Kraft Heinz Company, Twinkle sprinkles, Xiamen Yasin Industry & Trade Co Ltd, and Others.
Sugar Decorations and Inclusions Market Dynamics
Sugar Decorations and Inclusions Market Trend: Growing Demand for Artisanal and Customized Food Products
A prominent market trend for sugar decorations and inclusions is the growing demand for artisanal and customized food products. Consumers are increasingly seeking unique and visually appealing food items, including baked goods, desserts, and confectionery, driving the demand for decorative elements such as sugar decorations and inclusions. Artisanal bakers, pastry chefs, and food manufacturers are responding to this trend by offering customized and intricately designed products that stand out in the market. As consumers look for personalized experiences and Instagram-worthy creations, the use of sugar decorations and inclusions provides an opportunity for creativity and differentiation in the food industry.
Market Driver: Rise in Bakery and Confectionery Consumption
A significant market driver for sugar decorations and inclusions is the rise in bakery and confectionery consumption globally. With the growing popularity of baked goods, cakes, pastries, and chocolates, there is an increasing demand for visually appealing and indulgent products. Sugar decorations and inclusions play a vital role in enhancing the aesthetics and sensory experience of these products, enticing consumers with their vibrant colors, intricate designs, and textural contrasts. As consumers seek out premium and gourmet treats, bakeries, confectioneries, and food manufacturers are incorporating sugar decorations and inclusions to elevate their product offerings and meet evolving consumer preferences.
Market Opportunity: Expansion into Healthier and Functional Ingredients
An opportunity within the sugar decorations and inclusions market lies in the expansion into healthier and functional ingredients. While traditional sugar decorations and inclusions primarily focus on aesthetic appeal and indulgence, there is a growing demand for healthier alternatives and functional ingredients in the food industry. By incorporating natural sweeteners, such as stevia or monk fruit extract, and functional ingredients like nuts, seeds, or dried fruits, manufacturers can cater to health-conscious consumers while still providing visually appealing and flavorful products. Additionally, the incorporation of functional ingredients offers the opportunity to capitalize on emerging health trends, such as clean label, gluten-free, or plant-based diets, expanding the market reach and addressing a broader consumer base. By innovating with healthier and functional ingredients, suppliers of sugar decorations and inclusions can position themselves at the forefront of consumer trends and tap into new market opportunities.
Sugar Decorations and Inclusions Market Share Analysis: Jimmies held the dominant market share in 2024
Among the various types in the Sugar Decorations and Inclusions Market, Jimmies emerge as the largest segment, owing to their widespread popularity, versatility, and diverse applications in the baking and confectionery industry. Jimmies, also known as sprinkles, are small, rod-shaped sugar decorations available in a multitude of colors, shapes, and flavors. They are commonly used to add visual appeal, texture, and sweetness to a wide range of baked goods, including cakes, cupcakes, cookies, donuts, and ice cream treats. The vibrant and festive appearance of jimmies makes them a favorite choice for decorating special occasion desserts and seasonal treats. Additionally, the ease of application and storage stability of jimmies further contribute to their dominance in the market. With the growing trend of home baking, artisanal confectionery, and creative dessert presentations, the Jimmies segment continues to expand, presenting lucrative opportunities for manufacturers to innovate and diversify their product offerings to meet evolving consumer demands within the Sugar Decorations and Inclusions Market.
Sugar Decorations and Inclusions Market Share Analysis: Ice-Creams & Frozen Desserts market is poised to register the fastest growth rae over the forecast period to 2032
Among the applications in the Sugar Decorations and Inclusions Market, the Ice-Creams & Frozen Desserts segment is the fastest-growing category, driven by the increasing consumer demand for indulgent and visually appealing frozen treats. Sugar decorations and inclusions play a pivotal role in enhancing the sensory experience and aesthetic appeal of ice creams, frozen yogurts, and other frozen desserts. From colorful sprinkles and crunchy toppings to decadent chocolate pieces and caramel swirls, these embellishments add texture, flavor, and excitement to frozen treats, enticing consumers and encouraging repeat purchases. Additionally, the growing trend of premiumization in the frozen dessert industry, coupled with the rising popularity of artisanal and gourmet ice creams, further fuels the demand for innovative and eye-catching sugar decorations and inclusions. With consumers seeking unique and Instagram-worthy dessert experiences, the Ice-Creams & Frozen Desserts segment presents significant growth opportunities for manufacturers to innovate and differentiate their product offerings within the Sugar Decorations and Inclusions Market.
Sugar Decorations and Inclusions Market Share Analysis: Artificial Colorant held the dominant market share in 2024
Within the Sugar Decorations and Inclusions Market, the Artificial Colorant segment is the largest category, primarily due to its long-standing presence, affordability, and versatility in achieving vibrant and consistent colors in sugar decorations and inclusions. Artificial colorants offer a wide spectrum of hues that can be customized to suit various product applications and consumer preferences. These colorants are widely used in the confectionery, bakery, and dessert industries to create visually appealing treats, including candies, cakes, cookies, and ice creams. Further, artificial colorants provide stability and resistance to fading during storage and exposure to light, ensuring the longevity of the decorative elements. While there is a growing trend towards natural ingredients and clean label products, artificial colorants continue to dominate the market due to their reliability, cost-effectiveness, and ability to meet stringent regulatory requirements. With increasing consumer demand for visually enticing food products and the ease of use associated with artificial colorants, the Artificial Colorant segment maintains its market leadership within the Sugar Decorations and Inclusions Market.
Sugar Decorations and Inclusions Market Segmentation
By Type
Jimmies
Quins
Dragee
Nonpareils
Caramel Inclusions
Sanding & Course Sugar
Single Pieces
By Application
Cereals & Snack Bars
Ice-Creams & Frozen Desserts
Chocolates & Confectionery Products
Cakes & Pastries
Others
By Colorant
Artificial
Natural
By End-User
Food Manufacturers
-Cakes & Pastries
-Ice-Cream
-Chocolates & Confectionery Products
-Cereals & Snack Bars
Foodservice
-Hotel
Restaurants
Cafes
-Ice-Cream Parlors
-Cakes & Pastry Shops
Home Bakers
Countries Analyzed
North America (US, Canada, Mexico)
Europe (Germany, UK, France, Spain, Italy, Russia, Rest of Europe)
Asia Pacific (China, India, Japan, South Korea, Australia, South East Asia, Rest of Asia)
South America (Brazil, Argentina, Rest of South America)
Middle East and Africa (Saudi Arabia, UAE, Rest of Middle East, South Africa, Egypt, Rest of Africa)
Sugar Decorations and Inclusions Companies Profiled in the Study
Barry Callebaut
Britannia Superfine
Cacau Foods
Cape Foods
Carroll Industries NZ Ltd
Dr. Oetker
Girrbach Subwarendekor GMH
Gunthart
Hanns G. Werner GmBH + Co.KG
Kerrry Inc
Nimbus Foods Ltd
Paulaur Corp
Pecan Deluxe Candy Company
Shantou Hehe Technology Co Ltd
Signature Brands LLC
The American Sprinkle Company
The Baker’s Kitchen
The Kraft Heinz Company
Twinkle sprinkles
Xiamen Yasin Industry & Trade Co Ltd
*- List Not Exhaustive
Chapter 1. TABLE OF CONTENTS
Chapter 2. Introduction to Sugar Decorations and Inclusions Market
2.1. Market Overview
2.2. Key Statistics and Report Highlights
2.3. Scope of the Comprehensive Study
2.3.1. Market Definition
2.3.2 Countries and Regions Covered
2.3.3 Research Objective
2.3.4 Units, Currency, and Conversions
2.3.5 Industry Value Chain
2.4. Key Market Segments
2.5. Key Companies
2.6. Study Period
Chapter 3. Strategic Analysis Review
3.1. Sugar Decorations and Inclusions Pricing Analysis and Forecast
3.2. Porter’s Five Forces
3.3. Market Ecosystem
3.4. SWOT Analysis
3.5. Regulatory Scenario
3.3. Effects of Inflation, Russia-Ukraine War, moderating economic growth, and other macroeconomic factors
Chapter 4. Competitive Landscape
4.1. Market Share Analysis
4.1.1. Global Sugar Decorations and Inclusions Market Share by Company, 2023
4.1.2. Product Offerings of Leading Sugar Decorations and Inclusions Companies
4.2. Market Entropy
4.2.1. New Product Launches in the Industry
4.2.2. Mergers, Acquisitions, Joint ventures, and Partnerships
4.3. Key Strategies and Best Practices
Chapter 5. Global Market Projections: Best, Reference, and Low Case Scenarios
5.1. Growth Analysis- Case Scenario Definitions
5.2. Low Growth Case Scenario Forecasts
5.3. Reference Growth Case Scenario Forecasts
5.4. High Growth Case Scenario Forecasts
Chapter 6. Market Dynamics
6.1. Sugar Decorations and Inclusions Market Drivers
6.2. Sugar Decorations and Inclusions Market Challenges
6.6. Sugar Decorations and Inclusions Market Opportunities
6.4. Sugar Decorations and Inclusions Market Trends
Chapter 7. Global Sugar Decorations and Inclusions Market Outlook Trends
7.1. Global Sugar Decorations and Inclusions Revenue (USD Million) and CAGR (%) by Type (2021-2032)
7.2. Global Sugar Decorations and Inclusions Revenue (USD Million) and CAGR (%) by Application (2021-2032)
7.3. Global Sugar Decorations and Inclusions Revenue (USD Million) and CAGR (%) by Product (2021-2032)
By Type
Jimmies
Quins
Dragee
Nonpareils
Caramel Inclusions
Sanding & Course Sugar
Single Pieces
By Application
Cereals & Snack Bars
Ice-Creams & Frozen Desserts
Chocolates & Confectionery Products
Cakes & Pastries
Others
By Colorant
Artificial
Natural
By End-User
Food Manufacturers
-Cakes & Pastries
-Ice-Cream
-Chocolates & Confectionery Products
-Cereals & Snack Bars
Foodservice
-Hotel
Restaurants
Cafes
-Ice-Cream Parlors
-Cakes & Pastry Shops
Home Bakers
Chapter 8. Global Sugar Decorations and Inclusions Regional Analysis and Outlook
8.1. Global Sugar Decorations and Inclusions Revenue (USD Million) By Regions (2021- 2032)
8.2. North America Sugar Decorations and Inclusions Revenue (USD Million) by Country (2021-2032)
8.2.1. United States Sugar Decorations and Inclusions Regional Analysis and Outlook
8.2.2. Canada Sugar Decorations and Inclusions Regional Analysis and Outlook
8.2.3. Mexico Sugar Decorations and Inclusions Regional Analysis and Outlook
8.3. Europe Sugar Decorations and Inclusions Revenue (USD Million), by Country (2021-2032)
8.3.1. Germany Sugar Decorations and Inclusions Regional Analysis and Outlook
8.3.2. France Sugar Decorations and Inclusions Regional Analysis and Outlook
8.3.3. United Kingdom Sugar Decorations and Inclusions Regional Analysis and Outlook
8.3.4. Spain Sugar Decorations and Inclusions Regional Analysis and Outlook
8.3.5. Italy Sugar Decorations and Inclusions Regional Analysis and Outlook
8.3.6. Russia Sugar Decorations and Inclusions Regional Analysis and Outlook
8.3.7. Rest of Europe Sugar Decorations and Inclusions Regional Analysis and Outlook
8.4. Asia Pacific Sugar Decorations and Inclusions Revenue (USD Million) by Country (2021-2032)
8.4.1. China Sugar Decorations and Inclusions Regional Analysis and Outlook
8.4.2. Japan Sugar Decorations and Inclusions Regional Analysis and Outlook
8.4.3. India Sugar Decorations and Inclusions Regional Analysis and Outlook
8.4.4. South Korea Sugar Decorations and Inclusions Regional Analysis and Outlook
8.4.5. Australia Sugar Decorations and Inclusions Regional Analysis and Outlook
8.4.6. South East Asia Sugar Decorations and Inclusions Regional Analysis and Outlook
8.4.7. Rest of Asia Pacific Sugar Decorations and Inclusions Regional Analysis and Outlook
8.5. South America Sugar Decorations and Inclusions Revenue (USD Million), by Country (2021-2032)
8.5.1. Brazil Sugar Decorations and Inclusions Regional Analysis and Outlook
8.5.2. Argentina Sugar Decorations and Inclusions Regional Analysis and Outlook
8.5.3. Rest of South America Sugar Decorations and Inclusions Regional Analysis and Outlook
8.6. Middle East and Africa Sugar Decorations and Inclusions Revenue (USD Million) by Country (2021-2032)
8.6.1. Middle East Sugar Decorations and Inclusions Regional Analysis and Outlook
8.6.2. Africa Sugar Decorations and Inclusions Regional Analysis and Outlook
Chapter 9. North America Sugar Decorations and Inclusions Analysis and Outlook
9.1. North America Sugar Decorations and Inclusions Revenue (USD Million) by Segments (2021-2032)
9.1.1. North America Sugar Decorations and Inclusions Revenue (USD Million) by Type (2021-2032)
9.1.2. North America Sugar Decorations and Inclusions Revenue (USD Million) by Application (2021-2032)
9.1.3. North America Sugar Decorations and Inclusions Revenue (USD Million) by Product (2021-2032)
By Type
Jimmies
Quins
Dragee
Nonpareils
Caramel Inclusions
Sanding & Course Sugar
Single Pieces
By Application
Cereals & Snack Bars
Ice-Creams & Frozen Desserts
Chocolates & Confectionery Products
Cakes & Pastries
Others
By Colorant
Artificial
Natural
By End-User
Food Manufacturers
-Cakes & Pastries
-Ice-Cream
-Chocolates & Confectionery Products
-Cereals & Snack Bars
Foodservice
-Hotel
Restaurants
Cafes
-Ice-Cream Parlors
-Cakes & Pastry Shops
Home Bakers
Chapter 10. Europe Sugar Decorations and Inclusions Analysis and Outlook
10.1. Europe Sugar Decorations and Inclusions Revenue (USD Million), by Segments (USD Million) (2021-2032)
10.1.1. Europe Sugar Decorations and Inclusions Revenue (USD Million) by Type (2021-2032)
10.1.2. Europe Sugar Decorations and Inclusions Revenue (USD Million) by Application (2021-2032)
10.1.3. Europe Sugar Decorations and Inclusions Revenue (USD Million) by Product (2021-2032)
By Type
Jimmies
Quins
Dragee
Nonpareils
Caramel Inclusions
Sanding & Course Sugar
Single Pieces
By Application
Cereals & Snack Bars
Ice-Creams & Frozen Desserts
Chocolates & Confectionery Products
Cakes & Pastries
Others
By Colorant
Artificial
Natural
By End-User
Food Manufacturers
-Cakes & Pastries
-Ice-Cream
-Chocolates & Confectionery Products
-Cereals & Snack Bars
Foodservice
-Hotel
Restaurants
Cafes
-Ice-Cream Parlors
-Cakes & Pastry Shops
Home Bakers
Chapter 11. Asia Pacific Sugar Decorations and Inclusions Analysis and Outlook
11.1. Asia Pacific Sugar Decorations and Inclusions Revenue (USD Million), and Revenue (USD Million) by Segments (2021-2032)
11.1.1. Asia Pacific Sugar Decorations and Inclusions Revenue (USD Million) by Type (2021-2032)
11.1.2. Asia Pacific Sugar Decorations and Inclusions Revenue (USD Million) by Application (2021-2032)
11.1.3. Asia Pacific Sugar Decorations and Inclusions Revenue (USD Million) by Product (2021-2032)
By Type
Jimmies
Quins
Dragee
Nonpareils
Caramel Inclusions
Sanding & Course Sugar
Single Pieces
By Application
Cereals & Snack Bars
Ice-Creams & Frozen Desserts
Chocolates & Confectionery Products
Cakes & Pastries
Others
By Colorant
Artificial
Natural
By End-User
Food Manufacturers
-Cakes & Pastries
-Ice-Cream
-Chocolates & Confectionery Products
-Cereals & Snack Bars
Foodservice
-Hotel
Restaurants
Cafes
-Ice-Cream Parlors
-Cakes & Pastry Shops
Home Bakers
Chapter 12. South America Sugar Decorations and Inclusions Analysis and Outlook
12.1. South America Sugar Decorations and Inclusions Revenue (USD Million), by Segments (2021-2032)
12.1.1. South America Sugar Decorations and Inclusions Revenue (USD Million) by Type (2021-2032)
12.1.2. South America Sugar Decorations and Inclusions Revenue (USD Million) by Application (2021-2032)
12.1.3. South America Sugar Decorations and Inclusions Revenue (USD Million) by Product (2021-2032)
By Type
Jimmies
Quins
Dragee
Nonpareils
Caramel Inclusions
Sanding & Course Sugar
Single Pieces
By Application
Cereals & Snack Bars
Ice-Creams & Frozen Desserts
Chocolates & Confectionery Products
Cakes & Pastries
Others
By Colorant
Artificial
Natural
By End-User
Food Manufacturers
-Cakes & Pastries
-Ice-Cream
-Chocolates & Confectionery Products
-Cereals & Snack Bars
Foodservice
-Hotel
Restaurants
Cafes
-Ice-Cream Parlors
-Cakes & Pastry Shops
Home Bakers
Chapter 13. Middle East and Africa Sugar Decorations and Inclusions Analysis and Outlook
13.1. Middle East and Africa Sugar Decorations and Inclusions Revenue (USD Million), by Segments (2021-2032)
13.1.1. Middle East and Africa Sugar Decorations and Inclusions Revenue (USD Million) by Type (2021-2032)
13.1.2. Middle East and Africa Sugar Decorations and Inclusions Revenue (USD Million) by Application (2021-2032)
13.1.3. Middle East and Africa Sugar Decorations and Inclusions Revenue (USD Million) by Product (2021-2032)
By Type
Jimmies
Quins
Dragee
Nonpareils
Caramel Inclusions
Sanding & Course Sugar
Single Pieces
By Application
Cereals & Snack Bars
Ice-Creams & Frozen Desserts
Chocolates & Confectionery Products
Cakes & Pastries
Others
By Colorant
Artificial
Natural
By End-User
Food Manufacturers
-Cakes & Pastries
-Ice-Cream
-Chocolates & Confectionery Products
-Cereals & Snack Bars
Foodservice
-Hotel
Restaurants
Cafes
-Ice-Cream Parlors
-Cakes & Pastry Shops
Home Bakers
Chapter 14. Sugar Decorations and Inclusions Company Profiles
14.1 Business Overview
14.2 Product Profiles
14.3 SWOT Profiles
14.5 Recent Developments
14.6 Financial Profile
List of Companies
Barry Callebaut
Britannia Superfine
Cacau Foods
Cape Foods
Carroll Industries NZ Ltd
Dr. Oetker
Girrbach Subwarendekor GMH
Gunthart
Hanns G. Werner GmBH + Co.KG
Kerrry Inc
Nimbus Foods Ltd
Paulaur Corp
Pecan Deluxe Candy Company
Shantou Hehe Technology Co Ltd
Signature Brands LLC
The American Sprinkle Company
The Baker’s Kitchen
The Kraft Heinz Company
Twinkle sprinkles
Xiamen Yasin Industry & Trade Co Ltd
15. Methodology and Data Sources
15.1 Customization Offerings
15.2 Subscription Services
15.3 Related Reports
15.4 Publisher Expertise
LIST OF TABLES
Table 1 Market Segmentation Analysis
Table 2 Global Sugar Decorations and Inclusions Market Share of Leading Companies, 2023
Table 3 Product Offerings of Leading Companies
Table 4 Low Growth Scenario Forecasts
Table 5 Reference Case Growth Scenario
Table 6 High Growth Case Scenario
Table 7 Global Sugar Decorations and Inclusions Revenue (USD Million) And CAGR (%) By Type (2021-2032)
Table 8 Global Sugar Decorations and Inclusions Revenue (USD Million) And CAGR (%) By Application (2021-2032)
Table 9 Global Sugar Decorations and Inclusions Revenue (USD Million) And CAGR (%) By Product (2021-2032)
Table 10 Global Sugar Decorations and Inclusions Market Revenue (USD Million) By Regions (2021-2032)
Table 11 Global Sugar Decorations and Inclusions Market Share (%) By Regions (2021-2032)
Table 12 North America Sugar Decorations and Inclusions Revenue (USD Million) By Country (2021-2032)
Table 13 Europe Sugar Decorations and Inclusions Revenue (USD Million) By Country (2021-2032)
Table 14 Asia Pacific Sugar Decorations and Inclusions Revenue (USD Million) By Country (2021-2032)
Table 15 South America Sugar Decorations and Inclusions Revenue (USD Million) By Country (2021-2032)
Table 16 Middle East and Africa Sugar Decorations and Inclusions Revenue (USD Million) By Region (2021-2032)
Table 17 North America Sugar Decorations and Inclusions Revenue (USD Million) By Type (2021-2032)
Table 18 North America Sugar Decorations and Inclusions Revenue (USD Million) By Application (2021-2032)
Table 19 North America Sugar Decorations and Inclusions Revenue (USD Million) By Product (2021-2032)
Table 20 Europe Sugar Decorations and Inclusions Revenue (USD Million) By Type (2021-2032)
Table 21 Europe Sugar Decorations and Inclusions Revenue (USD Million) By Application (2021-2032)
Table 22 Europe Sugar Decorations and Inclusions Revenue (USD Million) By Product (2021-2032)
Table 23 Asia Pacific Sugar Decorations and Inclusions Revenue (USD Million) By Type (2021-2032)
Table 24 Asia Pacific Sugar Decorations and Inclusions Revenue (USD Million) By Application (2021-2032)
Table 25 Asia Pacific Sugar Decorations and Inclusions Revenue (USD Million) By Product (2021-2032)
Table 26 South America Sugar Decorations and Inclusions Revenue (USD Million) By Type (2021-2032)
Table 27 South America Sugar Decorations and Inclusions Revenue (USD Million) By Application (2021-2032)
Table 28 South America Sugar Decorations and Inclusions Revenue (USD Million) By Product (2021-2032)
Table 29 Middle East and Africa Sugar Decorations and Inclusions Revenue (USD Million) By Type (2021-2032)
Table 30 Middle East and Africa Sugar Decorations and Inclusions Revenue (USD Million) By Application (2021-2032)
Table 31 Middle East and Africa Sugar Decorations and Inclusions Revenue (USD Million) By Product (2021-2032)
LIST OF FIGURES
Figure 1. Market Scope
Figure 2. Pricing Forecasts Per Unit, 2023- 2032
Figure 3. Porter’s Five Forces
Figure 4. Global Sugar Decorations and Inclusions Market Revenue (USD Million) By Regions (2021-2032)
Figure 5. Global Sugar Decorations and Inclusions Market Share (%) By Regions (2023)
Figure 6. North America Sugar Decorations and Inclusions Revenue (USD Million) By Country (2021-2032)
Figure 7. United States Sugar Decorations and Inclusions Revenue (USD Million) By Country (2021-2032)
Figure 8. Canada Sugar Decorations and Inclusions Revenue (USD Million) By Country (2021-2032)
Figure 9. Mexico Sugar Decorations and Inclusions Revenue (USD Million) By Country (2021-2032)
Figure 10. Europe Sugar Decorations and Inclusions Revenue (USD Million) By Country (2021-2032)
Figure 11. Germany Sugar Decorations and Inclusions Revenue (USD Million) By Country (2021-2032)
Figure 12. France Sugar Decorations and Inclusions Revenue (USD Million) By Country (2021-2032)
Figure 13. United Kingdom Sugar Decorations and Inclusions Revenue (USD Million) By Country (2021-2032)
Figure 14. Spain Sugar Decorations and Inclusions Revenue (USD Million) By Country (2021-2032)
Figure 15. Italy Sugar Decorations and Inclusions Revenue (USD Million) By Country (2021-2032)
Figure 16. Russia Sugar Decorations and Inclusions Revenue (USD Million) By Country (2021-2032)
Figure 17. Rest of Europe Sugar Decorations and Inclusions Revenue (USD Million) By Country (2021-2032)
Figure 11. Asia Pacific Sugar Decorations and Inclusions Revenue (USD Million) By Country (2021-2032)
Figure 12. China Sugar Decorations and Inclusions Revenue (USD Million) By Country (2021-2032)
Figure 13. Japan Sugar Decorations and Inclusions Revenue (USD Million) By Country (2021-2032)
Figure 14. India Sugar Decorations and Inclusions Revenue (USD Million) By Country (2021-2032)
Figure 15. South Korea Sugar Decorations and Inclusions Revenue (USD Million) By Country (2021-2032)
Figure 16. Australia Sugar Decorations and Inclusions Revenue (USD Million) By Country (2021-2032)
Figure 17. South East Asia Sugar Decorations and Inclusions Revenue (USD Million) By Country (2021-2032)
Figure 18. South America Sugar Decorations and Inclusions Revenue (USD Million) By Country (2021-2032)
Figure 19. Brazil Sugar Decorations and Inclusions Revenue (USD Million) By Country (2021-2032)
Figure 20. Argentina Sugar Decorations and Inclusions Revenue (USD Million) By Country (2021-2032)
Figure 21. Rest of Asia Pacific Sugar Decorations and Inclusions Revenue (USD Million) By Country (2021-2032)
Figure 22. Middle East and Africa Sugar Decorations and Inclusions Revenue (USD Million) By Region (2021-2032)
Figure 23. Saudi Arabia Sugar Decorations and Inclusions Revenue (USD Million) By Region (2021-2032)
Figure 24. The UAE Sugar Decorations and Inclusions Revenue (USD Million) By Region (2021-2032)
Figure 25. Rest of Middle East Sugar Decorations and Inclusions Revenue (USD Million) By Region (2021-2032)
Figure 26. South Africa Sugar Decorations and Inclusions Revenue (USD Million) By Region (2021-2032)
Figure 27. Africa Sugar Decorations and Inclusions Revenue (USD Million) By Region (2021-2032)
Figure 28. North America Sugar Decorations and Inclusions Revenue (USD Million) By Type (2021-2032)
Figure 29. North America Sugar Decorations and Inclusions Revenue (USD Million) By Application (2021-2032)
Figure 30. North America Sugar Decorations and Inclusions Revenue (USD Million) By Product (2021-2032)
Figure 31. Europe Sugar Decorations and Inclusions Revenue (USD Million) By Type (2021-2032)
Figure 32. Europe Sugar Decorations and Inclusions Revenue (USD Million) By Application (2021-2032)
Figure 33. Europe Sugar Decorations and Inclusions Revenue (USD Million) By Product (2021-2032)
Figure 34. Asia Pacific Sugar Decorations and Inclusions Revenue (USD Million) By Type (2021-2032)
Figure 35. Asia Pacific Sugar Decorations and Inclusions Revenue (USD Million) By Application (2021-2032)
Figure 36. Asia Pacific Sugar Decorations and Inclusions Revenue (USD Million) By Product (2021-2032)
Figure 37. South America Sugar Decorations and Inclusions Revenue (USD Million) By Type (2021-2032)
Figure 38. South America Sugar Decorations and Inclusions Revenue (USD Million) By Application (2021-2032)
Figure 39. South America Sugar Decorations and Inclusions Revenue (USD Million) By Product (2021-2032)
Figure 40. Middle East and Africa Sugar Decorations and Inclusions Revenue (USD Million) By Type (2021-2032)
Figure 41. Middle East and Africa Sugar Decorations and Inclusions Revenue (USD Million) By Application (2021-2032)
Figure 42. Middle East and Africa Sugar Decorations and Inclusions Revenue (USD Million) By Product (2021-2032)
By Type
Jimmies
Quins
Dragee
Nonpareils
Caramel Inclusions
Sanding & Course Sugar
Single Pieces
By Application
Cereals & Snack Bars
Ice-Creams & Frozen Desserts
Chocolates & Confectionery Products
Cakes & Pastries
Others
By Colorant
Artificial
Natural
By End-User
Food Manufacturers
-Cakes & Pastries
-Ice-Cream
-Chocolates & Confectionery Products
-Cereals & Snack Bars
Foodservice
-Hotel
Restaurants
Cafes
-Ice-Cream Parlors
-Cakes & Pastry Shops
Home Bakers
Countries Analyzed
North America (US, Canada, Mexico)
Europe (Germany, UK, France, Spain, Italy, Russia, Rest of Europe)
Asia Pacific (China, India, Japan, South Korea, Australia, South East Asia, Rest of Asia)
South America (Brazil, Argentina, Rest of South America)
Middle East and Africa (Saudi Arabia, UAE, Rest of Middle East, South Africa, Egypt, Rest of Africa)
