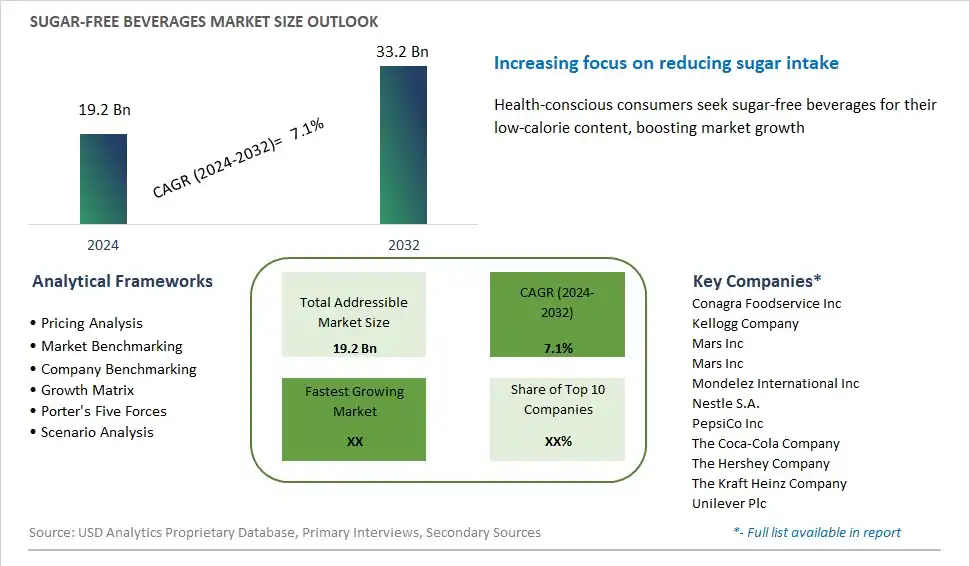
Global Sugar-Free Beverages Market Size is valued at $19.2 Billion in 2024 and is forecast to register a growth rate (CAGR) of 7.1% to reach $33.2 Billion by 2032.
The global Sugar-Free Beverages Market Comprehensive Study analyzes and forecasts the market size across 6 regions and 24 countries for diverse segments -By Product (Energy Drinks, Soft Drinks, Fruits & Vegetable Juices, Dairy Beverages, Others), By Distribution Channel (Supermarkets, Convenience Stores, Online Sales, Others)
An Introduction to Sugar-Free Beverages Market
The Sugar-Free Beverages Market focuses on the production and sale of beverages formulated without added sugars. These include soft drinks, juices, teas, and energy drinks sweetened with alternative sweeteners like stevia, aspartame, and sucralose. The market is driven by rising health consciousness, increasing prevalence of diabetes and obesity, and growing consumer preference for low-calorie and low-sugar beverages. Additionally, innovations in sweetener technologies and expanding product portfolios support market growth.
Sugar Free Beverages Competitive Landscape
The market report analyses the leading companies in the industry including Conagra Foodservice Inc, Kellogg Company, Mars Inc, Mars Inc, Mondelez International Inc, Nestle S.A., PepsiCo Inc, The Coca-Cola Company, The Hershey Company, The Kraft Heinz Company, Unilever Plc, and Others.
Sugar Free Beverages Market Dynamics
Market Trend: Growing Popularity of Sugar-Free Diets
The most prominent trend in the Sugar-Free Beverages Market is the growing popularity of sugar-free diets. As consumers become more health-conscious and aware of the negative effects of excessive sugar consumption, there is an increasing demand for beverages that do not contain added sugars. This trend is driven by the rising incidence of diabetes, obesity, and other health conditions related to sugar intake. Sugar-free beverages, which offer the same taste and refreshment without the sugar, are gaining popularity among health-conscious consumers
Market Driver: Advancements in Sweetening Technologies
Advancements in sweetening technologies are major drivers of the Sugar-Free Beverages Market. The development of natural and artificial sweeteners that mimic the taste of sugar without the calories or health risks has enabled manufacturers to create a wide range of sugar-free beverages. Innovations in sweetening agents, such as stevia, erythritol, and monk fruit extract, are providing consumers with healthier alternatives that do not compromise on taste. These advancements are driving market growth by making sugar-free products more appealing and accessible
Market Opportunity: Expansion into Functional Beverages
A significant opportunity in the Sugar-Free Beverages Market lies in the expansion into functional beverages. As consumers seek beverages that offer additional health benefits, there is potential for companies to develop sugar-free drinks with added functional ingredients, such as vitamins, minerals, and probiotics. By creating beverages that not only provide hydration and refreshment but also support specific health goals, companies can attract health-conscious consumers and differentiate their products in a competitive market
Sugar-Free Beverages Market Share Analysis: Product (Energy Drinks, Soft Drinks, Fruits & Vegetable Juices, Dairy Beverages, Others)
The energy drinks segment is anticipated to be the fastest-growing in the Sugar-Free Beverages Market by product to 2032. The demand for sugar-free energy drinks is driven by the increasing awareness of the health risks associated with excessive sugar consumption and the growing preference for low-calorie, functional beverages. Sugar-free energy drinks offer consumers the benefits of increased energy and improved focus without the added sugars and calories. Additionally, the rising trend of health and wellness and the growing popularity of fitness and sports activities contribute to the segment's rapid growth. The expansion of product offerings and the increasing availability of sugar-free energy drinks in various retail channels support the growth of this segment.
Sugar-Free Beverages Market Share Analysis: Distribution Channel (Supermarkets, Convenience Stores, Online Sales, Others)
The online distribution channel is expected to be the fastest-growing segment in the Sugar-Free Beverages Market by distribution channel to 2032. The convenience and accessibility of online shopping, combined with the growing consumer preference for e-commerce, drive the rapid growth of this segment. Online platforms offer a wide variety of sugar-free beverages, detailed product descriptions, and customer reviews, making it easier for consumers to make informed purchasing decisions. The COVID-19 pandemic has further accelerated the shift towards online shopping, as consumers seek contactless and convenient ways to purchase their favorite beverages. Subscription services and direct-to-consumer models also contribute to the segment's expansion, providing consumers with regular deliveries of their preferred sugar-free beverages.
Sugar Free Beverages Market Segmentation
By Product
Energy Drinks
Soft Drinks
Fruits & Vegetable Juices
Dairy Beverages
Others
By Distribution Channel
Supermarkets
Convenience Stores
Online Sales
Others
Countries Analyzed
North America (US, Canada, Mexico)
Europe (Germany, UK, France, Spain, Italy, Russia, Rest of Europe)
Asia Pacific (China, India, Japan, South Korea, Australia, South East Asia, Rest of Asia)
South America (Brazil, Argentina, Rest of South America)
Middle East and Africa (Saudi Arabia, UAE, Rest of Middle East, South Africa, Egypt, Rest of Africa)
Sugar Free Beverages Companies Profiled in the Study
Conagra Foodservice Inc
Kellogg Company
Mars Inc
Mars Inc
Mondelez International Inc
Nestle S.A.
PepsiCo Inc
The Coca-Cola Company
The Hershey Company
The Kraft Heinz Company
Unilever Plc
*- List Not Exhaustive
Chapter 1. TABLE OF CONTENTS
Chapter 2. Introduction to Sugar Free Beverages Market
2.1. Market Overview
2.2. Key Statistics and Report Highlights
2.3. Scope of the Comprehensive Study
2.3.1. Market Definition
2.3.2 Countries and Regions Covered
2.3.3 Research Objective
2.3.4 Units, Currency, and Conversions
2.3.5 Industry Value Chain
2.4. Key Market Segments
2.5. Key Companies
2.6. Study Period
Chapter 3. Strategic Analysis Review
3.1. Sugar Free Beverages Pricing Analysis and Forecast
3.2. Porter’s Five Forces
3.3. Market Ecosystem
3.4. SWOT Analysis
3.5. Regulatory Scenario
3.3. Effects of Inflation, Russia-Ukraine War, moderating economic growth, and other macroeconomic factors
Chapter 4. Competitive Landscape
4.1. Market Share Analysis
4.1.1. Global Sugar Free Beverages Market Share by Company, 2023
4.1.2. Product Offerings of Leading Sugar Free Beverages Companies
4.2. Market Entropy
4.2.1. New Product Launches in the Industry
4.2.2. Mergers, Acquisitions, Joint ventures, and Partnerships
4.3. Key Strategies and Best Practices
Chapter 5. Global Market Projections: Best, Reference, and Low Case Scenarios
5.1. Growth Analysis- Case Scenario Definitions
5.2. Low Growth Case Scenario Forecasts
5.3. Reference Growth Case Scenario Forecasts
5.4. High Growth Case Scenario Forecasts
Chapter 6. Market Dynamics
6.1. Sugar Free Beverages Market Drivers
6.2. Sugar Free Beverages Market Challenges
6.6. Sugar Free Beverages Market Opportunities
6.4. Sugar Free Beverages Market Trends
Chapter 7. Global Sugar Free Beverages Market Outlook Trends
7.1. Global Sugar Free Beverages Revenue (USD Million) and CAGR (%) by Type (2021-2032)
7.2. Global Sugar Free Beverages Revenue (USD Million) and CAGR (%) by Application (2021-2032)
7.3. Global Sugar Free Beverages Revenue (USD Million) and CAGR (%) by Product (2021-2032)
By Product
Energy Drinks
Soft Drinks
Fruits & Vegetable Juices
Dairy Beverages
Others
By Distribution Channel
Supermarkets
Convenience Stores
Online Sales
Others
Chapter 8. Global Sugar Free Beverages Regional Analysis and Outlook
8.1. Global Sugar Free Beverages Revenue (USD Million) By Regions (2021- 2032)
8.2. North America Sugar Free Beverages Revenue (USD Million) by Country (2021-2032)
8.2.1. United States Sugar Free Beverages Regional Analysis and Outlook
8.2.2. Canada Sugar Free Beverages Regional Analysis and Outlook
8.2.3. Mexico Sugar Free Beverages Regional Analysis and Outlook
8.3. Europe Sugar Free Beverages Revenue (USD Million), by Country (2021-2032)
8.3.1. Germany Sugar Free Beverages Regional Analysis and Outlook
8.3.2. France Sugar Free Beverages Regional Analysis and Outlook
8.3.3. United Kingdom Sugar Free Beverages Regional Analysis and Outlook
8.3.4. Spain Sugar Free Beverages Regional Analysis and Outlook
8.3.5. Italy Sugar Free Beverages Regional Analysis and Outlook
8.3.6. Russia Sugar Free Beverages Regional Analysis and Outlook
8.3.7. Rest of Europe Sugar Free Beverages Regional Analysis and Outlook
8.4. Asia Pacific Sugar Free Beverages Revenue (USD Million) by Country (2021-2032)
8.4.1. China Sugar Free Beverages Regional Analysis and Outlook
8.4.2. Japan Sugar Free Beverages Regional Analysis and Outlook
8.4.3. India Sugar Free Beverages Regional Analysis and Outlook
8.4.4. South Korea Sugar Free Beverages Regional Analysis and Outlook
8.4.5. Australia Sugar Free Beverages Regional Analysis and Outlook
8.4.6. South East Asia Sugar Free Beverages Regional Analysis and Outlook
8.4.7. Rest of Asia Pacific Sugar Free Beverages Regional Analysis and Outlook
8.5. South America Sugar Free Beverages Revenue (USD Million), by Country (2021-2032)
8.5.1. Brazil Sugar Free Beverages Regional Analysis and Outlook
8.5.2. Argentina Sugar Free Beverages Regional Analysis and Outlook
8.5.3. Rest of South America Sugar Free Beverages Regional Analysis and Outlook
8.6. Middle East and Africa Sugar Free Beverages Revenue (USD Million) by Country (2021-2032)
8.6.1. Middle East Sugar Free Beverages Regional Analysis and Outlook
8.6.2. Africa Sugar Free Beverages Regional Analysis and Outlook
Chapter 9. North America Sugar Free Beverages Analysis and Outlook
9.1. North America Sugar Free Beverages Revenue (USD Million) by Segments (2021-2032)
9.1.1. North America Sugar Free Beverages Revenue (USD Million) by Type (2021-2032)
9.1.2. North America Sugar Free Beverages Revenue (USD Million) by Application (2021-2032)
9.1.3. North America Sugar Free Beverages Revenue (USD Million) by Product (2021-2032)
By Product
Energy Drinks
Soft Drinks
Fruits & Vegetable Juices
Dairy Beverages
Others
By Distribution Channel
Supermarkets
Convenience Stores
Online Sales
Others
Chapter 10. Europe Sugar Free Beverages Analysis and Outlook
10.1. Europe Sugar Free Beverages Revenue (USD Million), by Segments (USD Million) (2021-2032)
10.1.1. Europe Sugar Free Beverages Revenue (USD Million) by Type (2021-2032)
10.1.2. Europe Sugar Free Beverages Revenue (USD Million) by Application (2021-2032)
10.1.3. Europe Sugar Free Beverages Revenue (USD Million) by Product (2021-2032)
By Product
Energy Drinks
Soft Drinks
Fruits & Vegetable Juices
Dairy Beverages
Others
By Distribution Channel
Supermarkets
Convenience Stores
Online Sales
Others
Chapter 11. Asia Pacific Sugar Free Beverages Analysis and Outlook
11.1. Asia Pacific Sugar Free Beverages Revenue (USD Million), and Revenue (USD Million) by Segments (2021-2032)
11.1.1. Asia Pacific Sugar Free Beverages Revenue (USD Million) by Type (2021-2032)
11.1.2. Asia Pacific Sugar Free Beverages Revenue (USD Million) by Application (2021-2032)
11.1.3. Asia Pacific Sugar Free Beverages Revenue (USD Million) by Product (2021-2032)
By Product
Energy Drinks
Soft Drinks
Fruits & Vegetable Juices
Dairy Beverages
Others
By Distribution Channel
Supermarkets
Convenience Stores
Online Sales
Others
Chapter 12. South America Sugar Free Beverages Analysis and Outlook
12.1. South America Sugar Free Beverages Revenue (USD Million), by Segments (2021-2032)
12.1.1. South America Sugar Free Beverages Revenue (USD Million) by Type (2021-2032)
12.1.2. South America Sugar Free Beverages Revenue (USD Million) by Application (2021-2032)
12.1.3. South America Sugar Free Beverages Revenue (USD Million) by Product (2021-2032)
By Product
Energy Drinks
Soft Drinks
Fruits & Vegetable Juices
Dairy Beverages
Others
By Distribution Channel
Supermarkets
Convenience Stores
Online Sales
Others
Chapter 13. Middle East and Africa Sugar Free Beverages Analysis and Outlook
13.1. Middle East and Africa Sugar Free Beverages Revenue (USD Million), by Segments (2021-2032)
13.1.1. Middle East and Africa Sugar Free Beverages Revenue (USD Million) by Type (2021-2032)
13.1.2. Middle East and Africa Sugar Free Beverages Revenue (USD Million) by Application (2021-2032)
13.1.3. Middle East and Africa Sugar Free Beverages Revenue (USD Million) by Product (2021-2032)
By Product
Energy Drinks
Soft Drinks
Fruits & Vegetable Juices
Dairy Beverages
Others
By Distribution Channel
Supermarkets
Convenience Stores
Online Sales
Others
Chapter 14. Sugar Free Beverages Company Profiles
14.1 Business Overview
14.2 Product Profiles
14.3 SWOT Profiles
14.5 Recent Developments
14.6 Financial Profile
List of Companies
Conagra Foodservice Inc
Kellogg Company
Mars Inc
Mars Inc
Mondelez International Inc
Nestle S.A.
PepsiCo Inc
The Coca-Cola Company
The Hershey Company
The Kraft Heinz Company
Unilever Plc
15. Methodology and Data Sources
15.1 Customization Offerings
15.2 Subscription Services
15.3 Related Reports
15.4 Publisher Expertise
LIST OF TABLES
Table 1 Market Segmentation Analysis
Table 2 Global Sugar Free Beverages Market Share of Leading Companies, 2023
Table 3 Product Offerings of Leading Companies
Table 4 Low Growth Scenario Forecasts
Table 5 Reference Case Growth Scenario
Table 6 High Growth Case Scenario
Table 7 Global Sugar Free Beverages Revenue (USD Million) And CAGR (%) By Type (2021-2032)
Table 8 Global Sugar Free Beverages Revenue (USD Million) And CAGR (%) By Application (2021-2032)
Table 9 Global Sugar Free Beverages Revenue (USD Million) And CAGR (%) By Product (2021-2032)
Table 10 Global Sugar Free Beverages Market Revenue (USD Million) By Regions (2021-2032)
Table 11 Global Sugar Free Beverages Market Share (%) By Regions (2021-2032)
Table 12 North America Sugar Free Beverages Revenue (USD Million) By Country (2021-2032)
Table 13 Europe Sugar Free Beverages Revenue (USD Million) By Country (2021-2032)
Table 14 Asia Pacific Sugar Free Beverages Revenue (USD Million) By Country (2021-2032)
Table 15 South America Sugar Free Beverages Revenue (USD Million) By Country (2021-2032)
Table 16 Middle East and Africa Sugar Free Beverages Revenue (USD Million) By Region (2021-2032)
Table 17 North America Sugar Free Beverages Revenue (USD Million) By Type (2021-2032)
Table 18 North America Sugar Free Beverages Revenue (USD Million) By Application (2021-2032)
Table 19 North America Sugar Free Beverages Revenue (USD Million) By Product (2021-2032)
Table 20 Europe Sugar Free Beverages Revenue (USD Million) By Type (2021-2032)
Table 21 Europe Sugar Free Beverages Revenue (USD Million) By Application (2021-2032)
Table 22 Europe Sugar Free Beverages Revenue (USD Million) By Product (2021-2032)
Table 23 Asia Pacific Sugar Free Beverages Revenue (USD Million) By Type (2021-2032)
Table 24 Asia Pacific Sugar Free Beverages Revenue (USD Million) By Application (2021-2032)
Table 25 Asia Pacific Sugar Free Beverages Revenue (USD Million) By Product (2021-2032)
Table 26 South America Sugar Free Beverages Revenue (USD Million) By Type (2021-2032)
Table 27 South America Sugar Free Beverages Revenue (USD Million) By Application (2021-2032)
Table 28 South America Sugar Free Beverages Revenue (USD Million) By Product (2021-2032)
Table 29 Middle East and Africa Sugar Free Beverages Revenue (USD Million) By Type (2021-2032)
Table 30 Middle East and Africa Sugar Free Beverages Revenue (USD Million) By Application (2021-2032)
Table 31 Middle East and Africa Sugar Free Beverages Revenue (USD Million) By Product (2021-2032)
LIST OF FIGURES
Figure 1. Market Scope
Figure 2. Pricing Forecasts Per Unit, 2023- 2032
Figure 3. Porter’s Five Forces
Figure 4. Global Sugar Free Beverages Market Revenue (USD Million) By Regions (2021-2032)
Figure 5. Global Sugar Free Beverages Market Share (%) By Regions (2023)
Figure 6. North America Sugar Free Beverages Revenue (USD Million) By Country (2021-2032)
Figure 7. United States Sugar Free Beverages Revenue (USD Million) By Country (2021-2032)
Figure 8. Canada Sugar Free Beverages Revenue (USD Million) By Country (2021-2032)
Figure 9. Mexico Sugar Free Beverages Revenue (USD Million) By Country (2021-2032)
Figure 10. Europe Sugar Free Beverages Revenue (USD Million) By Country (2021-2032)
Figure 11. Germany Sugar Free Beverages Revenue (USD Million) By Country (2021-2032)
Figure 12. France Sugar Free Beverages Revenue (USD Million) By Country (2021-2032)
Figure 13. United Kingdom Sugar Free Beverages Revenue (USD Million) By Country (2021-2032)
Figure 14. Spain Sugar Free Beverages Revenue (USD Million) By Country (2021-2032)
Figure 15. Italy Sugar Free Beverages Revenue (USD Million) By Country (2021-2032)
Figure 16. Russia Sugar Free Beverages Revenue (USD Million) By Country (2021-2032)
Figure 17. Rest of Europe Sugar Free Beverages Revenue (USD Million) By Country (2021-2032)
Figure 11. Asia Pacific Sugar Free Beverages Revenue (USD Million) By Country (2021-2032)
Figure 12. China Sugar Free Beverages Revenue (USD Million) By Country (2021-2032)
Figure 13. Japan Sugar Free Beverages Revenue (USD Million) By Country (2021-2032)
Figure 14. India Sugar Free Beverages Revenue (USD Million) By Country (2021-2032)
Figure 15. South Korea Sugar Free Beverages Revenue (USD Million) By Country (2021-2032)
Figure 16. Australia Sugar Free Beverages Revenue (USD Million) By Country (2021-2032)
Figure 17. South East Asia Sugar Free Beverages Revenue (USD Million) By Country (2021-2032)
Figure 18. South America Sugar Free Beverages Revenue (USD Million) By Country (2021-2032)
Figure 19. Brazil Sugar Free Beverages Revenue (USD Million) By Country (2021-2032)
Figure 20. Argentina Sugar Free Beverages Revenue (USD Million) By Country (2021-2032)
Figure 21. Rest of Asia Pacific Sugar Free Beverages Revenue (USD Million) By Country (2021-2032)
Figure 22. Middle East and Africa Sugar Free Beverages Revenue (USD Million) By Region (2021-2032)
Figure 23. Saudi Arabia Sugar Free Beverages Revenue (USD Million) By Region (2021-2032)
Figure 24. The UAE Sugar Free Beverages Revenue (USD Million) By Region (2021-2032)
Figure 25. Rest of Middle East Sugar Free Beverages Revenue (USD Million) By Region (2021-2032)
Figure 26. South Africa Sugar Free Beverages Revenue (USD Million) By Region (2021-2032)
Figure 27. Africa Sugar Free Beverages Revenue (USD Million) By Region (2021-2032)
Figure 28. North America Sugar Free Beverages Revenue (USD Million) By Type (2021-2032)
Figure 29. North America Sugar Free Beverages Revenue (USD Million) By Application (2021-2032)
Figure 30. North America Sugar Free Beverages Revenue (USD Million) By Product (2021-2032)
Figure 31. Europe Sugar Free Beverages Revenue (USD Million) By Type (2021-2032)
Figure 32. Europe Sugar Free Beverages Revenue (USD Million) By Application (2021-2032)
Figure 33. Europe Sugar Free Beverages Revenue (USD Million) By Product (2021-2032)
Figure 34. Asia Pacific Sugar Free Beverages Revenue (USD Million) By Type (2021-2032)
Figure 35. Asia Pacific Sugar Free Beverages Revenue (USD Million) By Application (2021-2032)
Figure 36. Asia Pacific Sugar Free Beverages Revenue (USD Million) By Product (2021-2032)
Figure 37. South America Sugar Free Beverages Revenue (USD Million) By Type (2021-2032)
Figure 38. South America Sugar Free Beverages Revenue (USD Million) By Application (2021-2032)
Figure 39. South America Sugar Free Beverages Revenue (USD Million) By Product (2021-2032)
Figure 40. Middle East and Africa Sugar Free Beverages Revenue (USD Million) By Type (2021-2032)
Figure 41. Middle East and Africa Sugar Free Beverages Revenue (USD Million) By Application (2021-2032)
Figure 42. Middle East and Africa Sugar Free Beverages Revenue (USD Million) By Product (2021-2032)
By Product
Energy Drinks
Soft Drinks
Fruits & Vegetable Juices
Dairy Beverages
Others
By Distribution Channel
Supermarkets
Convenience Stores
Online Sales
Others
Countries Analyzed
North America (US, Canada, Mexico)
Europe (Germany, UK, France, Spain, Italy, Russia, Rest of Europe)
Asia Pacific (China, India, Japan, South Korea, Australia, South East Asia, Rest of Asia)
South America (Brazil, Argentina, Rest of South America)
Middle East and Africa (Saudi Arabia, UAE, Rest of Middle East, South Africa, Egypt, Rest of Africa)
