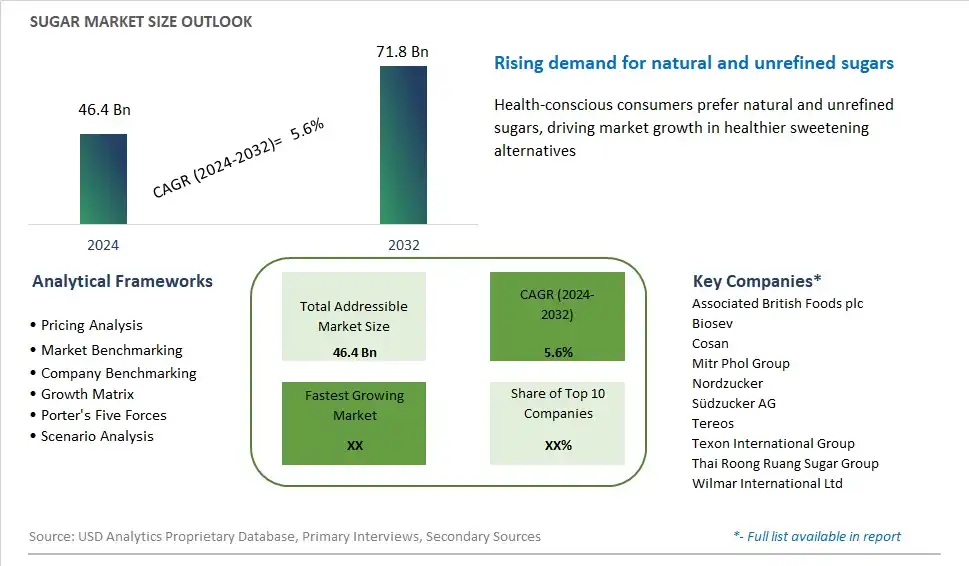
Global Sugar Market Size is valued at $46.4 Billion in 2024 and is forecast to register a growth rate (CAGR) of 5.6% to reach $71.8 Billion by 2032.
The global Sugar Market Comprehensive Study analyzes and forecasts the market size across 6 regions and 24 countries for diverse segments -By Product (White Sugar, Brown Sugar, Liquid Sugar), By Form (Granulated Sugar, Powdered Sugar, Syrup Sugar), By Source (Sugarcane, Sugar Beet), By End-User (Food & Beverages, Pharmaceuticals, Personal Care, Household)
An Introduction to Sugar Market
The sugar market in 2024 is characterized by evolving consumer preferences, shifting regulatory landscapes, and sustainability concerns shaping the production and consumption of this essential commodity. Sugar, derived primarily from sugarcane and sugar beets, plays a fundamental role in the food and beverage industry as a sweetener, preservative, and ingredient in various culinary applications. However, growing awareness of the health risks associated with excessive sugar consumption has prompted consumers to seek alternatives and demand transparency in labeling and sourcing practices. As a result, manufacturers are exploring natural sweeteners such as stevia, monk fruit, and coconut sugar, as well as reducing sugar content in their products to meet changing consumer preferences and regulatory requirements. With sustainability emerging as a key concern, efforts to promote ethical sourcing, fair trade practices, and environmental stewardship are reshaping the sugar industry, driving innovation and collaboration across the supply chain.
Sugar Competitive Landscape
The market report analyses the leading companies in the industry including Associated British Foods plc, Biosev, Cosan, Mitr Phol Group, Nordzucker, Südzucker AG, Tereos, Texon International Group, Thai Roong Ruang Sugar Group, Wilmar International Ltd, and Others.
Sugar Market Dynamics
Sugar Market Trend: Rising Demand for Natural and Alternative Sweeteners
In the sugar market, a prominent trend is the increasing demand for natural and alternative sweeteners. With growing health consciousness among consumers and concerns regarding the negative effects of excessive sugar consumption, there's a shift towards seeking healthier sweetening options. This trend is driving the exploration and adoption of natural sweeteners such as stevia, monk fruit, and agave, as well as alternative options like erythritol and xylitol. Consumers are gravitating towards products that offer sweetness without the drawbacks associated with refined sugar, leading to a surge in the popularity of products labeled as "sugar-free," "no added sugar," or "naturally sweetened." As a result, there's a growing market for innovative sweetening solutions that cater to health-conscious consumers while maintaining taste and functionality in various food and beverage applications.
Market Driver: Regulatory Policies and Health Initiatives
A significant driver impacting the sugar market is the influence of regulatory policies and health initiatives aimed at reducing sugar consumption. Governments and health organizations worldwide are implementing measures such as sugar taxes, mandatory labeling requirements, and public awareness campaigns to address the rising prevalence of obesity, diabetes, and other health issues linked to excessive sugar intake. These policies are prompting food and beverage manufacturers to reformulate their products to lower sugar content, explore alternative ingredients, or introduce sugar-free options to comply with regulations and meet consumer demand for healthier choices. The regulatory landscape and public health campaigns are thus driving innovation and investment in the development of low-sugar and sugar-free alternatives across various food and beverage categories, shaping the direction of the sugar market.
Market Opportunity: Functional and Nutritive Sweeteners
An emerging opportunity within the sugar market lies in the development and commercialization of functional and nutritive sweeteners. Beyond merely providing sweetness, there's a growing demand for sweeteners that offer additional health benefits or nutritional value. Functional sweeteners may include prebiotic fibers, vitamins, minerals, or bioactive compounds that promote digestive health, boost immunity, or support overall well-being. Nutritive sweeteners, on the other hand, provide sweetness along with essential nutrients such as antioxidants, vitamins, or minerals, offering a healthier alternative to traditional sugars. Capitalizing on this opportunity requires research and innovation to identify and incorporate beneficial ingredients into sweetening solutions without compromising taste, texture, or functionality. By tapping into the demand for functional and nutritive sweeteners, companies can differentiate their products, meet evolving consumer preferences for health and wellness, and carve out a competitive edge in the dynamic sugar market landscape.
Sugar Market Share Analysis: White Sugar held the dominant market share in 2024
In the Sugar Market, White Sugar is the largest segment, driven by its versatility, widespread usage, and consumer preference for its neutral flavor profile. White sugar is a highly refined form of sucrose, commonly used in various food and beverage applications, including baking, cooking, and sweetening hot and cold beverages. Its fine texture and ability to dissolve easily make it a preferred choice for both industrial and household purposes. Further, white sugar is a staple ingredient in the food processing industry, utilized in the production of confectionery, desserts, sauces, and beverages. Its long shelf life and consistent quality further contribute to its dominance in the market. As a result, White Sugar solidifies its position as the largest segment in the Sugar Market, catering to diverse consumer needs and driving market growth.
Sugar Market Share Analysis: Syrup Sugar market is poised to register the fastest growth rae over the forecast period to 2032
In the Sugar Market, Syrup Sugar is the fastest-growing segment, propelled by its versatility, convenience, and increasing consumer demand for alternative sweetening options. Syrup sugar offers a liquid form of sweetness, making it easier to incorporate into various culinary creations such as beverages, desserts, and baked goods. Its viscosity allows for precise control over sweetness levels and facilitates even distribution in recipes. Further, syrup sugar is favored for its unique flavor profiles, including maple, agave, and corn syrup, which add depth and complexity to dishes. The rising popularity of natural and organic sweeteners further fuels the growth of the syrup sugar segment, as consumers seek healthier alternatives to traditional granulated and powdered sugars. Additionally, the convenience of ready-to-use syrup sugars appeals to busy consumers and foodservice establishments alike, driving demand and market expansion. As a result, Syrup Sugar emerges as a pivotal force in the Sugar Market, presenting significant opportunities for manufacturers to innovate and capitalize on evolving consumer preferences.
Sugar Market Share Analysis: Sugarcane held the dominant market share in 2024
In the Sugar Market, Sugarcane is the largest segment, driven by its widespread cultivation, higher sugar content, and versatile applications across various industries. Sugarcane serves as the primary source of sugar production globally, accounting for the majority of sugar consumed worldwide. Its robust growth in tropical and subtropical regions, coupled with advancements in agricultural practices and technology, ensures a consistent and reliable supply of raw material for sugar production. Additionally, sugarcane-derived sugar is prized for its natural sweetness and purity, making it a preferred choice for food and beverage manufacturers. The versatility of sugarcane extends beyond sugar production, as it also yields by-products such as molasses, ethanol, and biofuels, contributing to its economic significance. As a result, Sugarcane solidifies its position as the largest segment in the Sugar Market, catering to diverse consumer needs and driving market growth.
Sugar Market Segmentation
By Product
White Sugar
Brown Sugar
Liquid Sugar
By Form
Granulated Sugar
Powdered Sugar
Syrup Sugar
By Source
Sugarcane
Sugar Beet
By End-User
Food & Beverages
-Confectionary
-Bakery Products
-Dairy Products
-Beverages
-Others
Pharmaceuticals
Personal Care
Household
Countries Analyzed
North America (US, Canada, Mexico)
Europe (Germany, UK, France, Spain, Italy, Russia, Rest of Europe)
Asia Pacific (China, India, Japan, South Korea, Australia, South East Asia, Rest of Asia)
South America (Brazil, Argentina, Rest of South America)
Middle East and Africa (Saudi Arabia, UAE, Rest of Middle East, South Africa, Egypt, Rest of Africa)
Sugar Companies Profiled in the Study
Associated British Foods plc
Biosev
Cosan
Mitr Phol Group
Nordzucker
Südzucker AG
Tereos
Texon International Group
Thai Roong Ruang Sugar Group
Wilmar International Ltd
*- List Not Exhaustive
Chapter 1. TABLE OF CONTENTS
Chapter 2. Introduction to Sugar Market
2.1. Market Overview
2.2. Key Statistics and Report Highlights
2.3. Scope of the Comprehensive Study
2.3.1. Market Definition
2.3.2 Countries and Regions Covered
2.3.3 Research Objective
2.3.4 Units, Currency, and Conversions
2.3.5 Industry Value Chain
2.4. Key Market Segments
2.5. Key Companies
2.6. Study Period
Chapter 3. Strategic Analysis Review
3.1. Sugar Pricing Analysis and Forecast
3.2. Porter’s Five Forces
3.3. Market Ecosystem
3.4. SWOT Analysis
3.5. Regulatory Scenario
3.3. Effects of Inflation, Russia-Ukraine War, moderating economic growth, and other macroeconomic factors
Chapter 4. Competitive Landscape
4.1. Market Share Analysis
4.1.1. Global Sugar Market Share by Company, 2023
4.1.2. Product Offerings of Leading Sugar Companies
4.2. Market Entropy
4.2.1. New Product Launches in the Industry
4.2.2. Mergers, Acquisitions, Joint ventures, and Partnerships
4.3. Key Strategies and Best Practices
Chapter 5. Global Market Projections: Best, Reference, and Low Case Scenarios
5.1. Growth Analysis- Case Scenario Definitions
5.2. Low Growth Case Scenario Forecasts
5.3. Reference Growth Case Scenario Forecasts
5.4. High Growth Case Scenario Forecasts
Chapter 6. Market Dynamics
6.1. Sugar Market Drivers
6.2. Sugar Market Challenges
6.6. Sugar Market Opportunities
6.4. Sugar Market Trends
Chapter 7. Global Sugar Market Outlook Trends
7.1. Global Sugar Revenue (USD Million) and CAGR (%) by Type (2021-2032)
7.2. Global Sugar Revenue (USD Million) and CAGR (%) by Application (2021-2032)
7.3. Global Sugar Revenue (USD Million) and CAGR (%) by Product (2021-2032)
By Product
White Sugar
Brown Sugar
Liquid Sugar
By Form
Granulated Sugar
Powdered Sugar
Syrup Sugar
By Source
Sugarcane
Sugar Beet
By End-User
Food & Beverages
-Confectionary
-Bakery Products
-Dairy Products
-Beverages
-Others
Pharmaceuticals
Personal Care
Household
Chapter 8. Global Sugar Regional Analysis and Outlook
8.1. Global Sugar Revenue (USD Million) By Regions (2021- 2032)
8.2. North America Sugar Revenue (USD Million) by Country (2021-2032)
8.2.1. United States Sugar Regional Analysis and Outlook
8.2.2. Canada Sugar Regional Analysis and Outlook
8.2.3. Mexico Sugar Regional Analysis and Outlook
8.3. Europe Sugar Revenue (USD Million), by Country (2021-2032)
8.3.1. Germany Sugar Regional Analysis and Outlook
8.3.2. France Sugar Regional Analysis and Outlook
8.3.3. United Kingdom Sugar Regional Analysis and Outlook
8.3.4. Spain Sugar Regional Analysis and Outlook
8.3.5. Italy Sugar Regional Analysis and Outlook
8.3.6. Russia Sugar Regional Analysis and Outlook
8.3.7. Rest of Europe Sugar Regional Analysis and Outlook
8.4. Asia Pacific Sugar Revenue (USD Million) by Country (2021-2032)
8.4.1. China Sugar Regional Analysis and Outlook
8.4.2. Japan Sugar Regional Analysis and Outlook
8.4.3. India Sugar Regional Analysis and Outlook
8.4.4. South Korea Sugar Regional Analysis and Outlook
8.4.5. Australia Sugar Regional Analysis and Outlook
8.4.6. South East Asia Sugar Regional Analysis and Outlook
8.4.7. Rest of Asia Pacific Sugar Regional Analysis and Outlook
8.5. South America Sugar Revenue (USD Million), by Country (2021-2032)
8.5.1. Brazil Sugar Regional Analysis and Outlook
8.5.2. Argentina Sugar Regional Analysis and Outlook
8.5.3. Rest of South America Sugar Regional Analysis and Outlook
8.6. Middle East and Africa Sugar Revenue (USD Million) by Country (2021-2032)
8.6.1. Middle East Sugar Regional Analysis and Outlook
8.6.2. Africa Sugar Regional Analysis and Outlook
Chapter 9. North America Sugar Analysis and Outlook
9.1. North America Sugar Revenue (USD Million) by Segments (2021-2032)
9.1.1. North America Sugar Revenue (USD Million) by Type (2021-2032)
9.1.2. North America Sugar Revenue (USD Million) by Application (2021-2032)
9.1.3. North America Sugar Revenue (USD Million) by Product (2021-2032)
By Product
White Sugar
Brown Sugar
Liquid Sugar
By Form
Granulated Sugar
Powdered Sugar
Syrup Sugar
By Source
Sugarcane
Sugar Beet
By End-User
Food & Beverages
-Confectionary
-Bakery Products
-Dairy Products
-Beverages
-Others
Pharmaceuticals
Personal Care
Household
Chapter 10. Europe Sugar Analysis and Outlook
10.1. Europe Sugar Revenue (USD Million), by Segments (USD Million) (2021-2032)
10.1.1. Europe Sugar Revenue (USD Million) by Type (2021-2032)
10.1.2. Europe Sugar Revenue (USD Million) by Application (2021-2032)
10.1.3. Europe Sugar Revenue (USD Million) by Product (2021-2032)
By Product
White Sugar
Brown Sugar
Liquid Sugar
By Form
Granulated Sugar
Powdered Sugar
Syrup Sugar
By Source
Sugarcane
Sugar Beet
By End-User
Food & Beverages
-Confectionary
-Bakery Products
-Dairy Products
-Beverages
-Others
Pharmaceuticals
Personal Care
Household
Chapter 11. Asia Pacific Sugar Analysis and Outlook
11.1. Asia Pacific Sugar Revenue (USD Million), and Revenue (USD Million) by Segments (2021-2032)
11.1.1. Asia Pacific Sugar Revenue (USD Million) by Type (2021-2032)
11.1.2. Asia Pacific Sugar Revenue (USD Million) by Application (2021-2032)
11.1.3. Asia Pacific Sugar Revenue (USD Million) by Product (2021-2032)
By Product
White Sugar
Brown Sugar
Liquid Sugar
By Form
Granulated Sugar
Powdered Sugar
Syrup Sugar
By Source
Sugarcane
Sugar Beet
By End-User
Food & Beverages
-Confectionary
-Bakery Products
-Dairy Products
-Beverages
-Others
Pharmaceuticals
Personal Care
Household
Chapter 12. South America Sugar Analysis and Outlook
12.1. South America Sugar Revenue (USD Million), by Segments (2021-2032)
12.1.1. South America Sugar Revenue (USD Million) by Type (2021-2032)
12.1.2. South America Sugar Revenue (USD Million) by Application (2021-2032)
12.1.3. South America Sugar Revenue (USD Million) by Product (2021-2032)
By Product
White Sugar
Brown Sugar
Liquid Sugar
By Form
Granulated Sugar
Powdered Sugar
Syrup Sugar
By Source
Sugarcane
Sugar Beet
By End-User
Food & Beverages
-Confectionary
-Bakery Products
-Dairy Products
-Beverages
-Others
Pharmaceuticals
Personal Care
Household
Chapter 13. Middle East and Africa Sugar Analysis and Outlook
13.1. Middle East and Africa Sugar Revenue (USD Million), by Segments (2021-2032)
13.1.1. Middle East and Africa Sugar Revenue (USD Million) by Type (2021-2032)
13.1.2. Middle East and Africa Sugar Revenue (USD Million) by Application (2021-2032)
13.1.3. Middle East and Africa Sugar Revenue (USD Million) by Product (2021-2032)
By Product
White Sugar
Brown Sugar
Liquid Sugar
By Form
Granulated Sugar
Powdered Sugar
Syrup Sugar
By Source
Sugarcane
Sugar Beet
By End-User
Food & Beverages
-Confectionary
-Bakery Products
-Dairy Products
-Beverages
-Others
Pharmaceuticals
Personal Care
Household
Chapter 14. Sugar Company Profiles
14.1 Business Overview
14.2 Product Profiles
14.3 SWOT Profiles
14.5 Recent Developments
14.6 Financial Profile
List of Companies
Associated British Foods plc
Biosev
Cosan
Mitr Phol Group
Nordzucker
Südzucker AG
Tereos
Texon International Group
Thai Roong Ruang Sugar Group
Wilmar International Ltd
15. Methodology and Data Sources
15.1 Customization Offerings
15.2 Subscription Services
15.3 Related Reports
15.4 Publisher Expertise
LIST OF TABLES
Table 1 Market Segmentation Analysis
Table 2 Global Sugar Market Share of Leading Companies, 2023
Table 3 Product Offerings of Leading Companies
Table 4 Low Growth Scenario Forecasts
Table 5 Reference Case Growth Scenario
Table 6 High Growth Case Scenario
Table 7 Global Sugar Revenue (USD Million) And CAGR (%) By Type (2021-2032)
Table 8 Global Sugar Revenue (USD Million) And CAGR (%) By Application (2021-2032)
Table 9 Global Sugar Revenue (USD Million) And CAGR (%) By Product (2021-2032)
Table 10 Global Sugar Market Revenue (USD Million) By Regions (2021-2032)
Table 11 Global Sugar Market Share (%) By Regions (2021-2032)
Table 12 North America Sugar Revenue (USD Million) By Country (2021-2032)
Table 13 Europe Sugar Revenue (USD Million) By Country (2021-2032)
Table 14 Asia Pacific Sugar Revenue (USD Million) By Country (2021-2032)
Table 15 South America Sugar Revenue (USD Million) By Country (2021-2032)
Table 16 Middle East and Africa Sugar Revenue (USD Million) By Region (2021-2032)
Table 17 North America Sugar Revenue (USD Million) By Type (2021-2032)
Table 18 North America Sugar Revenue (USD Million) By Application (2021-2032)
Table 19 North America Sugar Revenue (USD Million) By Product (2021-2032)
Table 20 Europe Sugar Revenue (USD Million) By Type (2021-2032)
Table 21 Europe Sugar Revenue (USD Million) By Application (2021-2032)
Table 22 Europe Sugar Revenue (USD Million) By Product (2021-2032)
Table 23 Asia Pacific Sugar Revenue (USD Million) By Type (2021-2032)
Table 24 Asia Pacific Sugar Revenue (USD Million) By Application (2021-2032)
Table 25 Asia Pacific Sugar Revenue (USD Million) By Product (2021-2032)
Table 26 South America Sugar Revenue (USD Million) By Type (2021-2032)
Table 27 South America Sugar Revenue (USD Million) By Application (2021-2032)
Table 28 South America Sugar Revenue (USD Million) By Product (2021-2032)
Table 29 Middle East and Africa Sugar Revenue (USD Million) By Type (2021-2032)
Table 30 Middle East and Africa Sugar Revenue (USD Million) By Application (2021-2032)
Table 31 Middle East and Africa Sugar Revenue (USD Million) By Product (2021-2032)
LIST OF FIGURES
Figure 1. Market Scope
Figure 2. Pricing Forecasts Per Unit, 2023- 2032
Figure 3. Porter’s Five Forces
Figure 4. Global Sugar Market Revenue (USD Million) By Regions (2021-2032)
Figure 5. Global Sugar Market Share (%) By Regions (2023)
Figure 6. North America Sugar Revenue (USD Million) By Country (2021-2032)
Figure 7. United States Sugar Revenue (USD Million) By Country (2021-2032)
Figure 8. Canada Sugar Revenue (USD Million) By Country (2021-2032)
Figure 9. Mexico Sugar Revenue (USD Million) By Country (2021-2032)
Figure 10. Europe Sugar Revenue (USD Million) By Country (2021-2032)
Figure 11. Germany Sugar Revenue (USD Million) By Country (2021-2032)
Figure 12. France Sugar Revenue (USD Million) By Country (2021-2032)
Figure 13. United Kingdom Sugar Revenue (USD Million) By Country (2021-2032)
Figure 14. Spain Sugar Revenue (USD Million) By Country (2021-2032)
Figure 15. Italy Sugar Revenue (USD Million) By Country (2021-2032)
Figure 16. Russia Sugar Revenue (USD Million) By Country (2021-2032)
Figure 17. Rest of Europe Sugar Revenue (USD Million) By Country (2021-2032)
Figure 11. Asia Pacific Sugar Revenue (USD Million) By Country (2021-2032)
Figure 12. China Sugar Revenue (USD Million) By Country (2021-2032)
Figure 13. Japan Sugar Revenue (USD Million) By Country (2021-2032)
Figure 14. India Sugar Revenue (USD Million) By Country (2021-2032)
Figure 15. South Korea Sugar Revenue (USD Million) By Country (2021-2032)
Figure 16. Australia Sugar Revenue (USD Million) By Country (2021-2032)
Figure 17. South East Asia Sugar Revenue (USD Million) By Country (2021-2032)
Figure 18. South America Sugar Revenue (USD Million) By Country (2021-2032)
Figure 19. Brazil Sugar Revenue (USD Million) By Country (2021-2032)
Figure 20. Argentina Sugar Revenue (USD Million) By Country (2021-2032)
Figure 21. Rest of Asia Pacific Sugar Revenue (USD Million) By Country (2021-2032)
Figure 22. Middle East and Africa Sugar Revenue (USD Million) By Region (2021-2032)
Figure 23. Saudi Arabia Sugar Revenue (USD Million) By Region (2021-2032)
Figure 24. The UAE Sugar Revenue (USD Million) By Region (2021-2032)
Figure 25. Rest of Middle East Sugar Revenue (USD Million) By Region (2021-2032)
Figure 26. South Africa Sugar Revenue (USD Million) By Region (2021-2032)
Figure 27. Africa Sugar Revenue (USD Million) By Region (2021-2032)
Figure 28. North America Sugar Revenue (USD Million) By Type (2021-2032)
Figure 29. North America Sugar Revenue (USD Million) By Application (2021-2032)
Figure 30. North America Sugar Revenue (USD Million) By Product (2021-2032)
Figure 31. Europe Sugar Revenue (USD Million) By Type (2021-2032)
Figure 32. Europe Sugar Revenue (USD Million) By Application (2021-2032)
Figure 33. Europe Sugar Revenue (USD Million) By Product (2021-2032)
Figure 34. Asia Pacific Sugar Revenue (USD Million) By Type (2021-2032)
Figure 35. Asia Pacific Sugar Revenue (USD Million) By Application (2021-2032)
Figure 36. Asia Pacific Sugar Revenue (USD Million) By Product (2021-2032)
Figure 37. South America Sugar Revenue (USD Million) By Type (2021-2032)
Figure 38. South America Sugar Revenue (USD Million) By Application (2021-2032)
Figure 39. South America Sugar Revenue (USD Million) By Product (2021-2032)
Figure 40. Middle East and Africa Sugar Revenue (USD Million) By Type (2021-2032)
Figure 41. Middle East and Africa Sugar Revenue (USD Million) By Application (2021-2032)
Figure 42. Middle East and Africa Sugar Revenue (USD Million) By Product (2021-2032)
By Product
White Sugar
Brown Sugar
Liquid Sugar
By Form
Granulated Sugar
Powdered Sugar
Syrup Sugar
By Source
Sugarcane
Sugar Beet
By End-User
Food & Beverages
-Confectionary
-Bakery Products
-Dairy Products
-Beverages
-Others
Pharmaceuticals
Personal Care
Household
Countries Analyzed
North America (US, Canada, Mexico)
Europe (Germany, UK, France, Spain, Italy, Russia, Rest of Europe)
Asia Pacific (China, India, Japan, South Korea, Australia, South East Asia, Rest of Asia)
South America (Brazil, Argentina, Rest of South America)
Middle East and Africa (Saudi Arabia, UAE, Rest of Middle East, South Africa, Egypt, Rest of Africa)
