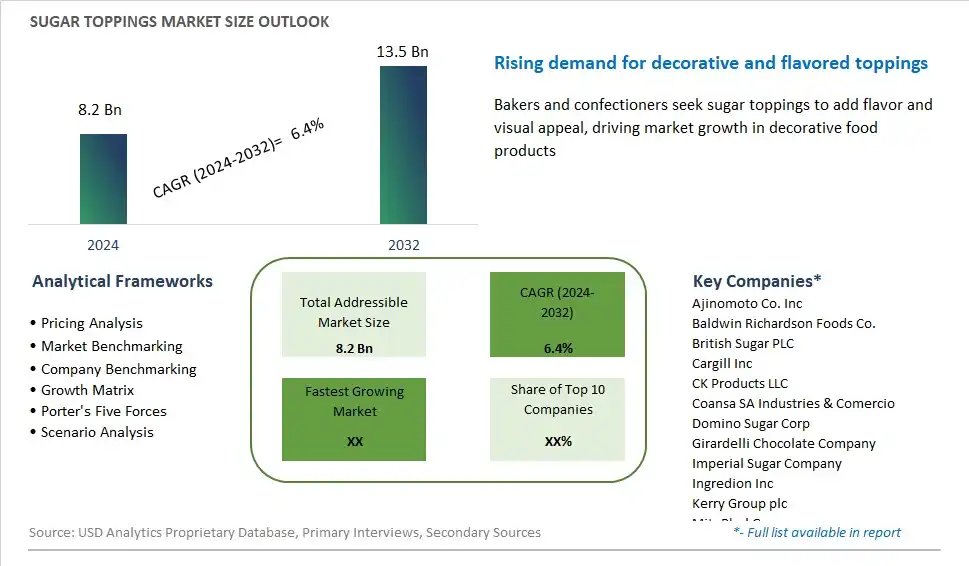
Global Sugar Toppings Market Size is valued at $8.2 Billion in 2024 and is forecast to register a growth rate (CAGR) of 6.4% to reach $13.5 Billion by 2032.
The global Sugar Toppings Market Comprehensive Study analyzes and forecasts the market size across 6 regions and 24 countries for diverse segments -By Nature (Organic, Conventional), By Type (Dry, Wet), By Application (Bakery, Confectionery, Dairy, Ready to eat Snacks, Convenience food, Packaged food)
An Introduction to Sugar Toppings Market
Sugar toppings are sweet and crunchy coatings or garnishes made from sugar or sugar-based ingredients used to add flavor, texture, and visual appeal to a variety of food and beverage products in 2024. These toppings come in various forms such as granules, crystals, pearls, or flakes and are commonly used to decorate and sweeten items such as cakes, cookies, muffins, breakfast cereals, and desserts. Sugar toppings may be flavored with natural or artificial flavors such as vanilla, chocolate, fruit, or spices to enhance taste and aroma. With the growing demand for indulgent and Instagrammable treats, the market for sugar toppings is expanding, driven by innovations in flavor varieties, packaging formats, and application methods that enable manufacturers to create eye-catching and delicious products to attract consumers seeking sensory experiences and moments of indulgence in their everyday lives.
Sugar Toppings Competitive Landscape
The market report analyses the leading companies in the industry including Ajinomoto Co. Inc, Baldwin Richardson Foods Co., British Sugar PLC, Cargill Inc, CK Products LLC, Coansa SA Industries & Comercio, Domino Sugar Corp, Girardelli Chocolate Company, Imperial Sugar Company, Ingredion Inc, Kerry Group plc, Mitr Phol Group, Monin Inc, Nordic Sugar A/S, Paulaur Corp, Pinnacle Foods Inc, Quaker Oats Company, R.Torre & Company Inc, Regal Food Products Group PLC, Sudzucker AG, Tate & Lyle PLC, Tereos International, The Hershey Company, The J.M. Smucker Company, The Kraft Heinz Company, W. T. Lynch Foods Ltd, Watson Inc, Zydus Wellness Ltd, and Others.
Sugar Toppings Market Dynamics
Sugar Toppings Market Trend: Rising Demand for Premium and Specialty Desserts
A prominent market trend for sugar toppings is the rising demand for premium and specialty desserts. Consumers are increasingly seeking indulgent and visually appealing dessert experiences, driving the demand for high-quality toppings to enhance the flavor and presentation of sweet treats. From gourmet cupcakes and artisanal ice creams to decadent cakes and pastries, the use of premium sugar toppings adds a touch of luxury and sophistication to desserts, aligning with the growing trend of experiential dining and social media-worthy creations. As consumers continue to prioritize taste, texture, and aesthetics in their dessert choices, the market for sugar toppings is witnessing a shift towards premiumization and customization.
Market Driver: Growth in Bakery and Foodservice Industry
A significant market driver for sugar toppings is the growth in the bakery and foodservice industry. With the proliferation of cafes, bakeries, dessert shops, and restaurants globally, there is a consistent demand for a wide range of dessert toppings to cater to diverse consumer preferences and culinary trends. Sugar toppings play a crucial role in adding flavor, texture, and visual appeal to various bakery and dessert offerings, driving their incorporation into a variety of sweet creations. As the bakery and foodservice sectors continue to expand, driven by changing consumer lifestyles, increasing disposable incomes, and growing urbanization, the demand for sugar toppings is expected to remain robust, providing a steady market opportunity for manufacturers and suppliers.
Market Opportunity: Innovation in Healthier and Functional Sugar Alternatives
An opportunity within the sugar toppings market lies in the innovation of healthier and functional sugar alternatives. With growing consumer awareness of the health risks associated with excessive sugar consumption, there is a rising demand for sugar-free or reduced-sugar options in the dessert segment. Manufacturers of sugar toppings can capitalize on this trend by developing innovative products using natural sweeteners such as stevia, erythritol, or monk fruit extract, offering consumers guilt-free indulgence without compromising on taste or quality. Additionally, there is an opportunity to incorporate functional ingredients like probiotics, vitamins, or antioxidants into sugar toppings to enhance their nutritional profile and appeal to health-conscious consumers. By tapping into the demand for healthier and functional dessert options, manufacturers of sugar toppings can differentiate themselves in the market and cater to evolving consumer preferences.
Sugar Toppings Market Share Analysis: Conventional held the dominant market share in 2024
In the Sugar Toppings Market, the Conventional segment is the largest category, driven by its widespread availability, established supply chains, and cost-effectiveness compared to organic alternatives. Conventional sugar toppings are widely utilized in various food and beverage applications, including desserts, breakfast items, beverages, and snacks. The conventional sugar toppings segment benefits from economies of scale and streamlined production processes, allowing for competitive pricing and accessibility to a broader consumer base. Additionally, conventional sugar toppings meet the demand for traditional and familiar flavors, textures, and aesthetics in culinary creations, appealing to a wide range of consumers. While there is a growing interest in organic and clean label products, the Conventional segment maintains its market dominance due to its affordability and widespread adoption across the food industry. With consumers prioritizing taste, affordability, and convenience, the Conventional segment continues to drive growth within the Sugar Toppings Market.
Sugar Toppings Market Share Analysis: Wet market is poised to register the fastest growth rae over the forecast period to 2032
Among the segments in the Sugar Toppings Market, the Wet segment is the fastest-growing category, driven by the increasing demand for convenience, customization, and indulgence in sweet treats. Wet sugar toppings, such as syrups, sauces, and glazes, offer a convenient solution for adding sweetness, flavor, and moisture to a wide range of desserts, breakfast items, and beverages. These toppings are favored for their versatility and ease of application, allowing for drizzling, dipping, or spreading onto various food products. Additionally, wet sugar toppings provide opportunities for flavor innovation and customization, as manufacturers can formulate a diverse range of flavors, textures, and viscosities to cater to evolving consumer preferences. With the rising popularity of dessert indulgence and the growing trend of gourmet and artisanal sweet treats, the Wet segment presents significant growth opportunities for manufacturers to innovate and expand their product portfolios within the Sugar Toppings Market.
Sugar Toppings Market Share Analysis: Bakery held the dominant market share in 2024
Within the Sugar Toppings Market, the Bakery segment is the largest category, driven by the extensive use of sugar toppings in various baked goods and pastry items. Sugar toppings are essential for adding sweetness, texture, and visual appeal to a wide range of bakery products, including cakes, pastries, cookies, muffins, and bread. From colorful sprinkles and decorative icing to caramel drizzles and glazes, sugar toppings enhance the sensory experience and aesthetic appeal of baked goods, enticing consumers and driving sales. Further, the bakery industry's continued innovation in product offerings, such as specialty and artisanal baked goods, further fuels the demand for a diverse range of sugar toppings. With consumers' enduring love for baked treats and the growing trend of premiumization in the bakery sector, the Bakery segment maintains its dominance in the Sugar Toppings Market, presenting significant opportunities for manufacturers to innovate and cater to evolving consumer preferences within the baking industry.
Sugar Toppings Market Segmentation
By Nature
Organic
Conventional
By Type
Dry
Wet
By Application
Bakery
Confectionery
Dairy
Ready to eat Snacks
Convenience food
Packaged food
Countries Analyzed
North America (US, Canada, Mexico)
Europe (Germany, UK, France, Spain, Italy, Russia, Rest of Europe)
Asia Pacific (China, India, Japan, South Korea, Australia, South East Asia, Rest of Asia)
South America (Brazil, Argentina, Rest of South America)
Middle East and Africa (Saudi Arabia, UAE, Rest of Middle East, South Africa, Egypt, Rest of Africa)
Sugar Toppings Companies Profiled in the Study
Ajinomoto Co. Inc
Baldwin Richardson Foods Co.
British Sugar PLC
Cargill Inc
CK Products LLC
Coansa SA Industries & Comercio
Domino Sugar Corp
Girardelli Chocolate Company
Imperial Sugar Company
Ingredion Inc
Kerry Group plc
Mitr Phol Group
Monin Inc
Nordic Sugar A/S
Paulaur Corp
Pinnacle Foods Inc
Quaker Oats Company
R.Torre & Company Inc
Regal Food Products Group PLC
Sudzucker AG
Tate & Lyle PLC
Tereos International
The Hershey Company
The J.M. Smucker Company
The Kraft Heinz Company
W. T. Lynch Foods Ltd
Watson Inc
Zydus Wellness Ltd
*- List Not Exhaustive
Chapter 1. TABLE OF CONTENTS
Chapter 2. Introduction to Sugar Toppings Market
2.1. Market Overview
2.2. Key Statistics and Report Highlights
2.3. Scope of the Comprehensive Study
2.3.1. Market Definition
2.3.2 Countries and Regions Covered
2.3.3 Research Objective
2.3.4 Units, Currency, and Conversions
2.3.5 Industry Value Chain
2.4. Key Market Segments
2.5. Key Companies
2.6. Study Period
Chapter 3. Strategic Analysis Review
3.1. Sugar Toppings Pricing Analysis and Forecast
3.2. Porter’s Five Forces
3.3. Market Ecosystem
3.4. SWOT Analysis
3.5. Regulatory Scenario
3.3. Effects of Inflation, Russia-Ukraine War, moderating economic growth, and other macroeconomic factors
Chapter 4. Competitive Landscape
4.1. Market Share Analysis
4.1.1. Global Sugar Toppings Market Share by Company, 2023
4.1.2. Product Offerings of Leading Sugar Toppings Companies
4.2. Market Entropy
4.2.1. New Product Launches in the Industry
4.2.2. Mergers, Acquisitions, Joint ventures, and Partnerships
4.3. Key Strategies and Best Practices
Chapter 5. Global Market Projections: Best, Reference, and Low Case Scenarios
5.1. Growth Analysis- Case Scenario Definitions
5.2. Low Growth Case Scenario Forecasts
5.3. Reference Growth Case Scenario Forecasts
5.4. High Growth Case Scenario Forecasts
Chapter 6. Market Dynamics
6.1. Sugar Toppings Market Drivers
6.2. Sugar Toppings Market Challenges
6.6. Sugar Toppings Market Opportunities
6.4. Sugar Toppings Market Trends
Chapter 7. Global Sugar Toppings Market Outlook Trends
7.1. Global Sugar Toppings Revenue (USD Million) and CAGR (%) by Type (2021-2032)
7.2. Global Sugar Toppings Revenue (USD Million) and CAGR (%) by Application (2021-2032)
7.3. Global Sugar Toppings Revenue (USD Million) and CAGR (%) by Product (2021-2032)
By Nature
Organic
Conventional
By Type
Dry
Wet
By Application
Bakery
Confectionery
Dairy
Ready to eat Snacks
Convenience food
Packaged food
Chapter 8. Global Sugar Toppings Regional Analysis and Outlook
8.1. Global Sugar Toppings Revenue (USD Million) By Regions (2021- 2032)
8.2. North America Sugar Toppings Revenue (USD Million) by Country (2021-2032)
8.2.1. United States Sugar Toppings Regional Analysis and Outlook
8.2.2. Canada Sugar Toppings Regional Analysis and Outlook
8.2.3. Mexico Sugar Toppings Regional Analysis and Outlook
8.3. Europe Sugar Toppings Revenue (USD Million), by Country (2021-2032)
8.3.1. Germany Sugar Toppings Regional Analysis and Outlook
8.3.2. France Sugar Toppings Regional Analysis and Outlook
8.3.3. United Kingdom Sugar Toppings Regional Analysis and Outlook
8.3.4. Spain Sugar Toppings Regional Analysis and Outlook
8.3.5. Italy Sugar Toppings Regional Analysis and Outlook
8.3.6. Russia Sugar Toppings Regional Analysis and Outlook
8.3.7. Rest of Europe Sugar Toppings Regional Analysis and Outlook
8.4. Asia Pacific Sugar Toppings Revenue (USD Million) by Country (2021-2032)
8.4.1. China Sugar Toppings Regional Analysis and Outlook
8.4.2. Japan Sugar Toppings Regional Analysis and Outlook
8.4.3. India Sugar Toppings Regional Analysis and Outlook
8.4.4. South Korea Sugar Toppings Regional Analysis and Outlook
8.4.5. Australia Sugar Toppings Regional Analysis and Outlook
8.4.6. South East Asia Sugar Toppings Regional Analysis and Outlook
8.4.7. Rest of Asia Pacific Sugar Toppings Regional Analysis and Outlook
8.5. South America Sugar Toppings Revenue (USD Million), by Country (2021-2032)
8.5.1. Brazil Sugar Toppings Regional Analysis and Outlook
8.5.2. Argentina Sugar Toppings Regional Analysis and Outlook
8.5.3. Rest of South America Sugar Toppings Regional Analysis and Outlook
8.6. Middle East and Africa Sugar Toppings Revenue (USD Million) by Country (2021-2032)
8.6.1. Middle East Sugar Toppings Regional Analysis and Outlook
8.6.2. Africa Sugar Toppings Regional Analysis and Outlook
Chapter 9. North America Sugar Toppings Analysis and Outlook
9.1. North America Sugar Toppings Revenue (USD Million) by Segments (2021-2032)
9.1.1. North America Sugar Toppings Revenue (USD Million) by Type (2021-2032)
9.1.2. North America Sugar Toppings Revenue (USD Million) by Application (2021-2032)
9.1.3. North America Sugar Toppings Revenue (USD Million) by Product (2021-2032)
By Nature
Organic
Conventional
By Type
Dry
Wet
By Application
Bakery
Confectionery
Dairy
Ready to eat Snacks
Convenience food
Packaged food
Chapter 10. Europe Sugar Toppings Analysis and Outlook
10.1. Europe Sugar Toppings Revenue (USD Million), by Segments (USD Million) (2021-2032)
10.1.1. Europe Sugar Toppings Revenue (USD Million) by Type (2021-2032)
10.1.2. Europe Sugar Toppings Revenue (USD Million) by Application (2021-2032)
10.1.3. Europe Sugar Toppings Revenue (USD Million) by Product (2021-2032)
By Nature
Organic
Conventional
By Type
Dry
Wet
By Application
Bakery
Confectionery
Dairy
Ready to eat Snacks
Convenience food
Packaged food
Chapter 11. Asia Pacific Sugar Toppings Analysis and Outlook
11.1. Asia Pacific Sugar Toppings Revenue (USD Million), and Revenue (USD Million) by Segments (2021-2032)
11.1.1. Asia Pacific Sugar Toppings Revenue (USD Million) by Type (2021-2032)
11.1.2. Asia Pacific Sugar Toppings Revenue (USD Million) by Application (2021-2032)
11.1.3. Asia Pacific Sugar Toppings Revenue (USD Million) by Product (2021-2032)
By Nature
Organic
Conventional
By Type
Dry
Wet
By Application
Bakery
Confectionery
Dairy
Ready to eat Snacks
Convenience food
Packaged food
Chapter 12. South America Sugar Toppings Analysis and Outlook
12.1. South America Sugar Toppings Revenue (USD Million), by Segments (2021-2032)
12.1.1. South America Sugar Toppings Revenue (USD Million) by Type (2021-2032)
12.1.2. South America Sugar Toppings Revenue (USD Million) by Application (2021-2032)
12.1.3. South America Sugar Toppings Revenue (USD Million) by Product (2021-2032)
By Nature
Organic
Conventional
By Type
Dry
Wet
By Application
Bakery
Confectionery
Dairy
Ready to eat Snacks
Convenience food
Packaged food
Chapter 13. Middle East and Africa Sugar Toppings Analysis and Outlook
13.1. Middle East and Africa Sugar Toppings Revenue (USD Million), by Segments (2021-2032)
13.1.1. Middle East and Africa Sugar Toppings Revenue (USD Million) by Type (2021-2032)
13.1.2. Middle East and Africa Sugar Toppings Revenue (USD Million) by Application (2021-2032)
13.1.3. Middle East and Africa Sugar Toppings Revenue (USD Million) by Product (2021-2032)
By Nature
Organic
Conventional
By Type
Dry
Wet
By Application
Bakery
Confectionery
Dairy
Ready to eat Snacks
Convenience food
Packaged food
Chapter 14. Sugar Toppings Company Profiles
14.1 Business Overview
14.2 Product Profiles
14.3 SWOT Profiles
14.5 Recent Developments
14.6 Financial Profile
List of Companies
Ajinomoto Co. Inc
Baldwin Richardson Foods Co.
British Sugar PLC
Cargill Inc
CK Products LLC
Coansa SA Industries & Comercio
Domino Sugar Corp
Girardelli Chocolate Company
Imperial Sugar Company
Ingredion Inc
Kerry Group plc
Mitr Phol Group
Monin Inc
Nordic Sugar A/S
Paulaur Corp
Pinnacle Foods Inc
Quaker Oats Company
R.Torre & Company Inc
Regal Food Products Group PLC
Sudzucker AG
Tate & Lyle PLC
Tereos International
The Hershey Company
The J.M. Smucker Company
The Kraft Heinz Company
W. T. Lynch Foods Ltd
Watson Inc
Zydus Wellness Ltd
15. Methodology and Data Sources
15.1 Customization Offerings
15.2 Subscription Services
15.3 Related Reports
15.4 Publisher Expertise
LIST OF TABLES
Table 1 Market Segmentation Analysis
Table 2 Global Sugar Toppings Market Share of Leading Companies, 2023
Table 3 Product Offerings of Leading Companies
Table 4 Low Growth Scenario Forecasts
Table 5 Reference Case Growth Scenario
Table 6 High Growth Case Scenario
Table 7 Global Sugar Toppings Revenue (USD Million) And CAGR (%) By Type (2021-2032)
Table 8 Global Sugar Toppings Revenue (USD Million) And CAGR (%) By Application (2021-2032)
Table 9 Global Sugar Toppings Revenue (USD Million) And CAGR (%) By Product (2021-2032)
Table 10 Global Sugar Toppings Market Revenue (USD Million) By Regions (2021-2032)
Table 11 Global Sugar Toppings Market Share (%) By Regions (2021-2032)
Table 12 North America Sugar Toppings Revenue (USD Million) By Country (2021-2032)
Table 13 Europe Sugar Toppings Revenue (USD Million) By Country (2021-2032)
Table 14 Asia Pacific Sugar Toppings Revenue (USD Million) By Country (2021-2032)
Table 15 South America Sugar Toppings Revenue (USD Million) By Country (2021-2032)
Table 16 Middle East and Africa Sugar Toppings Revenue (USD Million) By Region (2021-2032)
Table 17 North America Sugar Toppings Revenue (USD Million) By Type (2021-2032)
Table 18 North America Sugar Toppings Revenue (USD Million) By Application (2021-2032)
Table 19 North America Sugar Toppings Revenue (USD Million) By Product (2021-2032)
Table 20 Europe Sugar Toppings Revenue (USD Million) By Type (2021-2032)
Table 21 Europe Sugar Toppings Revenue (USD Million) By Application (2021-2032)
Table 22 Europe Sugar Toppings Revenue (USD Million) By Product (2021-2032)
Table 23 Asia Pacific Sugar Toppings Revenue (USD Million) By Type (2021-2032)
Table 24 Asia Pacific Sugar Toppings Revenue (USD Million) By Application (2021-2032)
Table 25 Asia Pacific Sugar Toppings Revenue (USD Million) By Product (2021-2032)
Table 26 South America Sugar Toppings Revenue (USD Million) By Type (2021-2032)
Table 27 South America Sugar Toppings Revenue (USD Million) By Application (2021-2032)
Table 28 South America Sugar Toppings Revenue (USD Million) By Product (2021-2032)
Table 29 Middle East and Africa Sugar Toppings Revenue (USD Million) By Type (2021-2032)
Table 30 Middle East and Africa Sugar Toppings Revenue (USD Million) By Application (2021-2032)
Table 31 Middle East and Africa Sugar Toppings Revenue (USD Million) By Product (2021-2032)
LIST OF FIGURES
Figure 1. Market Scope
Figure 2. Pricing Forecasts Per Unit, 2023- 2032
Figure 3. Porter’s Five Forces
Figure 4. Global Sugar Toppings Market Revenue (USD Million) By Regions (2021-2032)
Figure 5. Global Sugar Toppings Market Share (%) By Regions (2023)
Figure 6. North America Sugar Toppings Revenue (USD Million) By Country (2021-2032)
Figure 7. United States Sugar Toppings Revenue (USD Million) By Country (2021-2032)
Figure 8. Canada Sugar Toppings Revenue (USD Million) By Country (2021-2032)
Figure 9. Mexico Sugar Toppings Revenue (USD Million) By Country (2021-2032)
Figure 10. Europe Sugar Toppings Revenue (USD Million) By Country (2021-2032)
Figure 11. Germany Sugar Toppings Revenue (USD Million) By Country (2021-2032)
Figure 12. France Sugar Toppings Revenue (USD Million) By Country (2021-2032)
Figure 13. United Kingdom Sugar Toppings Revenue (USD Million) By Country (2021-2032)
Figure 14. Spain Sugar Toppings Revenue (USD Million) By Country (2021-2032)
Figure 15. Italy Sugar Toppings Revenue (USD Million) By Country (2021-2032)
Figure 16. Russia Sugar Toppings Revenue (USD Million) By Country (2021-2032)
Figure 17. Rest of Europe Sugar Toppings Revenue (USD Million) By Country (2021-2032)
Figure 11. Asia Pacific Sugar Toppings Revenue (USD Million) By Country (2021-2032)
Figure 12. China Sugar Toppings Revenue (USD Million) By Country (2021-2032)
Figure 13. Japan Sugar Toppings Revenue (USD Million) By Country (2021-2032)
Figure 14. India Sugar Toppings Revenue (USD Million) By Country (2021-2032)
Figure 15. South Korea Sugar Toppings Revenue (USD Million) By Country (2021-2032)
Figure 16. Australia Sugar Toppings Revenue (USD Million) By Country (2021-2032)
Figure 17. South East Asia Sugar Toppings Revenue (USD Million) By Country (2021-2032)
Figure 18. South America Sugar Toppings Revenue (USD Million) By Country (2021-2032)
Figure 19. Brazil Sugar Toppings Revenue (USD Million) By Country (2021-2032)
Figure 20. Argentina Sugar Toppings Revenue (USD Million) By Country (2021-2032)
Figure 21. Rest of Asia Pacific Sugar Toppings Revenue (USD Million) By Country (2021-2032)
Figure 22. Middle East and Africa Sugar Toppings Revenue (USD Million) By Region (2021-2032)
Figure 23. Saudi Arabia Sugar Toppings Revenue (USD Million) By Region (2021-2032)
Figure 24. The UAE Sugar Toppings Revenue (USD Million) By Region (2021-2032)
Figure 25. Rest of Middle East Sugar Toppings Revenue (USD Million) By Region (2021-2032)
Figure 26. South Africa Sugar Toppings Revenue (USD Million) By Region (2021-2032)
Figure 27. Africa Sugar Toppings Revenue (USD Million) By Region (2021-2032)
Figure 28. North America Sugar Toppings Revenue (USD Million) By Type (2021-2032)
Figure 29. North America Sugar Toppings Revenue (USD Million) By Application (2021-2032)
Figure 30. North America Sugar Toppings Revenue (USD Million) By Product (2021-2032)
Figure 31. Europe Sugar Toppings Revenue (USD Million) By Type (2021-2032)
Figure 32. Europe Sugar Toppings Revenue (USD Million) By Application (2021-2032)
Figure 33. Europe Sugar Toppings Revenue (USD Million) By Product (2021-2032)
Figure 34. Asia Pacific Sugar Toppings Revenue (USD Million) By Type (2021-2032)
Figure 35. Asia Pacific Sugar Toppings Revenue (USD Million) By Application (2021-2032)
Figure 36. Asia Pacific Sugar Toppings Revenue (USD Million) By Product (2021-2032)
Figure 37. South America Sugar Toppings Revenue (USD Million) By Type (2021-2032)
Figure 38. South America Sugar Toppings Revenue (USD Million) By Application (2021-2032)
Figure 39. South America Sugar Toppings Revenue (USD Million) By Product (2021-2032)
Figure 40. Middle East and Africa Sugar Toppings Revenue (USD Million) By Type (2021-2032)
Figure 41. Middle East and Africa Sugar Toppings Revenue (USD Million) By Application (2021-2032)
Figure 42. Middle East and Africa Sugar Toppings Revenue (USD Million) By Product (2021-2032)
By Nature
Organic
Conventional
By Type
Dry
Wet
By Application
Bakery
Confectionery
Dairy
Ready to eat Snacks
Convenience food
Packaged food
Countries Analyzed
North America (US, Canada, Mexico)
Europe (Germany, UK, France, Spain, Italy, Russia, Rest of Europe)
Asia Pacific (China, India, Japan, South Korea, Australia, South East Asia, Rest of Asia)
South America (Brazil, Argentina, Rest of South America)
Middle East and Africa (Saudi Arabia, UAE, Rest of Middle East, South Africa, Egypt, Rest of Africa)
