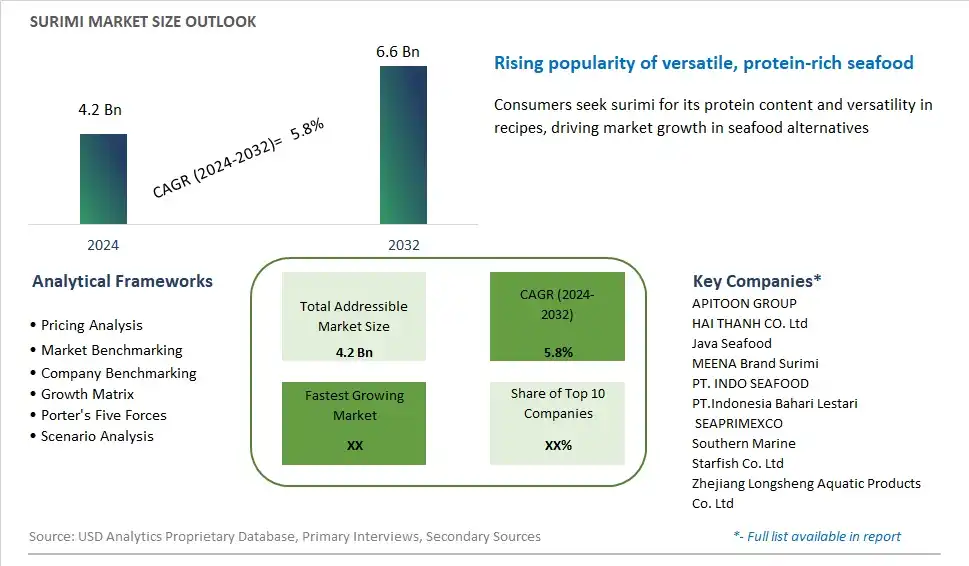
Global Surimi Market Size is valued at $4.2 Billion in 2024 and is forecast to register a growth rate (CAGR) of 5.8% to reach $6.6 Billion by 2032.
The global Surimi Market Comprehensive Study analyzes and forecasts the market size across 6 regions and 24 countries for diverse segments -By Source (Tropical, Cold Water), By Form (Frozen, Fresh), By Distribution Channel (B2B, B2C)
An Introduction to Surimi Market
Surimi, a versatile seafood product made from fish protein, continues to be a staple ingredient in various cuisines worldwide in 2024. Originating from East Asia, surimi is widely used in the production of imitation crab meat, fish cakes, and other seafood analogs due to its mild flavor, firm texture, and ability to absorb flavors and seasonings. With increasing demand for convenient and affordable protein sources, surimi-based products offer a cost-effective alternative to traditional seafood options while providing versatility in culinary applications. As consumer preferences for healthy and sustainable food choices grow, manufacturers are exploring new formulations and processing techniques to enhance the nutritional profile and environmental sustainability of surimi products. From sushi rolls to seafood salads, surimi continues to play a significant role in global cuisines, catering to diverse tastes and dietary preferences.
Surimi Competitive Landscape
The market report analyses the leading companies in the industry including APITOON GROUP, HAI THANH CO. Ltd, Java Seafood, MEENA Brand Surimi, PT. INDO SEAFOOD, PT.Indonesia Bahari Lestari, SEAPRIMEXCO, Southern Marine, Starfish Co. Ltd, Zhejiang Longsheng Aquatic Products Co. Ltd, and Others.
Surimi Market Dynamics
Surimi Market Trend: Growing Popularity of Plant-Based Alternatives
In the surimi market, a prominent trend is the increasing popularity of plant-based alternatives. As consumers become more conscious of their dietary choices and environmental impact, there's a growing demand for seafood substitutes that mimic the taste, texture, and nutritional profile of traditional surimi products. This trend is driving innovation in plant-based surimi formulations, utilizing ingredients such as pea protein, soy protein, konjac, and seaweed to create vegan-friendly alternatives. Plant-based surimi offers a sustainable and cruelty-free option for consumers seeking to reduce their reliance on animal products while still enjoying the versatility and convenience of surimi-based dishes. As a result, manufacturers are expanding their product lines to include plant-based surimi options, catering to the growing segment of flexitarian, vegetarian, and vegan consumers looking for meat-free alternatives that don't compromise on taste or texture.
Market Driver: Health and Wellness Conscious Consumer Preferences
A significant driver influencing the surimi market is the growing emphasis on health and wellness-conscious consumer preferences. Surimi is perceived as a healthy protein source due to its low-fat content, high protein content, and versatility in culinary applications. With an increasing focus on maintaining a balanced diet and active lifestyle, consumers are turning to surimi as a nutritious ingredient for creating wholesome meals and snacks. Additionally, surimi's mild flavor and ability to absorb other flavors make it a versatile ingredient that can be incorporated into a wide range of dishes, including salads, sandwiches, sushi, and soups. The demand for convenient and nutritious food options that support health and wellness goals is thus driving the consumption of surimi-based products, creating opportunities for manufacturers to innovate and diversify their offerings to meet evolving consumer needs.
Market Opportunity: Expansion into New Markets and Applications
An opportunity within the surimi market lies in the expansion into new markets and applications. While surimi is traditionally associated with seafood-based products such as imitation crab sticks and seafood salads, there's potential for diversification into other food categories and culinary applications. Manufacturers can explore opportunities to introduce surimi-based products in segments such as ready-to-eat meals, frozen foods, snacks, and foodservice offerings, catering to different consumer preferences and occasions. Additionally, there's room for innovation in flavor profiles, packaging formats, and product positioning to appeal to a broader audience and differentiate from competitors. By leveraging surimi's versatility and nutritional benefits, manufacturers can tap into new markets, attract new customers, and drive growth in the surimi market beyond its traditional applications.
Surimi Market Share Analysis: Alaska Pollock held the dominant market share in 2024
In the Surimi Market, Alaska Pollock is the largest segment, driven by its abundance, quality, and versatility in surimi production. Alaska Pollock, a species of cold-water fish found in the North Pacific, is renowned for its mild flavor, firm texture, and high protein content, making it an ideal raw material for surimi processing. The extensive fishing grounds and sustainable management practices in Alaska ensure a consistent and reliable supply of Pollock for surimi production year-round. Additionally, Alaska Pollock's favorable gel-forming properties and ability to bind with other ingredients make it a preferred choice for manufacturing various surimi-based products such as imitation crab sticks, fish cakes, and seafood salads. Its widespread availability, cost-effectiveness, and ability to mimic the texture and appearance of premium seafood contribute to its dominance in the Surimi Market, driving market growth and consumer preference.
Surimi Market Share Analysis: Frozen Surimi market is poised to register the fastest growth rae over the forecast period to 2032
In the Surimi Market, the Frozen Surimi segment is the fastest-growing category, propelled by its convenience, extended shelf life, and increasing consumer demand for convenient seafood options. Frozen surimi offers consumers the flexibility to store and use the product at their convenience, without compromising on taste or quality. Additionally, frozen surimi retains its texture, flavor, and nutritional value, making it an attractive choice for consumers seeking convenient and nutritious seafood alternatives. Further, the rise of convenience-driven lifestyles and busy schedules further fuels the demand for frozen surimi products, as they offer quick and easy meal solutions for home cooks and foodservice establishments alike. As a result, the Frozen Surimi segment experiences exponential growth, reshaping the Surimi Market and presenting significant opportunities for manufacturers to innovate and capitalize on evolving consumer preferences.
Surimi Market Share Analysis: Hypermarkets/Supermarkets held the dominant market share in 2024
In the Surimi Market, the Hypermarkets/Supermarkets segment stands as the largest, driven by its extensive reach, wide product assortment, and consumer convenience. Hypermarkets and supermarkets offer a one-stop shopping experience for consumers, providing a diverse selection of surimi-based products alongside other seafood and grocery items. The large retail footprint of hypermarkets and supermarkets, combined with their strategic locations in urban and suburban areas, ensures accessibility to a broad consumer base. Further, these retail channels leverage promotional activities, discounts, and product placement strategies to attract and retain customers, further bolstering their dominance in the Surimi Market. Additionally, the rise of private label brands and consumer preferences for trusted and recognized retail outlets contribute to the strong performance of the Hypermarkets/Supermarkets segment. As a result, it remains at the forefront of distribution channels, shaping consumer purchasing behaviors and driving market growth.
Surimi Market Segmentation
By Source
Tropical
Cold Water
-Alaska Pollock
-Pacific Whiting
-Others
By Form
Frozen
Fresh
By Distribution Channel
B2B
B2C
-Hypermarkets/Supermarkets
-Convenience Stores
-Online
-Others
Countries Analyzed
North America (US, Canada, Mexico)
Europe (Germany, UK, France, Spain, Italy, Russia, Rest of Europe)
Asia Pacific (China, India, Japan, South Korea, Australia, South East Asia, Rest of Asia)
South America (Brazil, Argentina, Rest of South America)
Middle East and Africa (Saudi Arabia, UAE, Rest of Middle East, South Africa, Egypt, Rest of Africa)
Surimi Companies Profiled in the Study
APITOON GROUP
HAI THANH CO. Ltd
Java Seafood
MEENA Brand Surimi
PT. INDO SEAFOOD
PT.Indonesia Bahari Lestari
SEAPRIMEXCO
Southern Marine
Starfish Co. Ltd
Zhejiang Longsheng Aquatic Products Co. Ltd
*- List Not Exhaustive
Chapter 1. TABLE OF CONTENTS
Chapter 2. Introduction to Surimi Market
2.1. Market Overview
2.2. Key Statistics and Report Highlights
2.3. Scope of the Comprehensive Study
2.3.1. Market Definition
2.3.2 Countries and Regions Covered
2.3.3 Research Objective
2.3.4 Units, Currency, and Conversions
2.3.5 Industry Value Chain
2.4. Key Market Segments
2.5. Key Companies
2.6. Study Period
Chapter 3. Strategic Analysis Review
3.1. Surimi Pricing Analysis and Forecast
3.2. Porter’s Five Forces
3.3. Market Ecosystem
3.4. SWOT Analysis
3.5. Regulatory Scenario
3.3. Effects of Inflation, Russia-Ukraine War, moderating economic growth, and other macroeconomic factors
Chapter 4. Competitive Landscape
4.1. Market Share Analysis
4.1.1. Global Surimi Market Share by Company, 2023
4.1.2. Product Offerings of Leading Surimi Companies
4.2. Market Entropy
4.2.1. New Product Launches in the Industry
4.2.2. Mergers, Acquisitions, Joint ventures, and Partnerships
4.3. Key Strategies and Best Practices
Chapter 5. Global Market Projections: Best, Reference, and Low Case Scenarios
5.1. Growth Analysis- Case Scenario Definitions
5.2. Low Growth Case Scenario Forecasts
5.3. Reference Growth Case Scenario Forecasts
5.4. High Growth Case Scenario Forecasts
Chapter 6. Market Dynamics
6.1. Surimi Market Drivers
6.2. Surimi Market Challenges
6.6. Surimi Market Opportunities
6.4. Surimi Market Trends
Chapter 7. Global Surimi Market Outlook Trends
7.1. Global Surimi Revenue (USD Million) and CAGR (%) by Type (2021-2032)
7.2. Global Surimi Revenue (USD Million) and CAGR (%) by Application (2021-2032)
7.3. Global Surimi Revenue (USD Million) and CAGR (%) by Product (2021-2032)
By Source
Tropical
Cold Water
-Alaska Pollock
-Pacific Whiting
-Others
By Form
Frozen
Fresh
By Distribution Channel
B2B
B2C
-Hypermarkets/Supermarkets
-Convenience Stores
-Online
-Others
Chapter 8. Global Surimi Regional Analysis and Outlook
8.1. Global Surimi Revenue (USD Million) By Regions (2021- 2032)
8.2. North America Surimi Revenue (USD Million) by Country (2021-2032)
8.2.1. United States Surimi Regional Analysis and Outlook
8.2.2. Canada Surimi Regional Analysis and Outlook
8.2.3. Mexico Surimi Regional Analysis and Outlook
8.3. Europe Surimi Revenue (USD Million), by Country (2021-2032)
8.3.1. Germany Surimi Regional Analysis and Outlook
8.3.2. France Surimi Regional Analysis and Outlook
8.3.3. United Kingdom Surimi Regional Analysis and Outlook
8.3.4. Spain Surimi Regional Analysis and Outlook
8.3.5. Italy Surimi Regional Analysis and Outlook
8.3.6. Russia Surimi Regional Analysis and Outlook
8.3.7. Rest of Europe Surimi Regional Analysis and Outlook
8.4. Asia Pacific Surimi Revenue (USD Million) by Country (2021-2032)
8.4.1. China Surimi Regional Analysis and Outlook
8.4.2. Japan Surimi Regional Analysis and Outlook
8.4.3. India Surimi Regional Analysis and Outlook
8.4.4. South Korea Surimi Regional Analysis and Outlook
8.4.5. Australia Surimi Regional Analysis and Outlook
8.4.6. South East Asia Surimi Regional Analysis and Outlook
8.4.7. Rest of Asia Pacific Surimi Regional Analysis and Outlook
8.5. South America Surimi Revenue (USD Million), by Country (2021-2032)
8.5.1. Brazil Surimi Regional Analysis and Outlook
8.5.2. Argentina Surimi Regional Analysis and Outlook
8.5.3. Rest of South America Surimi Regional Analysis and Outlook
8.6. Middle East and Africa Surimi Revenue (USD Million) by Country (2021-2032)
8.6.1. Middle East Surimi Regional Analysis and Outlook
8.6.2. Africa Surimi Regional Analysis and Outlook
Chapter 9. North America Surimi Analysis and Outlook
9.1. North America Surimi Revenue (USD Million) by Segments (2021-2032)
9.1.1. North America Surimi Revenue (USD Million) by Type (2021-2032)
9.1.2. North America Surimi Revenue (USD Million) by Application (2021-2032)
9.1.3. North America Surimi Revenue (USD Million) by Product (2021-2032)
By Source
Tropical
Cold Water
-Alaska Pollock
-Pacific Whiting
-Others
By Form
Frozen
Fresh
By Distribution Channel
B2B
B2C
-Hypermarkets/Supermarkets
-Convenience Stores
-Online
-Others
Chapter 10. Europe Surimi Analysis and Outlook
10.1. Europe Surimi Revenue (USD Million), by Segments (USD Million) (2021-2032)
10.1.1. Europe Surimi Revenue (USD Million) by Type (2021-2032)
10.1.2. Europe Surimi Revenue (USD Million) by Application (2021-2032)
10.1.3. Europe Surimi Revenue (USD Million) by Product (2021-2032)
By Source
Tropical
Cold Water
-Alaska Pollock
-Pacific Whiting
-Others
By Form
Frozen
Fresh
By Distribution Channel
B2B
B2C
-Hypermarkets/Supermarkets
-Convenience Stores
-Online
-Others
Chapter 11. Asia Pacific Surimi Analysis and Outlook
11.1. Asia Pacific Surimi Revenue (USD Million), and Revenue (USD Million) by Segments (2021-2032)
11.1.1. Asia Pacific Surimi Revenue (USD Million) by Type (2021-2032)
11.1.2. Asia Pacific Surimi Revenue (USD Million) by Application (2021-2032)
11.1.3. Asia Pacific Surimi Revenue (USD Million) by Product (2021-2032)
By Source
Tropical
Cold Water
-Alaska Pollock
-Pacific Whiting
-Others
By Form
Frozen
Fresh
By Distribution Channel
B2B
B2C
-Hypermarkets/Supermarkets
-Convenience Stores
-Online
-Others
Chapter 12. South America Surimi Analysis and Outlook
12.1. South America Surimi Revenue (USD Million), by Segments (2021-2032)
12.1.1. South America Surimi Revenue (USD Million) by Type (2021-2032)
12.1.2. South America Surimi Revenue (USD Million) by Application (2021-2032)
12.1.3. South America Surimi Revenue (USD Million) by Product (2021-2032)
By Source
Tropical
Cold Water
-Alaska Pollock
-Pacific Whiting
-Others
By Form
Frozen
Fresh
By Distribution Channel
B2B
B2C
-Hypermarkets/Supermarkets
-Convenience Stores
-Online
-Others
Chapter 13. Middle East and Africa Surimi Analysis and Outlook
13.1. Middle East and Africa Surimi Revenue (USD Million), by Segments (2021-2032)
13.1.1. Middle East and Africa Surimi Revenue (USD Million) by Type (2021-2032)
13.1.2. Middle East and Africa Surimi Revenue (USD Million) by Application (2021-2032)
13.1.3. Middle East and Africa Surimi Revenue (USD Million) by Product (2021-2032)
By Source
Tropical
Cold Water
-Alaska Pollock
-Pacific Whiting
-Others
By Form
Frozen
Fresh
By Distribution Channel
B2B
B2C
-Hypermarkets/Supermarkets
-Convenience Stores
-Online
-Others
Chapter 14. Surimi Company Profiles
14.1 Business Overview
14.2 Product Profiles
14.3 SWOT Profiles
14.5 Recent Developments
14.6 Financial Profile
List of Companies
APITOON GROUP
HAI THANH CO. Ltd
Java Seafood
MEENA Brand Surimi
PT. INDO SEAFOOD
PT.Indonesia Bahari Lestari
SEAPRIMEXCO
Southern Marine
Starfish Co. Ltd
Zhejiang Longsheng Aquatic Products Co. Ltd
15. Methodology and Data Sources
15.1 Customization Offerings
15.2 Subscription Services
15.3 Related Reports
15.4 Publisher Expertise
LIST OF TABLES
Table 1 Market Segmentation Analysis
Table 2 Global Surimi Market Share of Leading Companies, 2023
Table 3 Product Offerings of Leading Companies
Table 4 Low Growth Scenario Forecasts
Table 5 Reference Case Growth Scenario
Table 6 High Growth Case Scenario
Table 7 Global Surimi Revenue (USD Million) And CAGR (%) By Type (2021-2032)
Table 8 Global Surimi Revenue (USD Million) And CAGR (%) By Application (2021-2032)
Table 9 Global Surimi Revenue (USD Million) And CAGR (%) By Product (2021-2032)
Table 10 Global Surimi Market Revenue (USD Million) By Regions (2021-2032)
Table 11 Global Surimi Market Share (%) By Regions (2021-2032)
Table 12 North America Surimi Revenue (USD Million) By Country (2021-2032)
Table 13 Europe Surimi Revenue (USD Million) By Country (2021-2032)
Table 14 Asia Pacific Surimi Revenue (USD Million) By Country (2021-2032)
Table 15 South America Surimi Revenue (USD Million) By Country (2021-2032)
Table 16 Middle East and Africa Surimi Revenue (USD Million) By Region (2021-2032)
Table 17 North America Surimi Revenue (USD Million) By Type (2021-2032)
Table 18 North America Surimi Revenue (USD Million) By Application (2021-2032)
Table 19 North America Surimi Revenue (USD Million) By Product (2021-2032)
Table 20 Europe Surimi Revenue (USD Million) By Type (2021-2032)
Table 21 Europe Surimi Revenue (USD Million) By Application (2021-2032)
Table 22 Europe Surimi Revenue (USD Million) By Product (2021-2032)
Table 23 Asia Pacific Surimi Revenue (USD Million) By Type (2021-2032)
Table 24 Asia Pacific Surimi Revenue (USD Million) By Application (2021-2032)
Table 25 Asia Pacific Surimi Revenue (USD Million) By Product (2021-2032)
Table 26 South America Surimi Revenue (USD Million) By Type (2021-2032)
Table 27 South America Surimi Revenue (USD Million) By Application (2021-2032)
Table 28 South America Surimi Revenue (USD Million) By Product (2021-2032)
Table 29 Middle East and Africa Surimi Revenue (USD Million) By Type (2021-2032)
Table 30 Middle East and Africa Surimi Revenue (USD Million) By Application (2021-2032)
Table 31 Middle East and Africa Surimi Revenue (USD Million) By Product (2021-2032)
LIST OF FIGURES
Figure 1. Market Scope
Figure 2. Pricing Forecasts Per Unit, 2023- 2032
Figure 3. Porter’s Five Forces
Figure 4. Global Surimi Market Revenue (USD Million) By Regions (2021-2032)
Figure 5. Global Surimi Market Share (%) By Regions (2023)
Figure 6. North America Surimi Revenue (USD Million) By Country (2021-2032)
Figure 7. United States Surimi Revenue (USD Million) By Country (2021-2032)
Figure 8. Canada Surimi Revenue (USD Million) By Country (2021-2032)
Figure 9. Mexico Surimi Revenue (USD Million) By Country (2021-2032)
Figure 10. Europe Surimi Revenue (USD Million) By Country (2021-2032)
Figure 11. Germany Surimi Revenue (USD Million) By Country (2021-2032)
Figure 12. France Surimi Revenue (USD Million) By Country (2021-2032)
Figure 13. United Kingdom Surimi Revenue (USD Million) By Country (2021-2032)
Figure 14. Spain Surimi Revenue (USD Million) By Country (2021-2032)
Figure 15. Italy Surimi Revenue (USD Million) By Country (2021-2032)
Figure 16. Russia Surimi Revenue (USD Million) By Country (2021-2032)
Figure 17. Rest of Europe Surimi Revenue (USD Million) By Country (2021-2032)
Figure 11. Asia Pacific Surimi Revenue (USD Million) By Country (2021-2032)
Figure 12. China Surimi Revenue (USD Million) By Country (2021-2032)
Figure 13. Japan Surimi Revenue (USD Million) By Country (2021-2032)
Figure 14. India Surimi Revenue (USD Million) By Country (2021-2032)
Figure 15. South Korea Surimi Revenue (USD Million) By Country (2021-2032)
Figure 16. Australia Surimi Revenue (USD Million) By Country (2021-2032)
Figure 17. South East Asia Surimi Revenue (USD Million) By Country (2021-2032)
Figure 18. South America Surimi Revenue (USD Million) By Country (2021-2032)
Figure 19. Brazil Surimi Revenue (USD Million) By Country (2021-2032)
Figure 20. Argentina Surimi Revenue (USD Million) By Country (2021-2032)
Figure 21. Rest of Asia Pacific Surimi Revenue (USD Million) By Country (2021-2032)
Figure 22. Middle East and Africa Surimi Revenue (USD Million) By Region (2021-2032)
Figure 23. Saudi Arabia Surimi Revenue (USD Million) By Region (2021-2032)
Figure 24. The UAE Surimi Revenue (USD Million) By Region (2021-2032)
Figure 25. Rest of Middle East Surimi Revenue (USD Million) By Region (2021-2032)
Figure 26. South Africa Surimi Revenue (USD Million) By Region (2021-2032)
Figure 27. Africa Surimi Revenue (USD Million) By Region (2021-2032)
Figure 28. North America Surimi Revenue (USD Million) By Type (2021-2032)
Figure 29. North America Surimi Revenue (USD Million) By Application (2021-2032)
Figure 30. North America Surimi Revenue (USD Million) By Product (2021-2032)
Figure 31. Europe Surimi Revenue (USD Million) By Type (2021-2032)
Figure 32. Europe Surimi Revenue (USD Million) By Application (2021-2032)
Figure 33. Europe Surimi Revenue (USD Million) By Product (2021-2032)
Figure 34. Asia Pacific Surimi Revenue (USD Million) By Type (2021-2032)
Figure 35. Asia Pacific Surimi Revenue (USD Million) By Application (2021-2032)
Figure 36. Asia Pacific Surimi Revenue (USD Million) By Product (2021-2032)
Figure 37. South America Surimi Revenue (USD Million) By Type (2021-2032)
Figure 38. South America Surimi Revenue (USD Million) By Application (2021-2032)
Figure 39. South America Surimi Revenue (USD Million) By Product (2021-2032)
Figure 40. Middle East and Africa Surimi Revenue (USD Million) By Type (2021-2032)
Figure 41. Middle East and Africa Surimi Revenue (USD Million) By Application (2021-2032)
Figure 42. Middle East and Africa Surimi Revenue (USD Million) By Product (2021-2032)
By Source
Tropical
Cold Water
-Alaska Pollock
-Pacific Whiting
-Others
By Form
Frozen
Fresh
By Distribution Channel
B2B
B2C
-Hypermarkets/Supermarkets
-Convenience Stores
-Online
-Others
Countries Analyzed
North America (US, Canada, Mexico)
Europe (Germany, UK, France, Spain, Italy, Russia, Rest of Europe)
Asia Pacific (China, India, Japan, South Korea, Australia, South East Asia, Rest of Asia)
South America (Brazil, Argentina, Rest of South America)
Middle East and Africa (Saudi Arabia, UAE, Rest of Middle East, South Africa, Egypt, Rest of Africa)
