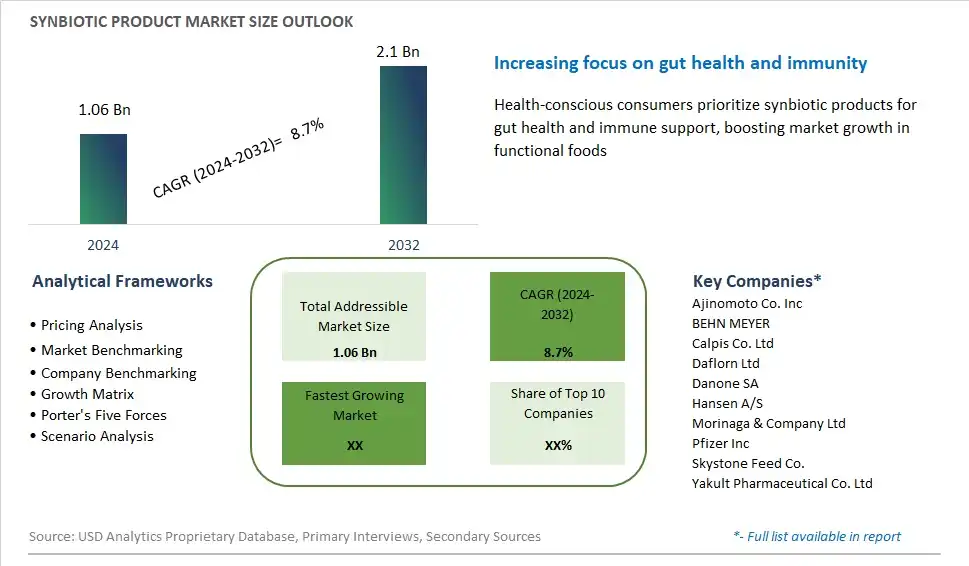
Global Synbiotic Product Market Size is valued at $1.06 Billion in 2024 and is forecast to register a growth rate (CAGR) of 8.7% to reach $2.1 Billion by 2032.
The global Synbiotic Product Market Comprehensive Study analyzes and forecasts the market size across 6 regions and 24 countries for diverse segments -By Form (Powder, Liquid), By Application (Food & Beverages, Pharmaceutical, Dairy, Aquaculture Farming), By End-User (Commercial Use, Personal Use), By Distribution Channel (B2B, B2C)
An Introduction to Synbiotic Product Market
Synbiotic products, which combine probiotics and prebiotics to promote gut health and overall well-being, are gaining traction in the functional foods market in 2024. Probiotics are live microorganisms that confer health benefits when consumed in adequate amounts, while prebiotics are non-digestible fibers that serve as food for beneficial gut bacteria. By combining these two components, synbiotic products aim to enhance the survival and activity of probiotics in the gut, thereby supporting digestive health, immune function, and nutrient absorption. With growing interest in gut microbiota and its impact on health, consumers are seeking synbiotic products in various forms, including yogurt drinks, dietary supplements, and functional foods. As research continues to uncover the potential health benefits of synbiotics, the market is poised for further growth and innovation, offering consumers a holistic approach to maintaining gut health and overall wellness.
Synbiotic Product Competitive Landscape
The market report analyses the leading companies in the industry including Ajinomoto Co. Inc, BEHN MEYER, Calpis Co. Ltd, Daflorn Ltd, Danone SA, Hansen A/S, Morinaga & Company Ltd, Pfizer Inc, Skystone Feed Co., Yakult Pharmaceutical Co. Ltd, and Others.
Synbiotic Product Market Dynamics
Synbiotic Product Market Trend: Increasing Consumer Interest in Gut Health
A prominent trend in the synbiotic product market is the rising consumer interest in gut health. As awareness grows about the importance of maintaining a healthy gut microbiome for overall well-being, there's a corresponding demand for products that support digestive health. Synbiotic products, which combine probiotics and prebiotics to promote a balanced and thriving gut microbiota, are gaining popularity among health-conscious consumers. This trend is fueled by a desire for natural solutions to digestive issues, as well as an increasing understanding of the link between gut health and immunity, mental health, and other aspects of wellness. As a result, manufacturers are developing a variety of synbiotic formulations, including supplements, functional foods, and beverages, to meet the evolving needs and preferences of consumers seeking to optimize their gut health.
Market Driver: Growing Awareness of the Benefits of Probiotics and Prebiotics
A significant driver shaping the synbiotic product market is the growing awareness of the benefits of probiotics and prebiotics. Scientific research continues to uncover the role of these beneficial microorganisms and dietary fibers in supporting digestive health, immune function, and overall wellness. Consumers are increasingly seeking products that contain probiotics to introduce beneficial bacteria into the gut and prebiotics to nourish and stimulate their growth. This heightened awareness of the symbiotic relationship between probiotics and prebiotics is driving the demand for synbiotic products that offer a comprehensive approach to gut health support. Furthermore, endorsements from healthcare professionals and influencers, as well as positive word-of-mouth testimonials, are further driving consumer interest and adoption of synbiotic products, fueling market growth and innovation in the segment.
Market Opportunity: Personalized Nutrition and Targeted Formulations
An opportunity within the synbiotic product market lies in personalized nutrition and targeted formulations. While there is a growing demand for synbiotic products as a whole, there's also a need for tailored solutions that address specific digestive health concerns and meet individual preferences and dietary restrictions. Manufacturers can capitalize on this opportunity by developing specialized synbiotic formulations designed for different consumer demographics, such as infants, children, adults, seniors, and individuals with specific health conditions like irritable bowel syndrome (IBS) or inflammatory bowel disease (IBD). Additionally, there's potential for innovation in delivery formats, such as chewable tablets, powders, capsules, and ready-to-drink beverages, to enhance convenience and compliance for consumers. By offering personalized and targeted synbiotic solutions, manufacturers can differentiate their products, strengthen brand loyalty, and capture a larger share of the growing market for gut health supplements and functional foods.
Synbiotic Product Market Share Analysis: Powder held the dominant market share in 2024
In the Synbiotic Product Market, the Powder segment is the largest, driven by its convenience, stability, and ease of consumption. Powdered synbiotic products offer consumers the flexibility to mix the supplement into various beverages and foods, providing a seamless integration into their daily routines. Additionally, powdered formulations ensure the stability and viability of probiotics and prebiotics, preserving their beneficial effects throughout storage and consumption. The powdered form also allows for precise dosing and customization, catering to individual preferences and dosage requirements. Further, powdered synbiotic products are favored by manufacturers for their cost-effectiveness and versatility in formulation, further contributing to the dominance of the Powder segment in the Synbiotic Product Market. As a result, it remains the preferred choice for consumers seeking digestive health benefits and overall wellness support.
Synbiotic Product Market Share Analysis: Food & Beverages market is poised to register the fastest growth rae over the forecast period to 2032
In the Synbiotic Product Market, the Food & Beverages segment is the fastest-growing category, propelled by the increasing consumer awareness of gut health and the growing demand for functional foods and beverages. Synbiotic ingredients, combining probiotics and prebiotics, offer consumers a convenient and effective way to support digestive health and overall well-being. Manufacturers are innovating by incorporating synbiotics into a wide range of food and beverage products, including yogurt, milk, cereal bars, and beverages, to meet the rising demand for gut-friendly options. Additionally, the Food & Beverages segment benefits from the versatility of synbiotics, as they can be seamlessly integrated into existing recipes without compromising taste or texture. Further, the expansion of distribution channels and marketing efforts to promote the health benefits of synbiotics further fuel the growth of this segment. As a result, the Food & Beverages segment experiences exponential growth, reshaping the Synbiotic Product Market and offering significant opportunities for market expansion and innovation.
Synbiotic Product Market Share Analysis: Personal Use held the dominant market share in 2024
In the Synbiotic Product Market, the Personal Use segment is the largest, driven by the growing consumer awareness of gut health and the increasing demand for dietary supplements to support overall well-being. Individuals are increasingly incorporating synbiotic products into their daily routines to maintain a healthy gut microbiome, boost immunity, and improve digestive health. The convenience of over-the-counter availability and the variety of formulations cater to consumers' diverse needs and preferences. Further, the rise of e-commerce platforms and direct-to-consumer channels allows for easy access to synbiotic supplements, further fueling the growth of the Personal Use segment. Additionally, the expanding aging population and rising prevalence of digestive disorders contribute to the segment's dominance in the market. As a result, Personal Use remains the preferred choice for consumers seeking proactive measures to support their health and wellness through synbiotic supplementation.
Synbiotic Product Market Segmentation
By Form
Powder
Liquid
By Application
Food & Beverages
Pharmaceutical
Dairy
Aquaculture Farming
By End-User
Commercial Use
Personal Use
By Distribution Channel
B2B
B2C
Countries Analyzed
North America (US, Canada, Mexico)
Europe (Germany, UK, France, Spain, Italy, Russia, Rest of Europe)
Asia Pacific (China, India, Japan, South Korea, Australia, South East Asia, Rest of Asia)
South America (Brazil, Argentina, Rest of South America)
Middle East and Africa (Saudi Arabia, UAE, Rest of Middle East, South Africa, Egypt, Rest of Africa)
Synbiotic Product Companies Profiled in the Study
Ajinomoto Co. Inc
BEHN MEYER
Calpis Co. Ltd
Daflorn Ltd
Danone SA
Hansen A/S
Morinaga & Company Ltd
Pfizer Inc
Skystone Feed Co.
Yakult Pharmaceutical Co. Ltd
*- List Not Exhaustive
Chapter 1. TABLE OF CONTENTS
Chapter 2. Introduction to Synbiotic Product Market
2.1. Market Overview
2.2. Key Statistics and Report Highlights
2.3. Scope of the Comprehensive Study
2.3.1. Market Definition
2.3.2 Countries and Regions Covered
2.3.3 Research Objective
2.3.4 Units, Currency, and Conversions
2.3.5 Industry Value Chain
2.4. Key Market Segments
2.5. Key Companies
2.6. Study Period
Chapter 3. Strategic Analysis Review
3.1. Synbiotic Product Pricing Analysis and Forecast
3.2. Porter’s Five Forces
3.3. Market Ecosystem
3.4. SWOT Analysis
3.5. Regulatory Scenario
3.3. Effects of Inflation, Russia-Ukraine War, moderating economic growth, and other macroeconomic factors
Chapter 4. Competitive Landscape
4.1. Market Share Analysis
4.1.1. Global Synbiotic Product Market Share by Company, 2023
4.1.2. Product Offerings of Leading Synbiotic Product Companies
4.2. Market Entropy
4.2.1. New Product Launches in the Industry
4.2.2. Mergers, Acquisitions, Joint ventures, and Partnerships
4.3. Key Strategies and Best Practices
Chapter 5. Global Market Projections: Best, Reference, and Low Case Scenarios
5.1. Growth Analysis- Case Scenario Definitions
5.2. Low Growth Case Scenario Forecasts
5.3. Reference Growth Case Scenario Forecasts
5.4. High Growth Case Scenario Forecasts
Chapter 6. Market Dynamics
6.1. Synbiotic Product Market Drivers
6.2. Synbiotic Product Market Challenges
6.6. Synbiotic Product Market Opportunities
6.4. Synbiotic Product Market Trends
Chapter 7. Global Synbiotic Product Market Outlook Trends
7.1. Global Synbiotic Product Revenue (USD Million) and CAGR (%) by Type (2021-2032)
7.2. Global Synbiotic Product Revenue (USD Million) and CAGR (%) by Application (2021-2032)
7.3. Global Synbiotic Product Revenue (USD Million) and CAGR (%) by Product (2021-2032)
By Form
Powder
Liquid
By Application
Food & Beverages
Pharmaceutical
Dairy
Aquaculture Farming
By End-User
Commercial Use
Personal Use
By Distribution Channel
B2B
B2C
Chapter 8. Global Synbiotic Product Regional Analysis and Outlook
8.1. Global Synbiotic Product Revenue (USD Million) By Regions (2021- 2032)
8.2. North America Synbiotic Product Revenue (USD Million) by Country (2021-2032)
8.2.1. United States Synbiotic Product Regional Analysis and Outlook
8.2.2. Canada Synbiotic Product Regional Analysis and Outlook
8.2.3. Mexico Synbiotic Product Regional Analysis and Outlook
8.3. Europe Synbiotic Product Revenue (USD Million), by Country (2021-2032)
8.3.1. Germany Synbiotic Product Regional Analysis and Outlook
8.3.2. France Synbiotic Product Regional Analysis and Outlook
8.3.3. United Kingdom Synbiotic Product Regional Analysis and Outlook
8.3.4. Spain Synbiotic Product Regional Analysis and Outlook
8.3.5. Italy Synbiotic Product Regional Analysis and Outlook
8.3.6. Russia Synbiotic Product Regional Analysis and Outlook
8.3.7. Rest of Europe Synbiotic Product Regional Analysis and Outlook
8.4. Asia Pacific Synbiotic Product Revenue (USD Million) by Country (2021-2032)
8.4.1. China Synbiotic Product Regional Analysis and Outlook
8.4.2. Japan Synbiotic Product Regional Analysis and Outlook
8.4.3. India Synbiotic Product Regional Analysis and Outlook
8.4.4. South Korea Synbiotic Product Regional Analysis and Outlook
8.4.5. Australia Synbiotic Product Regional Analysis and Outlook
8.4.6. South East Asia Synbiotic Product Regional Analysis and Outlook
8.4.7. Rest of Asia Pacific Synbiotic Product Regional Analysis and Outlook
8.5. South America Synbiotic Product Revenue (USD Million), by Country (2021-2032)
8.5.1. Brazil Synbiotic Product Regional Analysis and Outlook
8.5.2. Argentina Synbiotic Product Regional Analysis and Outlook
8.5.3. Rest of South America Synbiotic Product Regional Analysis and Outlook
8.6. Middle East and Africa Synbiotic Product Revenue (USD Million) by Country (2021-2032)
8.6.1. Middle East Synbiotic Product Regional Analysis and Outlook
8.6.2. Africa Synbiotic Product Regional Analysis and Outlook
Chapter 9. North America Synbiotic Product Analysis and Outlook
9.1. North America Synbiotic Product Revenue (USD Million) by Segments (2021-2032)
9.1.1. North America Synbiotic Product Revenue (USD Million) by Type (2021-2032)
9.1.2. North America Synbiotic Product Revenue (USD Million) by Application (2021-2032)
9.1.3. North America Synbiotic Product Revenue (USD Million) by Product (2021-2032)
By Form
Powder
Liquid
By Application
Food & Beverages
Pharmaceutical
Dairy
Aquaculture Farming
By End-User
Commercial Use
Personal Use
By Distribution Channel
B2B
B2C
Chapter 10. Europe Synbiotic Product Analysis and Outlook
10.1. Europe Synbiotic Product Revenue (USD Million), by Segments (USD Million) (2021-2032)
10.1.1. Europe Synbiotic Product Revenue (USD Million) by Type (2021-2032)
10.1.2. Europe Synbiotic Product Revenue (USD Million) by Application (2021-2032)
10.1.3. Europe Synbiotic Product Revenue (USD Million) by Product (2021-2032)
By Form
Powder
Liquid
By Application
Food & Beverages
Pharmaceutical
Dairy
Aquaculture Farming
By End-User
Commercial Use
Personal Use
By Distribution Channel
B2B
B2C
Chapter 11. Asia Pacific Synbiotic Product Analysis and Outlook
11.1. Asia Pacific Synbiotic Product Revenue (USD Million), and Revenue (USD Million) by Segments (2021-2032)
11.1.1. Asia Pacific Synbiotic Product Revenue (USD Million) by Type (2021-2032)
11.1.2. Asia Pacific Synbiotic Product Revenue (USD Million) by Application (2021-2032)
11.1.3. Asia Pacific Synbiotic Product Revenue (USD Million) by Product (2021-2032)
By Form
Powder
Liquid
By Application
Food & Beverages
Pharmaceutical
Dairy
Aquaculture Farming
By End-User
Commercial Use
Personal Use
By Distribution Channel
B2B
B2C
Chapter 12. South America Synbiotic Product Analysis and Outlook
12.1. South America Synbiotic Product Revenue (USD Million), by Segments (2021-2032)
12.1.1. South America Synbiotic Product Revenue (USD Million) by Type (2021-2032)
12.1.2. South America Synbiotic Product Revenue (USD Million) by Application (2021-2032)
12.1.3. South America Synbiotic Product Revenue (USD Million) by Product (2021-2032)
By Form
Powder
Liquid
By Application
Food & Beverages
Pharmaceutical
Dairy
Aquaculture Farming
By End-User
Commercial Use
Personal Use
By Distribution Channel
B2B
B2C
Chapter 13. Middle East and Africa Synbiotic Product Analysis and Outlook
13.1. Middle East and Africa Synbiotic Product Revenue (USD Million), by Segments (2021-2032)
13.1.1. Middle East and Africa Synbiotic Product Revenue (USD Million) by Type (2021-2032)
13.1.2. Middle East and Africa Synbiotic Product Revenue (USD Million) by Application (2021-2032)
13.1.3. Middle East and Africa Synbiotic Product Revenue (USD Million) by Product (2021-2032)
By Form
Powder
Liquid
By Application
Food & Beverages
Pharmaceutical
Dairy
Aquaculture Farming
By End-User
Commercial Use
Personal Use
By Distribution Channel
B2B
B2C
Chapter 14. Synbiotic Product Company Profiles
14.1 Business Overview
14.2 Product Profiles
14.3 SWOT Profiles
14.5 Recent Developments
14.6 Financial Profile
List of Companies
Ajinomoto Co. Inc
BEHN MEYER
Calpis Co. Ltd
Daflorn Ltd
Danone SA
Hansen A/S
Morinaga & Company Ltd
Pfizer Inc
Skystone Feed Co.
Yakult Pharmaceutical Co. Ltd
15. Methodology and Data Sources
15.1 Customization Offerings
15.2 Subscription Services
15.3 Related Reports
15.4 Publisher Expertise
LIST OF TABLES
Table 1 Market Segmentation Analysis
Table 2 Global Synbiotic Product Market Share of Leading Companies, 2023
Table 3 Product Offerings of Leading Companies
Table 4 Low Growth Scenario Forecasts
Table 5 Reference Case Growth Scenario
Table 6 High Growth Case Scenario
Table 7 Global Synbiotic Product Revenue (USD Million) And CAGR (%) By Type (2021-2032)
Table 8 Global Synbiotic Product Revenue (USD Million) And CAGR (%) By Application (2021-2032)
Table 9 Global Synbiotic Product Revenue (USD Million) And CAGR (%) By Product (2021-2032)
Table 10 Global Synbiotic Product Market Revenue (USD Million) By Regions (2021-2032)
Table 11 Global Synbiotic Product Market Share (%) By Regions (2021-2032)
Table 12 North America Synbiotic Product Revenue (USD Million) By Country (2021-2032)
Table 13 Europe Synbiotic Product Revenue (USD Million) By Country (2021-2032)
Table 14 Asia Pacific Synbiotic Product Revenue (USD Million) By Country (2021-2032)
Table 15 South America Synbiotic Product Revenue (USD Million) By Country (2021-2032)
Table 16 Middle East and Africa Synbiotic Product Revenue (USD Million) By Region (2021-2032)
Table 17 North America Synbiotic Product Revenue (USD Million) By Type (2021-2032)
Table 18 North America Synbiotic Product Revenue (USD Million) By Application (2021-2032)
Table 19 North America Synbiotic Product Revenue (USD Million) By Product (2021-2032)
Table 20 Europe Synbiotic Product Revenue (USD Million) By Type (2021-2032)
Table 21 Europe Synbiotic Product Revenue (USD Million) By Application (2021-2032)
Table 22 Europe Synbiotic Product Revenue (USD Million) By Product (2021-2032)
Table 23 Asia Pacific Synbiotic Product Revenue (USD Million) By Type (2021-2032)
Table 24 Asia Pacific Synbiotic Product Revenue (USD Million) By Application (2021-2032)
Table 25 Asia Pacific Synbiotic Product Revenue (USD Million) By Product (2021-2032)
Table 26 South America Synbiotic Product Revenue (USD Million) By Type (2021-2032)
Table 27 South America Synbiotic Product Revenue (USD Million) By Application (2021-2032)
Table 28 South America Synbiotic Product Revenue (USD Million) By Product (2021-2032)
Table 29 Middle East and Africa Synbiotic Product Revenue (USD Million) By Type (2021-2032)
Table 30 Middle East and Africa Synbiotic Product Revenue (USD Million) By Application (2021-2032)
Table 31 Middle East and Africa Synbiotic Product Revenue (USD Million) By Product (2021-2032)
LIST OF FIGURES
Figure 1. Market Scope
Figure 2. Pricing Forecasts Per Unit, 2023- 2032
Figure 3. Porter’s Five Forces
Figure 4. Global Synbiotic Product Market Revenue (USD Million) By Regions (2021-2032)
Figure 5. Global Synbiotic Product Market Share (%) By Regions (2023)
Figure 6. North America Synbiotic Product Revenue (USD Million) By Country (2021-2032)
Figure 7. United States Synbiotic Product Revenue (USD Million) By Country (2021-2032)
Figure 8. Canada Synbiotic Product Revenue (USD Million) By Country (2021-2032)
Figure 9. Mexico Synbiotic Product Revenue (USD Million) By Country (2021-2032)
Figure 10. Europe Synbiotic Product Revenue (USD Million) By Country (2021-2032)
Figure 11. Germany Synbiotic Product Revenue (USD Million) By Country (2021-2032)
Figure 12. France Synbiotic Product Revenue (USD Million) By Country (2021-2032)
Figure 13. United Kingdom Synbiotic Product Revenue (USD Million) By Country (2021-2032)
Figure 14. Spain Synbiotic Product Revenue (USD Million) By Country (2021-2032)
Figure 15. Italy Synbiotic Product Revenue (USD Million) By Country (2021-2032)
Figure 16. Russia Synbiotic Product Revenue (USD Million) By Country (2021-2032)
Figure 17. Rest of Europe Synbiotic Product Revenue (USD Million) By Country (2021-2032)
Figure 11. Asia Pacific Synbiotic Product Revenue (USD Million) By Country (2021-2032)
Figure 12. China Synbiotic Product Revenue (USD Million) By Country (2021-2032)
Figure 13. Japan Synbiotic Product Revenue (USD Million) By Country (2021-2032)
Figure 14. India Synbiotic Product Revenue (USD Million) By Country (2021-2032)
Figure 15. South Korea Synbiotic Product Revenue (USD Million) By Country (2021-2032)
Figure 16. Australia Synbiotic Product Revenue (USD Million) By Country (2021-2032)
Figure 17. South East Asia Synbiotic Product Revenue (USD Million) By Country (2021-2032)
Figure 18. South America Synbiotic Product Revenue (USD Million) By Country (2021-2032)
Figure 19. Brazil Synbiotic Product Revenue (USD Million) By Country (2021-2032)
Figure 20. Argentina Synbiotic Product Revenue (USD Million) By Country (2021-2032)
Figure 21. Rest of Asia Pacific Synbiotic Product Revenue (USD Million) By Country (2021-2032)
Figure 22. Middle East and Africa Synbiotic Product Revenue (USD Million) By Region (2021-2032)
Figure 23. Saudi Arabia Synbiotic Product Revenue (USD Million) By Region (2021-2032)
Figure 24. The UAE Synbiotic Product Revenue (USD Million) By Region (2021-2032)
Figure 25. Rest of Middle East Synbiotic Product Revenue (USD Million) By Region (2021-2032)
Figure 26. South Africa Synbiotic Product Revenue (USD Million) By Region (2021-2032)
Figure 27. Africa Synbiotic Product Revenue (USD Million) By Region (2021-2032)
Figure 28. North America Synbiotic Product Revenue (USD Million) By Type (2021-2032)
Figure 29. North America Synbiotic Product Revenue (USD Million) By Application (2021-2032)
Figure 30. North America Synbiotic Product Revenue (USD Million) By Product (2021-2032)
Figure 31. Europe Synbiotic Product Revenue (USD Million) By Type (2021-2032)
Figure 32. Europe Synbiotic Product Revenue (USD Million) By Application (2021-2032)
Figure 33. Europe Synbiotic Product Revenue (USD Million) By Product (2021-2032)
Figure 34. Asia Pacific Synbiotic Product Revenue (USD Million) By Type (2021-2032)
Figure 35. Asia Pacific Synbiotic Product Revenue (USD Million) By Application (2021-2032)
Figure 36. Asia Pacific Synbiotic Product Revenue (USD Million) By Product (2021-2032)
Figure 37. South America Synbiotic Product Revenue (USD Million) By Type (2021-2032)
Figure 38. South America Synbiotic Product Revenue (USD Million) By Application (2021-2032)
Figure 39. South America Synbiotic Product Revenue (USD Million) By Product (2021-2032)
Figure 40. Middle East and Africa Synbiotic Product Revenue (USD Million) By Type (2021-2032)
Figure 41. Middle East and Africa Synbiotic Product Revenue (USD Million) By Application (2021-2032)
Figure 42. Middle East and Africa Synbiotic Product Revenue (USD Million) By Product (2021-2032)
By Form
Powder
Liquid
By Application
Food & Beverages
Pharmaceutical
Dairy
Aquaculture Farming
By End-User
Commercial Use
Personal Use
By Distribution Channel
B2B
B2C
Countries Analyzed
North America (US, Canada, Mexico)
Europe (Germany, UK, France, Spain, Italy, Russia, Rest of Europe)
Asia Pacific (China, India, Japan, South Korea, Australia, South East Asia, Rest of Asia)
South America (Brazil, Argentina, Rest of South America)
Middle East and Africa (Saudi Arabia, UAE, Rest of Middle East, South Africa, Egypt, Rest of Africa)
