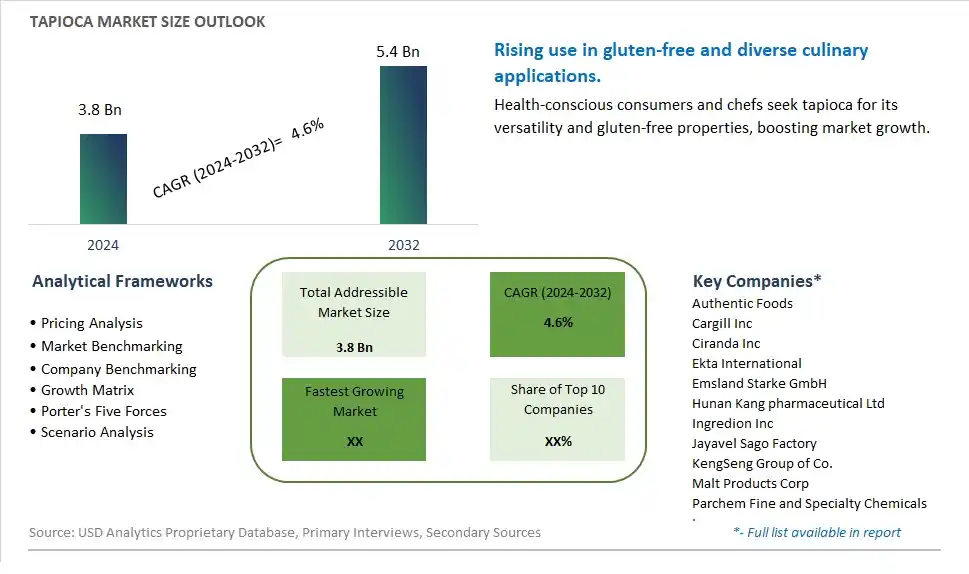
Global Tapioca Market Size is valued at $3.8 Billion in 2024 and is forecast to register a growth rate (CAGR) of 4.6% to reach $5.4 Billion by 2032.
The global Tapioca Market Comprehensive Study analyzes and forecasts the market size across 6 regions and 24 countries for diverse segments -By Type (Fresh, Dried), By Application (Animal feed, Food and beverage, Industrial)
An Introduction to Tapioca Market
In 2024, the tapioca market is witnessing growth driven by its versatile applications in the food and beverage industry. Tapioca, derived from the cassava root, is valued for its neutral flavor, gluten-free properties, and high starch content, making it a popular ingredient in various culinary applications. The market is benefiting from the rising demand for gluten-free and plant-based foods, with tapioca being used in products such as puddings, beverages, baked goods, and snacks. The increasing popularity of bubble tea, which uses tapioca pearls, is also contributing to market growth. Additionally, tapioca starch is used as a thickening and binding agent in various food products, enhancing texture and stability. The clean label trend and consumer preference for natural ingredients are further driving demand for tapioca-based products. As the food industry continues to innovate and cater to health-conscious consumers, the tapioca market is set for steady growth.
Tapioca Competitive Landscape
The market report analyses the leading companies in the industry including Authentic Foods, Cargill Inc, Ciranda Inc, Ekta International, Emsland Starke GmbH, Hunan Kang pharmaceutical Ltd, Ingredion Inc, Jayavel Sago Factory, KengSeng Group of Co., Malt Products Corp, Parchem Fine and Specialty Chemicals Inc, PT Budi Starch and Sweetener Tbk, Royal Ingredients Group BV, Sonish Starch Technology Co. Ltd, SPAC Starch Products India Pvt. Ltd, and Others.
Tapioca Market Dynamics
Tapioca Market Trend: Rising Demand for Gluten-Free and Allergen-Free Foods
One prominent market trend in the tapioca industry is the rising demand for gluten-free and allergen-free foods. As awareness of food sensitivities and intolerances increases, consumers are seeking alternative ingredients like tapioca that are naturally free from gluten and common allergens such as wheat, nuts, and dairy. This trend is driven by a growing number of individuals diagnosed with celiac disease, gluten sensitivity, and food allergies, as well as a broader consumer interest in health-conscious and clean label products. Manufacturers are responding to this trend by incorporating tapioca into a variety of food products, including baked goods, snacks, and beverages, to cater to the needs of gluten-free and allergen-sensitive consumers.
Market Driver: Expansion of Vegan and Plant-Based Diets
A key market driver for tapioca is the expansion of vegan and plant-based diets. With the increasing adoption of vegetarianism, veganism, and flexitarianism worldwide, there is a growing demand for plant-derived ingredients like tapioca that can serve as alternatives to animal products. This driver is reinforced by consumers' concerns about sustainability, animal welfare, and personal health, driving them to choose plant-based options for their diets. Additionally, tapioca's versatility, neutral flavor profile, and unique texture make it a popular choice for plant-based food products such as dairy alternatives, meat substitutes, and egg replacers. As a result, manufacturers are incorporating tapioca into a wide range of plant-based food formulations to meet the needs of vegan and vegetarian consumers and capitalize on the growing demand for plant-powered foods.
Market Opportunity: Innovation in Functional and Specialty Tapioca Products
The growing demand for tapioca presents a significant opportunity for innovation in functional and specialty tapioca products. Manufacturers can capitalize on this trend by developing tapioca-based products that offer additional health benefits, unique flavor profiles, and enhanced nutritional value. This opportunity includes introducing functional tapioca ingredients such as tapioca fiber, resistant starch, and prebiotics that contribute to digestive health, satiety, and blood sugar management. Additionally, there is potential for innovation in specialty tapioca products such as artisanal tapioca snacks, gourmet desserts, and ethnic cuisine-inspired dishes that appeal to adventurous food enthusiasts and culinary enthusiasts. Furthermore, there is opportunity for collaboration with nutritionists, food scientists, and chefs to create innovative tapioca-based recipes and formulations that cater to specific dietary preferences, wellness goals, and flavor experiences. By embracing innovation in functional and specialty tapioca products, stakeholders in the tapioca market can differentiate their offerings, capture new market segments, and meet the evolving needs of health-conscious and adventurous consumers.
Tapioca Market Share Analysis: Dried held the dominant market share in 2024
Within the tapioca market, the dried tapioca segment stands as the largest, driven by several pivotal factors. Dried tapioca, also known as tapioca pearls or tapioca starch, is a versatile ingredient widely used in various culinary applications worldwide. Its extended shelf life and convenience in storage and transportation make it a preferred choice for manufacturers, distributors, and consumers alike. Additionally, dried tapioca serves as a staple ingredient in numerous dishes, desserts, and beverages, contributing to its widespread consumption and demand. Further, the growing popularity of tapioca-based products, such as bubble tea and tapioca pudding, further boosts the sales of dried tapioca. As consumers continue to embrace tapioca as a versatile and gluten-free alternative, the dried tapioca segment maintains its dominance as the largest in the tapioca market.
Tapioca Market Share Analysis: Food and Beverage market is poised to register the fastest growth rae over the forecast period to 2032
Among the applications in the tapioca market, the food and beverage segment is the fastest-growing, driven by several key factors. Tapioca is increasingly valued by food and beverage manufacturers for its versatile properties and gluten-free nature, catering to the dietary preferences of a growing consumer base. Tapioca starch, pearls, and flour serve as key ingredients in a wide range of products, including snacks, desserts, baked goods, noodles, and beverages like bubble tea. Further, the rising demand for natural and plant-based ingredients in the food and beverage industry propels the adoption of tapioca as a functional ingredient and texturizer. Additionally, the versatility of tapioca allows for innovation and product differentiation, enabling manufacturers to capitalize on evolving consumer trends and preferences. As consumer awareness of tapioca-based products continues to grow and the demand for gluten-free alternatives rises, the food and beverage segment emerges as a pivotal driver of rapid growth in the tapioca market, reshaping the landscape of food manufacturing and consumption.
Tapioca Market Segmentation
By Type
Fresh
Dried
By Application
Animal feed
Food and beverage
Industrial
Countries Analyzed
North America (US, Canada, Mexico)
Europe (Germany, UK, France, Spain, Italy, Russia, Rest of Europe)
Asia Pacific (China, India, Japan, South Korea, Australia, South East Asia, Rest of Asia)
South America (Brazil, Argentina, Rest of South America)
Middle East and Africa (Saudi Arabia, UAE, Rest of Middle East, South Africa, Egypt, Rest of Africa)
Tapioca Companies Profiled in the Study
Authentic Foods
Cargill Inc
Ciranda Inc
Ekta International
Emsland Starke GmbH
Hunan Kang pharmaceutical Ltd
Ingredion Inc
Jayavel Sago Factory
KengSeng Group of Co.
Malt Products Corp
Parchem Fine and Specialty Chemicals Inc
PT Budi Starch and Sweetener Tbk
Royal Ingredients Group BV
Sonish Starch Technology Co. Ltd
SPAC Starch Products India Pvt. Ltd
*- List Not Exhaustive
Chapter 1. TABLE OF CONTENTS
Chapter 2. Introduction to Tapioca Market
2.1. Market Overview
2.2. Key Statistics and Report Highlights
2.3. Scope of the Comprehensive Study
2.3.1. Market Definition
2.3.2 Countries and Regions Covered
2.3.3 Research Objective
2.3.4 Units, Currency, and Conversions
2.3.5 Industry Value Chain
2.4. Key Market Segments
2.5. Key Companies
2.6. Study Period
Chapter 3. Strategic Analysis Review
3.1. Tapioca Pricing Analysis and Forecast
3.2. Porter’s Five Forces
3.3. Market Ecosystem
3.4. SWOT Analysis
3.5. Regulatory Scenario
3.3. Effects of Inflation, Russia-Ukraine War, moderating economic growth, and other macroeconomic factors
Chapter 4. Competitive Landscape
4.1. Market Share Analysis
4.1.1. Global Tapioca Market Share by Company, 2023
4.1.2. Product Offerings of Leading Tapioca Companies
4.2. Market Entropy
4.2.1. New Product Launches in the Industry
4.2.2. Mergers, Acquisitions, Joint ventures, and Partnerships
4.3. Key Strategies and Best Practices
Chapter 5. Global Market Projections: Best, Reference, and Low Case Scenarios
5.1. Growth Analysis- Case Scenario Definitions
5.2. Low Growth Case Scenario Forecasts
5.3. Reference Growth Case Scenario Forecasts
5.4. High Growth Case Scenario Forecasts
Chapter 6. Market Dynamics
6.1. Tapioca Market Drivers
6.2. Tapioca Market Challenges
6.6. Tapioca Market Opportunities
6.4. Tapioca Market Trends
Chapter 7. Global Tapioca Market Outlook Trends
7.1. Global Tapioca Revenue (USD Million) and CAGR (%) by Type (2021-2032)
7.2. Global Tapioca Revenue (USD Million) and CAGR (%) by Application (2021-2032)
7.3. Global Tapioca Revenue (USD Million) and CAGR (%) by Product (2021-2032)
By Type
Fresh
Dried
By Application
Animal feed
Food and beverage
Industrial
Chapter 8. Global Tapioca Regional Analysis and Outlook
8.1. Global Tapioca Revenue (USD Million) By Regions (2021- 2032)
8.2. North America Tapioca Revenue (USD Million) by Country (2021-2032)
8.2.1. United States Tapioca Regional Analysis and Outlook
8.2.2. Canada Tapioca Regional Analysis and Outlook
8.2.3. Mexico Tapioca Regional Analysis and Outlook
8.3. Europe Tapioca Revenue (USD Million), by Country (2021-2032)
8.3.1. Germany Tapioca Regional Analysis and Outlook
8.3.2. France Tapioca Regional Analysis and Outlook
8.3.3. United Kingdom Tapioca Regional Analysis and Outlook
8.3.4. Spain Tapioca Regional Analysis and Outlook
8.3.5. Italy Tapioca Regional Analysis and Outlook
8.3.6. Russia Tapioca Regional Analysis and Outlook
8.3.7. Rest of Europe Tapioca Regional Analysis and Outlook
8.4. Asia Pacific Tapioca Revenue (USD Million) by Country (2021-2032)
8.4.1. China Tapioca Regional Analysis and Outlook
8.4.2. Japan Tapioca Regional Analysis and Outlook
8.4.3. India Tapioca Regional Analysis and Outlook
8.4.4. South Korea Tapioca Regional Analysis and Outlook
8.4.5. Australia Tapioca Regional Analysis and Outlook
8.4.6. South East Asia Tapioca Regional Analysis and Outlook
8.4.7. Rest of Asia Pacific Tapioca Regional Analysis and Outlook
8.5. South America Tapioca Revenue (USD Million), by Country (2021-2032)
8.5.1. Brazil Tapioca Regional Analysis and Outlook
8.5.2. Argentina Tapioca Regional Analysis and Outlook
8.5.3. Rest of South America Tapioca Regional Analysis and Outlook
8.6. Middle East and Africa Tapioca Revenue (USD Million) by Country (2021-2032)
8.6.1. Middle East Tapioca Regional Analysis and Outlook
8.6.2. Africa Tapioca Regional Analysis and Outlook
Chapter 9. North America Tapioca Analysis and Outlook
9.1. North America Tapioca Revenue (USD Million) by Segments (2021-2032)
9.1.1. North America Tapioca Revenue (USD Million) by Type (2021-2032)
9.1.2. North America Tapioca Revenue (USD Million) by Application (2021-2032)
9.1.3. North America Tapioca Revenue (USD Million) by Product (2021-2032)
By Type
Fresh
Dried
By Application
Animal feed
Food and beverage
Industrial
Chapter 10. Europe Tapioca Analysis and Outlook
10.1. Europe Tapioca Revenue (USD Million), by Segments (USD Million) (2021-2032)
10.1.1. Europe Tapioca Revenue (USD Million) by Type (2021-2032)
10.1.2. Europe Tapioca Revenue (USD Million) by Application (2021-2032)
10.1.3. Europe Tapioca Revenue (USD Million) by Product (2021-2032)
By Type
Fresh
Dried
By Application
Animal feed
Food and beverage
Industrial
Chapter 11. Asia Pacific Tapioca Analysis and Outlook
11.1. Asia Pacific Tapioca Revenue (USD Million), and Revenue (USD Million) by Segments (2021-2032)
11.1.1. Asia Pacific Tapioca Revenue (USD Million) by Type (2021-2032)
11.1.2. Asia Pacific Tapioca Revenue (USD Million) by Application (2021-2032)
11.1.3. Asia Pacific Tapioca Revenue (USD Million) by Product (2021-2032)
By Type
Fresh
Dried
By Application
Animal feed
Food and beverage
Industrial
Chapter 12. South America Tapioca Analysis and Outlook
12.1. South America Tapioca Revenue (USD Million), by Segments (2021-2032)
12.1.1. South America Tapioca Revenue (USD Million) by Type (2021-2032)
12.1.2. South America Tapioca Revenue (USD Million) by Application (2021-2032)
12.1.3. South America Tapioca Revenue (USD Million) by Product (2021-2032)
By Type
Fresh
Dried
By Application
Animal feed
Food and beverage
Industrial
Chapter 13. Middle East and Africa Tapioca Analysis and Outlook
13.1. Middle East and Africa Tapioca Revenue (USD Million), by Segments (2021-2032)
13.1.1. Middle East and Africa Tapioca Revenue (USD Million) by Type (2021-2032)
13.1.2. Middle East and Africa Tapioca Revenue (USD Million) by Application (2021-2032)
13.1.3. Middle East and Africa Tapioca Revenue (USD Million) by Product (2021-2032)
By Type
Fresh
Dried
By Application
Animal feed
Food and beverage
Industrial
Chapter 14. Tapioca Company Profiles
14.1 Business Overview
14.2 Product Profiles
14.3 SWOT Profiles
14.5 Recent Developments
14.6 Financial Profile
List of Companies
Authentic Foods
Cargill Inc
Ciranda Inc
Ekta International
Emsland Starke GmbH
Hunan Kang pharmaceutical Ltd
Ingredion Inc
Jayavel Sago Factory
KengSeng Group of Co.
Malt Products Corp
Parchem Fine and Specialty Chemicals Inc
PT Budi Starch and Sweetener Tbk
Royal Ingredients Group BV
Sonish Starch Technology Co. Ltd
SPAC Starch Products India Pvt. Ltd
15. Methodology and Data Sources
15.1 Customization Offerings
15.2 Subscription Services
15.3 Related Reports
15.4 Publisher Expertise
LIST OF TABLES
Table 1 Market Segmentation Analysis
Table 2 Global Tapioca Market Share of Leading Companies, 2023
Table 3 Product Offerings of Leading Companies
Table 4 Low Growth Scenario Forecasts
Table 5 Reference Case Growth Scenario
Table 6 High Growth Case Scenario
Table 7 Global Tapioca Revenue (USD Million) And CAGR (%) By Type (2021-2032)
Table 8 Global Tapioca Revenue (USD Million) And CAGR (%) By Application (2021-2032)
Table 9 Global Tapioca Revenue (USD Million) And CAGR (%) By Product (2021-2032)
Table 10 Global Tapioca Market Revenue (USD Million) By Regions (2021-2032)
Table 11 Global Tapioca Market Share (%) By Regions (2021-2032)
Table 12 North America Tapioca Revenue (USD Million) By Country (2021-2032)
Table 13 Europe Tapioca Revenue (USD Million) By Country (2021-2032)
Table 14 Asia Pacific Tapioca Revenue (USD Million) By Country (2021-2032)
Table 15 South America Tapioca Revenue (USD Million) By Country (2021-2032)
Table 16 Middle East and Africa Tapioca Revenue (USD Million) By Region (2021-2032)
Table 17 North America Tapioca Revenue (USD Million) By Type (2021-2032)
Table 18 North America Tapioca Revenue (USD Million) By Application (2021-2032)
Table 19 North America Tapioca Revenue (USD Million) By Product (2021-2032)
Table 20 Europe Tapioca Revenue (USD Million) By Type (2021-2032)
Table 21 Europe Tapioca Revenue (USD Million) By Application (2021-2032)
Table 22 Europe Tapioca Revenue (USD Million) By Product (2021-2032)
Table 23 Asia Pacific Tapioca Revenue (USD Million) By Type (2021-2032)
Table 24 Asia Pacific Tapioca Revenue (USD Million) By Application (2021-2032)
Table 25 Asia Pacific Tapioca Revenue (USD Million) By Product (2021-2032)
Table 26 South America Tapioca Revenue (USD Million) By Type (2021-2032)
Table 27 South America Tapioca Revenue (USD Million) By Application (2021-2032)
Table 28 South America Tapioca Revenue (USD Million) By Product (2021-2032)
Table 29 Middle East and Africa Tapioca Revenue (USD Million) By Type (2021-2032)
Table 30 Middle East and Africa Tapioca Revenue (USD Million) By Application (2021-2032)
Table 31 Middle East and Africa Tapioca Revenue (USD Million) By Product (2021-2032)
LIST OF FIGURES
Figure 1. Market Scope
Figure 2. Pricing Forecasts Per Unit, 2023- 2032
Figure 3. Porter’s Five Forces
Figure 4. Global Tapioca Market Revenue (USD Million) By Regions (2021-2032)
Figure 5. Global Tapioca Market Share (%) By Regions (2023)
Figure 6. North America Tapioca Revenue (USD Million) By Country (2021-2032)
Figure 7. United States Tapioca Revenue (USD Million) By Country (2021-2032)
Figure 8. Canada Tapioca Revenue (USD Million) By Country (2021-2032)
Figure 9. Mexico Tapioca Revenue (USD Million) By Country (2021-2032)
Figure 10. Europe Tapioca Revenue (USD Million) By Country (2021-2032)
Figure 11. Germany Tapioca Revenue (USD Million) By Country (2021-2032)
Figure 12. France Tapioca Revenue (USD Million) By Country (2021-2032)
Figure 13. United Kingdom Tapioca Revenue (USD Million) By Country (2021-2032)
Figure 14. Spain Tapioca Revenue (USD Million) By Country (2021-2032)
Figure 15. Italy Tapioca Revenue (USD Million) By Country (2021-2032)
Figure 16. Russia Tapioca Revenue (USD Million) By Country (2021-2032)
Figure 17. Rest of Europe Tapioca Revenue (USD Million) By Country (2021-2032)
Figure 11. Asia Pacific Tapioca Revenue (USD Million) By Country (2021-2032)
Figure 12. China Tapioca Revenue (USD Million) By Country (2021-2032)
Figure 13. Japan Tapioca Revenue (USD Million) By Country (2021-2032)
Figure 14. India Tapioca Revenue (USD Million) By Country (2021-2032)
Figure 15. South Korea Tapioca Revenue (USD Million) By Country (2021-2032)
Figure 16. Australia Tapioca Revenue (USD Million) By Country (2021-2032)
Figure 17. South East Asia Tapioca Revenue (USD Million) By Country (2021-2032)
Figure 18. South America Tapioca Revenue (USD Million) By Country (2021-2032)
Figure 19. Brazil Tapioca Revenue (USD Million) By Country (2021-2032)
Figure 20. Argentina Tapioca Revenue (USD Million) By Country (2021-2032)
Figure 21. Rest of Asia Pacific Tapioca Revenue (USD Million) By Country (2021-2032)
Figure 22. Middle East and Africa Tapioca Revenue (USD Million) By Region (2021-2032)
Figure 23. Saudi Arabia Tapioca Revenue (USD Million) By Region (2021-2032)
Figure 24. The UAE Tapioca Revenue (USD Million) By Region (2021-2032)
Figure 25. Rest of Middle East Tapioca Revenue (USD Million) By Region (2021-2032)
Figure 26. South Africa Tapioca Revenue (USD Million) By Region (2021-2032)
Figure 27. Africa Tapioca Revenue (USD Million) By Region (2021-2032)
Figure 28. North America Tapioca Revenue (USD Million) By Type (2021-2032)
Figure 29. North America Tapioca Revenue (USD Million) By Application (2021-2032)
Figure 30. North America Tapioca Revenue (USD Million) By Product (2021-2032)
Figure 31. Europe Tapioca Revenue (USD Million) By Type (2021-2032)
Figure 32. Europe Tapioca Revenue (USD Million) By Application (2021-2032)
Figure 33. Europe Tapioca Revenue (USD Million) By Product (2021-2032)
Figure 34. Asia Pacific Tapioca Revenue (USD Million) By Type (2021-2032)
Figure 35. Asia Pacific Tapioca Revenue (USD Million) By Application (2021-2032)
Figure 36. Asia Pacific Tapioca Revenue (USD Million) By Product (2021-2032)
Figure 37. South America Tapioca Revenue (USD Million) By Type (2021-2032)
Figure 38. South America Tapioca Revenue (USD Million) By Application (2021-2032)
Figure 39. South America Tapioca Revenue (USD Million) By Product (2021-2032)
Figure 40. Middle East and Africa Tapioca Revenue (USD Million) By Type (2021-2032)
Figure 41. Middle East and Africa Tapioca Revenue (USD Million) By Application (2021-2032)
Figure 42. Middle East and Africa Tapioca Revenue (USD Million) By Product (2021-2032)
By Type
Fresh
Dried
By Application
Animal feed
Food and beverage
Industrial
Countries Analyzed
North America (US, Canada, Mexico)
Europe (Germany, UK, France, Spain, Italy, Russia, Rest of Europe)
Asia Pacific (China, India, Japan, South Korea, Australia, South East Asia, Rest of Asia)
South America (Brazil, Argentina, Rest of South America)
Middle East and Africa (Saudi Arabia, UAE, Rest of Middle East, South Africa, Egypt, Rest of Africa)
