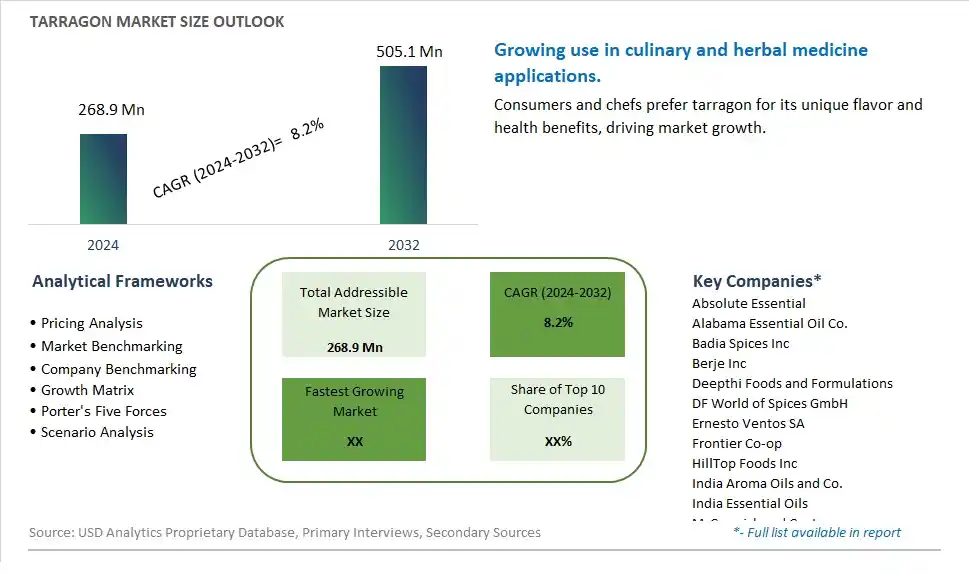
Global Tarragon Market Size is valued at $268.9 Million in 2024 and is forecast to register a growth rate (CAGR) of 8.2% to reach $505.1 Million by 2032.
The global Tarragon Market Comprehensive Study analyzes and forecasts the market size across 6 regions and 24 countries for diverse segments -By Product (Tarragon Seasoning and Paste, Tarragon Oil, Others)
An Introduction to Tarragon Market
The tarragon market in 2024 is expanding as consumers and chefs alike rediscover the culinary and medicinal benefits of this aromatic herb. Tarragon, known for its distinctive anise-like flavor, is widely used in French cuisine and is gaining popularity in other global cuisines for its ability to enhance the taste of a variety of dishes. The market is benefiting from the trend towards fresh and natural ingredients, with tarragon being used in salads, sauces, dressings, and marinades. Additionally, the herb's medicinal properties, such as its use in traditional remedies for digestion and appetite stimulation, are driving interest in tarragon supplements and extracts. The growing popularity of home gardening and farm-to-table movements is also contributing to increased demand for fresh and dried tarragon. As culinary trends continue to evolve and embrace diverse flavors, the tarragon market is expected to see sustained growth.
Tarragon Competitive Landscape
The market report analyses the leading companies in the industry including Absolute Essential, Alabama Essential Oil Co., Badia Spices Inc, Berje Inc, Deepthi Foods and Formulations, DF World of Spices GmbH, Ernesto Ventos SA, Frontier Co-op, HillTop Foods Inc, India Aroma Oils and Co., India Essential Oils, McCormick and Co. Inc, Nature In Bottle, Perfect Flavours, Ravago Group, Sauer Brands Inc, The Good Scents Co., The MANE Group, Young Living Essential Oils, and Others.
Tarragon Market Dynamics
Tarragon Market Trend: Growing Interest in Culinary Diversity and Exotic Flavors
One prominent market trend in the tarragon industry is the growing interest in culinary diversity and exotic flavors. As consumers become more adventurous in their culinary pursuits, there is an increasing demand for unique and globally-inspired ingredients like tarragon that add depth and complexity to dishes. This trend is driven by a desire for new flavor experiences, influenced by international travel, multiculturalism, and the popularity of ethnic cuisines. Additionally, the rise of foodie culture and culinary influencers on social media platforms has heightened consumer curiosity and exploration of unfamiliar ingredients, including herbs and spices like tarragon, leading to greater incorporation of tarragon into a variety of culinary creations.
Market Driver: Growing Emphasis on Health and Wellness Benefits of Herbs
A key market driver for tarragon is the growing emphasis on the health and wellness benefits of herbs. With an increasing focus on natural remedies, holistic health, and functional foods, there is a renewed interest in the medicinal properties and nutritional value of herbs like tarragon. This driver is reinforced by scientific research highlighting the antioxidant, anti-inflammatory, and digestive health benefits of tarragon, as well as its potential role in supporting overall well-being. Additionally, tarragon is valued for its low calorie and low sodium content, making it a popular choice for flavor enhancement in health-conscious recipes and dietary plans. As consumers seek to incorporate more herbs and botanicals into their diets for their potential health benefits, the demand for tarragon as a culinary and medicinal herb continues to grow.
Market Opportunity: Expansion into Value-Added Products and Culinary Applications
The growing demand for tarragon presents a significant opportunity for expansion into value-added products and culinary applications. Manufacturers and producers can capitalize on this trend by offering a diverse range of tarragon-based products, including dried tarragon flakes, tarragon-infused oils, vinegars, sauces, and seasoning blends. This opportunity includes developing innovative culinary solutions that showcase the unique flavor profile and versatility of tarragon, catering to both professional chefs and home cooks seeking convenient and flavorful ingredients for their dishes. Furthermore, there is potential for collaboration with food manufacturers, restaurants, and foodservice providers to incorporate tarragon into a variety of food and beverage offerings, including salads, sauces, marinades, dressings, cocktails, and desserts. By exploring opportunities for expansion into value-added products and culinary applications, stakeholders in the tarragon market can diversify their product portfolios, enhance brand visibility, and capture new market segments in the competitive culinary landscape.
Tarragon Market Share Analysis: Tarragon Seasoning and Paste held the dominant market share in 2024
Within the tarragon market, the tarragon seasoning and paste segment stands as the largest, driven by several pivotal factors. Tarragon seasoning and paste offer a convenient and versatile way to incorporate the distinctive flavor and aroma of tarragon into a variety of culinary dishes. These products are widely utilized by home cooks and professional chefs alike for seasoning meats, poultry, seafood, vegetables, sauces, and dressings. Further, tarragon seasoning and paste provide a concentrated and consistent flavor profile, ensuring the desired taste intensity in dishes. Additionally, the availability of tarragon seasoning and paste in various packaging formats, including bottles, jars, and tubes, caters to diverse consumer preferences and culinary needs. As tarragon seasoning and paste continue to be essential pantry staples for flavor enhancement and culinary experimentation, the segment maintains its dominance as the largest in the tarragon market.
Tarragon Market Segmentation
By Product
Tarragon Seasoning and Paste
Tarragon Oil
Others
Countries Analyzed
North America (US, Canada, Mexico)
Europe (Germany, UK, France, Spain, Italy, Russia, Rest of Europe)
Asia Pacific (China, India, Japan, South Korea, Australia, South East Asia, Rest of Asia)
South America (Brazil, Argentina, Rest of South America)
Middle East and Africa (Saudi Arabia, UAE, Rest of Middle East, South Africa, Egypt, Rest of Africa)
Tarragon Companies Profiled in the Study
Absolute Essential
Alabama Essential Oil Co.
Badia Spices Inc
Berje Inc
Deepthi Foods and Formulations
DF World of Spices GmbH
Ernesto Ventos SA
Frontier Co-op
HillTop Foods Inc
India Aroma Oils and Co.
India Essential Oils
McCormick and Co. Inc
Nature In Bottle
Perfect Flavours
Ravago Group
Sauer Brands Inc
The Good Scents Co.
The MANE Group
Young Living Essential Oils
*- List Not Exhaustive
Chapter 1. TABLE OF CONTENTS
Chapter 2. Introduction to Tarragon Market
2.1. Market Overview
2.2. Key Statistics and Report Highlights
2.3. Scope of the Comprehensive Study
2.3.1. Market Definition
2.3.2 Countries and Regions Covered
2.3.3 Research Objective
2.3.4 Units, Currency, and Conversions
2.3.5 Industry Value Chain
2.4. Key Market Segments
2.5. Key Companies
2.6. Study Period
Chapter 3. Strategic Analysis Review
3.1. Tarragon Pricing Analysis and Forecast
3.2. Porter’s Five Forces
3.3. Market Ecosystem
3.4. SWOT Analysis
3.5. Regulatory Scenario
3.3. Effects of Inflation, Russia-Ukraine War, moderating economic growth, and other macroeconomic factors
Chapter 4. Competitive Landscape
4.1. Market Share Analysis
4.1.1. Global Tarragon Market Share by Company, 2023
4.1.2. Product Offerings of Leading Tarragon Companies
4.2. Market Entropy
4.2.1. New Product Launches in the Industry
4.2.2. Mergers, Acquisitions, Joint ventures, and Partnerships
4.3. Key Strategies and Best Practices
Chapter 5. Global Market Projections: Best, Reference, and Low Case Scenarios
5.1. Growth Analysis- Case Scenario Definitions
5.2. Low Growth Case Scenario Forecasts
5.3. Reference Growth Case Scenario Forecasts
5.4. High Growth Case Scenario Forecasts
Chapter 6. Market Dynamics
6.1. Tarragon Market Drivers
6.2. Tarragon Market Challenges
6.6. Tarragon Market Opportunities
6.4. Tarragon Market Trends
Chapter 7. Global Tarragon Market Outlook Trends
7.1. Global Tarragon Revenue (USD Million) and CAGR (%) by Type (2021-2032)
7.2. Global Tarragon Revenue (USD Million) and CAGR (%) by Application (2021-2032)
7.3. Global Tarragon Revenue (USD Million) and CAGR (%) by Product (2021-2032)
By Product
Tarragon Seasoning and Paste
Tarragon Oil
Others
Chapter 8. Global Tarragon Regional Analysis and Outlook
8.1. Global Tarragon Revenue (USD Million) By Regions (2021- 2032)
8.2. North America Tarragon Revenue (USD Million) by Country (2021-2032)
8.2.1. United States Tarragon Regional Analysis and Outlook
8.2.2. Canada Tarragon Regional Analysis and Outlook
8.2.3. Mexico Tarragon Regional Analysis and Outlook
8.3. Europe Tarragon Revenue (USD Million), by Country (2021-2032)
8.3.1. Germany Tarragon Regional Analysis and Outlook
8.3.2. France Tarragon Regional Analysis and Outlook
8.3.3. United Kingdom Tarragon Regional Analysis and Outlook
8.3.4. Spain Tarragon Regional Analysis and Outlook
8.3.5. Italy Tarragon Regional Analysis and Outlook
8.3.6. Russia Tarragon Regional Analysis and Outlook
8.3.7. Rest of Europe Tarragon Regional Analysis and Outlook
8.4. Asia Pacific Tarragon Revenue (USD Million) by Country (2021-2032)
8.4.1. China Tarragon Regional Analysis and Outlook
8.4.2. Japan Tarragon Regional Analysis and Outlook
8.4.3. India Tarragon Regional Analysis and Outlook
8.4.4. South Korea Tarragon Regional Analysis and Outlook
8.4.5. Australia Tarragon Regional Analysis and Outlook
8.4.6. South East Asia Tarragon Regional Analysis and Outlook
8.4.7. Rest of Asia Pacific Tarragon Regional Analysis and Outlook
8.5. South America Tarragon Revenue (USD Million), by Country (2021-2032)
8.5.1. Brazil Tarragon Regional Analysis and Outlook
8.5.2. Argentina Tarragon Regional Analysis and Outlook
8.5.3. Rest of South America Tarragon Regional Analysis and Outlook
8.6. Middle East and Africa Tarragon Revenue (USD Million) by Country (2021-2032)
8.6.1. Middle East Tarragon Regional Analysis and Outlook
8.6.2. Africa Tarragon Regional Analysis and Outlook
Chapter 9. North America Tarragon Analysis and Outlook
9.1. North America Tarragon Revenue (USD Million) by Segments (2021-2032)
9.1.1. North America Tarragon Revenue (USD Million) by Type (2021-2032)
9.1.2. North America Tarragon Revenue (USD Million) by Application (2021-2032)
9.1.3. North America Tarragon Revenue (USD Million) by Product (2021-2032)
By Product
Tarragon Seasoning and Paste
Tarragon Oil
Others
Chapter 10. Europe Tarragon Analysis and Outlook
10.1. Europe Tarragon Revenue (USD Million), by Segments (USD Million) (2021-2032)
10.1.1. Europe Tarragon Revenue (USD Million) by Type (2021-2032)
10.1.2. Europe Tarragon Revenue (USD Million) by Application (2021-2032)
10.1.3. Europe Tarragon Revenue (USD Million) by Product (2021-2032)
By Product
Tarragon Seasoning and Paste
Tarragon Oil
Others
Chapter 11. Asia Pacific Tarragon Analysis and Outlook
11.1. Asia Pacific Tarragon Revenue (USD Million), and Revenue (USD Million) by Segments (2021-2032)
11.1.1. Asia Pacific Tarragon Revenue (USD Million) by Type (2021-2032)
11.1.2. Asia Pacific Tarragon Revenue (USD Million) by Application (2021-2032)
11.1.3. Asia Pacific Tarragon Revenue (USD Million) by Product (2021-2032)
By Product
Tarragon Seasoning and Paste
Tarragon Oil
Others
Chapter 12. South America Tarragon Analysis and Outlook
12.1. South America Tarragon Revenue (USD Million), by Segments (2021-2032)
12.1.1. South America Tarragon Revenue (USD Million) by Type (2021-2032)
12.1.2. South America Tarragon Revenue (USD Million) by Application (2021-2032)
12.1.3. South America Tarragon Revenue (USD Million) by Product (2021-2032)
By Product
Tarragon Seasoning and Paste
Tarragon Oil
Others
Chapter 13. Middle East and Africa Tarragon Analysis and Outlook
13.1. Middle East and Africa Tarragon Revenue (USD Million), by Segments (2021-2032)
13.1.1. Middle East and Africa Tarragon Revenue (USD Million) by Type (2021-2032)
13.1.2. Middle East and Africa Tarragon Revenue (USD Million) by Application (2021-2032)
13.1.3. Middle East and Africa Tarragon Revenue (USD Million) by Product (2021-2032)
By Product
Tarragon Seasoning and Paste
Tarragon Oil
Others
Chapter 14. Tarragon Company Profiles
14.1 Business Overview
14.2 Product Profiles
14.3 SWOT Profiles
14.5 Recent Developments
14.6 Financial Profile
List of Companies
Absolute Essential
Alabama Essential Oil Co.
Badia Spices Inc
Berje Inc
Deepthi Foods and Formulations
DF World of Spices GmbH
Ernesto Ventos SA
Frontier Co-op
HillTop Foods Inc
India Aroma Oils and Co.
India Essential Oils
McCormick and Co. Inc
Nature In Bottle
Perfect Flavours
Ravago Group
Sauer Brands Inc
The Good Scents Co.
The MANE Group
Young Living Essential Oils
15. Methodology and Data Sources
15.1 Customization Offerings
15.2 Subscription Services
15.3 Related Reports
15.4 Publisher Expertise
LIST OF TABLES
Table 1 Market Segmentation Analysis
Table 2 Global Tarragon Market Share of Leading Companies, 2023
Table 3 Product Offerings of Leading Companies
Table 4 Low Growth Scenario Forecasts
Table 5 Reference Case Growth Scenario
Table 6 High Growth Case Scenario
Table 7 Global Tarragon Revenue (USD Million) And CAGR (%) By Type (2021-2032)
Table 8 Global Tarragon Revenue (USD Million) And CAGR (%) By Application (2021-2032)
Table 9 Global Tarragon Revenue (USD Million) And CAGR (%) By Product (2021-2032)
Table 10 Global Tarragon Market Revenue (USD Million) By Regions (2021-2032)
Table 11 Global Tarragon Market Share (%) By Regions (2021-2032)
Table 12 North America Tarragon Revenue (USD Million) By Country (2021-2032)
Table 13 Europe Tarragon Revenue (USD Million) By Country (2021-2032)
Table 14 Asia Pacific Tarragon Revenue (USD Million) By Country (2021-2032)
Table 15 South America Tarragon Revenue (USD Million) By Country (2021-2032)
Table 16 Middle East and Africa Tarragon Revenue (USD Million) By Region (2021-2032)
Table 17 North America Tarragon Revenue (USD Million) By Type (2021-2032)
Table 18 North America Tarragon Revenue (USD Million) By Application (2021-2032)
Table 19 North America Tarragon Revenue (USD Million) By Product (2021-2032)
Table 20 Europe Tarragon Revenue (USD Million) By Type (2021-2032)
Table 21 Europe Tarragon Revenue (USD Million) By Application (2021-2032)
Table 22 Europe Tarragon Revenue (USD Million) By Product (2021-2032)
Table 23 Asia Pacific Tarragon Revenue (USD Million) By Type (2021-2032)
Table 24 Asia Pacific Tarragon Revenue (USD Million) By Application (2021-2032)
Table 25 Asia Pacific Tarragon Revenue (USD Million) By Product (2021-2032)
Table 26 South America Tarragon Revenue (USD Million) By Type (2021-2032)
Table 27 South America Tarragon Revenue (USD Million) By Application (2021-2032)
Table 28 South America Tarragon Revenue (USD Million) By Product (2021-2032)
Table 29 Middle East and Africa Tarragon Revenue (USD Million) By Type (2021-2032)
Table 30 Middle East and Africa Tarragon Revenue (USD Million) By Application (2021-2032)
Table 31 Middle East and Africa Tarragon Revenue (USD Million) By Product (2021-2032)
LIST OF FIGURES
Figure 1. Market Scope
Figure 2. Pricing Forecasts Per Unit, 2023- 2032
Figure 3. Porter’s Five Forces
Figure 4. Global Tarragon Market Revenue (USD Million) By Regions (2021-2032)
Figure 5. Global Tarragon Market Share (%) By Regions (2023)
Figure 6. North America Tarragon Revenue (USD Million) By Country (2021-2032)
Figure 7. United States Tarragon Revenue (USD Million) By Country (2021-2032)
Figure 8. Canada Tarragon Revenue (USD Million) By Country (2021-2032)
Figure 9. Mexico Tarragon Revenue (USD Million) By Country (2021-2032)
Figure 10. Europe Tarragon Revenue (USD Million) By Country (2021-2032)
Figure 11. Germany Tarragon Revenue (USD Million) By Country (2021-2032)
Figure 12. France Tarragon Revenue (USD Million) By Country (2021-2032)
Figure 13. United Kingdom Tarragon Revenue (USD Million) By Country (2021-2032)
Figure 14. Spain Tarragon Revenue (USD Million) By Country (2021-2032)
Figure 15. Italy Tarragon Revenue (USD Million) By Country (2021-2032)
Figure 16. Russia Tarragon Revenue (USD Million) By Country (2021-2032)
Figure 17. Rest of Europe Tarragon Revenue (USD Million) By Country (2021-2032)
Figure 11. Asia Pacific Tarragon Revenue (USD Million) By Country (2021-2032)
Figure 12. China Tarragon Revenue (USD Million) By Country (2021-2032)
Figure 13. Japan Tarragon Revenue (USD Million) By Country (2021-2032)
Figure 14. India Tarragon Revenue (USD Million) By Country (2021-2032)
Figure 15. South Korea Tarragon Revenue (USD Million) By Country (2021-2032)
Figure 16. Australia Tarragon Revenue (USD Million) By Country (2021-2032)
Figure 17. South East Asia Tarragon Revenue (USD Million) By Country (2021-2032)
Figure 18. South America Tarragon Revenue (USD Million) By Country (2021-2032)
Figure 19. Brazil Tarragon Revenue (USD Million) By Country (2021-2032)
Figure 20. Argentina Tarragon Revenue (USD Million) By Country (2021-2032)
Figure 21. Rest of Asia Pacific Tarragon Revenue (USD Million) By Country (2021-2032)
Figure 22. Middle East and Africa Tarragon Revenue (USD Million) By Region (2021-2032)
Figure 23. Saudi Arabia Tarragon Revenue (USD Million) By Region (2021-2032)
Figure 24. The UAE Tarragon Revenue (USD Million) By Region (2021-2032)
Figure 25. Rest of Middle East Tarragon Revenue (USD Million) By Region (2021-2032)
Figure 26. South Africa Tarragon Revenue (USD Million) By Region (2021-2032)
Figure 27. Africa Tarragon Revenue (USD Million) By Region (2021-2032)
Figure 28. North America Tarragon Revenue (USD Million) By Type (2021-2032)
Figure 29. North America Tarragon Revenue (USD Million) By Application (2021-2032)
Figure 30. North America Tarragon Revenue (USD Million) By Product (2021-2032)
Figure 31. Europe Tarragon Revenue (USD Million) By Type (2021-2032)
Figure 32. Europe Tarragon Revenue (USD Million) By Application (2021-2032)
Figure 33. Europe Tarragon Revenue (USD Million) By Product (2021-2032)
Figure 34. Asia Pacific Tarragon Revenue (USD Million) By Type (2021-2032)
Figure 35. Asia Pacific Tarragon Revenue (USD Million) By Application (2021-2032)
Figure 36. Asia Pacific Tarragon Revenue (USD Million) By Product (2021-2032)
Figure 37. South America Tarragon Revenue (USD Million) By Type (2021-2032)
Figure 38. South America Tarragon Revenue (USD Million) By Application (2021-2032)
Figure 39. South America Tarragon Revenue (USD Million) By Product (2021-2032)
Figure 40. Middle East and Africa Tarragon Revenue (USD Million) By Type (2021-2032)
Figure 41. Middle East and Africa Tarragon Revenue (USD Million) By Application (2021-2032)
Figure 42. Middle East and Africa Tarragon Revenue (USD Million) By Product (2021-2032)
By Product
Tarragon Seasoning and Paste
Tarragon Oil
Others
Countries Analyzed
North America (US, Canada, Mexico)
Europe (Germany, UK, France, Spain, Italy, Russia, Rest of Europe)
Asia Pacific (China, India, Japan, South Korea, Australia, South East Asia, Rest of Asia)
South America (Brazil, Argentina, Rest of South America)
Middle East and Africa (Saudi Arabia, UAE, Rest of Middle East, South Africa, Egypt, Rest of Africa)
