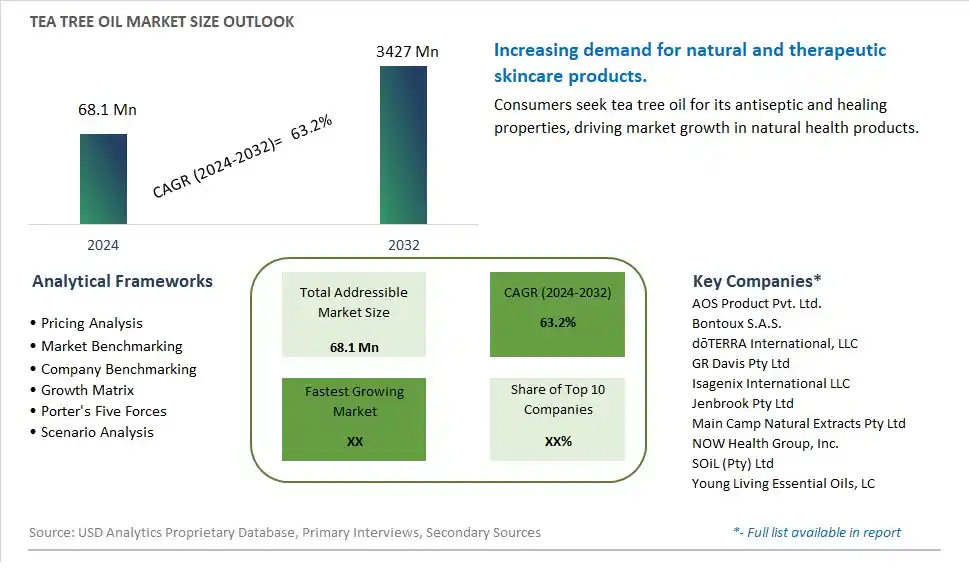
Global Tea Tree Oil Market Size is valued at $68.1 Million in 2024 and is forecast to register a growth rate (CAGR) of 63.2% to reach $3427 Million by 2032.
The global Tea Tree Oil Market Comprehensive Study analyzes and forecasts the market size across 6 regions and 24 countries for diverse segments -By Application (Cosmetic And Toiletries, Therapeutic, Industrial), By End-User (FMCG Manufacturer, Cosmetic Companies, Pharmaceutical Companies, Others), By Grade (Pharma Grade, Therapeutic Grade)
An Introduction to Tea Tree Oil Market
The tea tree oil market in 2024 is set to flourish, driven by its wide range of applications in personal care, cosmetics, and healthcare. Tea tree oil, known for its antimicrobial, antifungal, and anti-inflammatory properties, is a popular ingredient in skincare and haircare products, including shampoos, conditioners, face washes, and creams. The market is benefiting from the growing trend towards natural and organic personal care products, with consumers seeking alternatives to chemical-based formulations. Additionally, tea tree oil is widely used in aromatherapy and alternative medicine for its therapeutic benefits. The increasing awareness of natural remedies and the rise of wellness trends are further boosting demand for tea tree oil. Innovations in product formulations and the development of new applications in health and hygiene are expected to drive market growth. As consumers continue to prioritize natural and effective personal care solutions, the tea tree oil market is poised for significant expansion.
Tea Tree Oil Competitive Landscape
The market report analyses the leading companies in the industry including AOS Product Pvt. Ltd., Bontoux S.A.S., dÅTERRA International, LLC, GR Davis Pty Ltd, Isagenix International LLC, Jenbrook Pty Ltd, Main Camp Natural Extracts Pty Ltd, NOW Health Group, Inc., SOiL (Pty) Ltd, Young Living Essential Oils, LC, and Others.
Tea Tree Oil Market Dynamics
Tea Tree Oil Market Trend: Growing Demand for Natural and Organic Skincare Products
One prominent market trend in the tea tree oil industry is the growing demand for natural and organic skincare products. As consumers become more conscious of the ingredients in their personal care products, there is an increasing preference for plant-based and chemical-free alternatives like tea tree oil. This trend is driven by concerns about the potential adverse effects of synthetic ingredients and the desire for skincare solutions that are gentle, effective, and environmentally friendly. Additionally, the rise of clean beauty movements and the popularity of holistic wellness practices have further propelled the demand for tea tree oil as a key ingredient in skincare formulations. As a result, manufacturers are incorporating tea tree oil into a wide range of skincare products, including cleansers, moisturizers, serums, and spot treatments, to cater to the needs of health-conscious consumers seeking natural solutions for their skincare concerns.
Market Driver: Antimicrobial and Therapeutic Properties of Tea Tree Oil
A key market driver for tea tree oil is its antimicrobial and therapeutic properties. Tea tree oil is renowned for its natural antibacterial, antifungal, and anti-inflammatory properties, making it a versatile ingredient in skincare, haircare, and personal hygiene products. This driver is reinforced by scientific research demonstrating the efficacy of tea tree oil in combating acne, dandruff, fungal infections, and various skin conditions. Additionally, tea tree oil is valued for its soothing and healing properties, making it a popular choice for addressing irritation, inflammation, and minor wounds. The increasing awareness and recognition of tea tree oil's therapeutic benefits by consumers, healthcare professionals, and skincare experts drive the demand for tea tree oil-based products as individuals seek natural and effective solutions for their skincare and wellness needs.
Market Opportunity: Expansion into Functional and Aromatherapy Products
The growing demand for tea tree oil presents a significant opportunity for expansion into functional and aromatherapy products. Manufacturers can capitalize on this trend by developing innovative formulations that leverage the unique properties and aromatic profile of tea tree oil to offer targeted solutions for specific skincare concerns and wellness goals. This opportunity includes introducing tea tree oil-infused products such as acne treatments, scalp care solutions, deodorants, and wound care remedies that address specific skin and health issues. Furthermore, there is potential for expansion into aromatherapy products such as essential oil blends, room sprays, and diffuser blends that promote relaxation, stress relief, and emotional well-being. By exploring opportunities for expansion into functional and aromatherapy products, stakeholders in the tea tree oil market can diversify their product offerings, tap into new market segments, and meet the evolving needs of consumers seeking natural and holistic approaches to skincare and wellness.
Tea Tree Oil Market Share Analysis: Cosmetic and Toiletries held the dominant market share in 2024
Within the tea tree oil market, the cosmetic and toiletries segment stands as the largest, driven by several pivotal factors. Tea tree oil is widely recognized for its potent antimicrobial, anti-inflammatory, and antiseptic properties, making it a highly sought-after ingredient in skincare, haircare, and personal care products. Its natural ability to combat acne, soothe skin irritations, and promote scalp health has led to its widespread use in cosmetics and toiletries, including facial cleansers, moisturizers, shampoos, and soaps. Further, the growing consumer preference for natural and organic ingredients in beauty and personal care products further fuels the demand for tea tree oil-based formulations. Additionally, the versatility of tea tree oil allows for its incorporation into a wide range of cosmetic and toiletry products, catering to diverse skincare and haircare needs. As consumers prioritize products that offer both efficacy and natural benefits, the cosmetic and toiletries segment maintains its dominance as the largest in the tea tree oil market.
Tea Tree Oil Market Share Analysis: Cosmetic Companies market is poised to register the fastest growth rae over the forecast period to 2032
Among the end-users in the tea tree oil market, cosmetic companies emerge as the fastest-growing segment, driven by several key factors. Cosmetic companies recognize the potent antimicrobial and anti-inflammatory properties of tea tree oil, making it a valuable ingredient in skincare and haircare formulations. The rising consumer demand for natural and sustainable beauty products fuels the adoption of tea tree oil by cosmetic companies seeking to cater to these preferences. Further, the versatility of tea tree oil allows for its incorporation into various cosmetic products, including facial cleansers, toners, serums, and hair treatments, addressing a wide range of skincare and haircare concerns. Additionally, the growing popularity of clean beauty and organic skincare further accelerates the growth of tea tree oil in the cosmetic industry. As cosmetic companies continue to innovate and introduce tea tree oil-infused products to meet evolving consumer needs, the segment emerges as a pivotal driver of rapid growth in the tea tree oil market, reshaping the landscape of natural beauty and personal care.
Tea Tree Oil Market Share Analysis: Therapeutic Grade held the dominant market share in 2024
Within the tea tree oil market, the therapeutic grade segment stands as the largest, driven by several pivotal factors. Therapeutic grade tea tree oil is renowned for its high quality and purity, making it highly sought after for its medicinal properties. This grade of tea tree oil undergoes stringent quality control measures to ensure that it is free from contaminants and retains its beneficial compounds, such as terpinen-4-ol, which is responsible for its antimicrobial and anti-inflammatory properties. Further, therapeutic grade tea tree oil is widely used in aromatherapy, natural remedies, and holistic health practices for its soothing and healing effects on the skin and respiratory system. Additionally, the growing consumer interest in natural remedies and alternative healthcare further boosts the demand for therapeutic grade tea tree oil. As consumers prioritize products that offer therapeutic benefits and purity assurance, the therapeutic grade segment maintains its dominance as the largest in the tea tree oil market.
Tea Tree Oil Market Segmentation
By Application
Cosmetic And Toiletries
Therapeutic
Industrial
By End-User
FMCG Manufacturer
Cosmetic Companies
Pharmaceutical Companies
Others
By Grade
Pharma Grade
Therapeutic Grade
Countries Analyzed
North America (US, Canada, Mexico)
Europe (Germany, UK, France, Spain, Italy, Russia, Rest of Europe)
Asia Pacific (China, India, Japan, South Korea, Australia, South East Asia, Rest of Asia)
South America (Brazil, Argentina, Rest of South America)
Middle East and Africa (Saudi Arabia, UAE, Rest of Middle East, South Africa, Egypt, Rest of Africa)
Tea Tree Oil Companies Profiled in the Study
AOS Product Pvt. Ltd.
Bontoux S.A.S.
dÅTERRA International, LLC
GR Davis Pty Ltd
Isagenix International LLC
Jenbrook Pty Ltd
Main Camp Natural Extracts Pty Ltd
NOW Health Group, Inc.
SOiL (Pty) Ltd
Young Living Essential Oils, LC
*- List Not Exhaustive
Chapter 1. TABLE OF CONTENTS
Chapter 2. Introduction to Tea Tree Oil Market
2.1. Market Overview
2.2. Key Statistics and Report Highlights
2.3. Scope of the Comprehensive Study
2.3.1. Market Definition
2.3.2 Countries and Regions Covered
2.3.3 Research Objective
2.3.4 Units, Currency, and Conversions
2.3.5 Industry Value Chain
2.4. Key Market Segments
2.5. Key Companies
2.6. Study Period
Chapter 3. Strategic Analysis Review
3.1. Tea Tree Oil Pricing Analysis and Forecast
3.2. Porter’s Five Forces
3.3. Market Ecosystem
3.4. SWOT Analysis
3.5. Regulatory Scenario
3.3. Effects of Inflation, Russia-Ukraine War, moderating economic growth, and other macroeconomic factors
Chapter 4. Competitive Landscape
4.1. Market Share Analysis
4.1.1. Global Tea Tree Oil Market Share by Company, 2023
4.1.2. Product Offerings of Leading Tea Tree Oil Companies
4.2. Market Entropy
4.2.1. New Product Launches in the Industry
4.2.2. Mergers, Acquisitions, Joint ventures, and Partnerships
4.3. Key Strategies and Best Practices
Chapter 5. Global Market Projections: Best, Reference, and Low Case Scenarios
5.1. Growth Analysis- Case Scenario Definitions
5.2. Low Growth Case Scenario Forecasts
5.3. Reference Growth Case Scenario Forecasts
5.4. High Growth Case Scenario Forecasts
Chapter 6. Market Dynamics
6.1. Tea Tree Oil Market Drivers
6.2. Tea Tree Oil Market Challenges
6.6. Tea Tree Oil Market Opportunities
6.4. Tea Tree Oil Market Trends
Chapter 7. Global Tea Tree Oil Market Outlook Trends
7.1. Global Tea Tree Oil Revenue (USD Million) and CAGR (%) by Type (2021-2032)
7.2. Global Tea Tree Oil Revenue (USD Million) and CAGR (%) by Application (2021-2032)
7.3. Global Tea Tree Oil Revenue (USD Million) and CAGR (%) by Product (2021-2032)
By Application
Cosmetic And Toiletries
Therapeutic
Industrial
By End-User
FMCG Manufacturer
Cosmetic Companies
Pharmaceutical Companies
Others
By Grade
Pharma Grade
Therapeutic Grade
Chapter 8. Global Tea Tree Oil Regional Analysis and Outlook
8.1. Global Tea Tree Oil Revenue (USD Million) By Regions (2021- 2032)
8.2. North America Tea Tree Oil Revenue (USD Million) by Country (2021-2032)
8.2.1. United States Tea Tree Oil Regional Analysis and Outlook
8.2.2. Canada Tea Tree Oil Regional Analysis and Outlook
8.2.3. Mexico Tea Tree Oil Regional Analysis and Outlook
8.3. Europe Tea Tree Oil Revenue (USD Million), by Country (2021-2032)
8.3.1. Germany Tea Tree Oil Regional Analysis and Outlook
8.3.2. France Tea Tree Oil Regional Analysis and Outlook
8.3.3. United Kingdom Tea Tree Oil Regional Analysis and Outlook
8.3.4. Spain Tea Tree Oil Regional Analysis and Outlook
8.3.5. Italy Tea Tree Oil Regional Analysis and Outlook
8.3.6. Russia Tea Tree Oil Regional Analysis and Outlook
8.3.7. Rest of Europe Tea Tree Oil Regional Analysis and Outlook
8.4. Asia Pacific Tea Tree Oil Revenue (USD Million) by Country (2021-2032)
8.4.1. China Tea Tree Oil Regional Analysis and Outlook
8.4.2. Japan Tea Tree Oil Regional Analysis and Outlook
8.4.3. India Tea Tree Oil Regional Analysis and Outlook
8.4.4. South Korea Tea Tree Oil Regional Analysis and Outlook
8.4.5. Australia Tea Tree Oil Regional Analysis and Outlook
8.4.6. South East Asia Tea Tree Oil Regional Analysis and Outlook
8.4.7. Rest of Asia Pacific Tea Tree Oil Regional Analysis and Outlook
8.5. South America Tea Tree Oil Revenue (USD Million), by Country (2021-2032)
8.5.1. Brazil Tea Tree Oil Regional Analysis and Outlook
8.5.2. Argentina Tea Tree Oil Regional Analysis and Outlook
8.5.3. Rest of South America Tea Tree Oil Regional Analysis and Outlook
8.6. Middle East and Africa Tea Tree Oil Revenue (USD Million) by Country (2021-2032)
8.6.1. Middle East Tea Tree Oil Regional Analysis and Outlook
8.6.2. Africa Tea Tree Oil Regional Analysis and Outlook
Chapter 9. North America Tea Tree Oil Analysis and Outlook
9.1. North America Tea Tree Oil Revenue (USD Million) by Segments (2021-2032)
9.1.1. North America Tea Tree Oil Revenue (USD Million) by Type (2021-2032)
9.1.2. North America Tea Tree Oil Revenue (USD Million) by Application (2021-2032)
9.1.3. North America Tea Tree Oil Revenue (USD Million) by Product (2021-2032)
By Application
Cosmetic And Toiletries
Therapeutic
Industrial
By End-User
FMCG Manufacturer
Cosmetic Companies
Pharmaceutical Companies
Others
By Grade
Pharma Grade
Therapeutic Grade
Chapter 10. Europe Tea Tree Oil Analysis and Outlook
10.1. Europe Tea Tree Oil Revenue (USD Million), by Segments (USD Million) (2021-2032)
10.1.1. Europe Tea Tree Oil Revenue (USD Million) by Type (2021-2032)
10.1.2. Europe Tea Tree Oil Revenue (USD Million) by Application (2021-2032)
10.1.3. Europe Tea Tree Oil Revenue (USD Million) by Product (2021-2032)
By Application
Cosmetic And Toiletries
Therapeutic
Industrial
By End-User
FMCG Manufacturer
Cosmetic Companies
Pharmaceutical Companies
Others
By Grade
Pharma Grade
Therapeutic Grade
Chapter 11. Asia Pacific Tea Tree Oil Analysis and Outlook
11.1. Asia Pacific Tea Tree Oil Revenue (USD Million), and Revenue (USD Million) by Segments (2021-2032)
11.1.1. Asia Pacific Tea Tree Oil Revenue (USD Million) by Type (2021-2032)
11.1.2. Asia Pacific Tea Tree Oil Revenue (USD Million) by Application (2021-2032)
11.1.3. Asia Pacific Tea Tree Oil Revenue (USD Million) by Product (2021-2032)
By Application
Cosmetic And Toiletries
Therapeutic
Industrial
By End-User
FMCG Manufacturer
Cosmetic Companies
Pharmaceutical Companies
Others
By Grade
Pharma Grade
Therapeutic Grade
Chapter 12. South America Tea Tree Oil Analysis and Outlook
12.1. South America Tea Tree Oil Revenue (USD Million), by Segments (2021-2032)
12.1.1. South America Tea Tree Oil Revenue (USD Million) by Type (2021-2032)
12.1.2. South America Tea Tree Oil Revenue (USD Million) by Application (2021-2032)
12.1.3. South America Tea Tree Oil Revenue (USD Million) by Product (2021-2032)
By Application
Cosmetic And Toiletries
Therapeutic
Industrial
By End-User
FMCG Manufacturer
Cosmetic Companies
Pharmaceutical Companies
Others
By Grade
Pharma Grade
Therapeutic Grade
Chapter 13. Middle East and Africa Tea Tree Oil Analysis and Outlook
13.1. Middle East and Africa Tea Tree Oil Revenue (USD Million), by Segments (2021-2032)
13.1.1. Middle East and Africa Tea Tree Oil Revenue (USD Million) by Type (2021-2032)
13.1.2. Middle East and Africa Tea Tree Oil Revenue (USD Million) by Application (2021-2032)
13.1.3. Middle East and Africa Tea Tree Oil Revenue (USD Million) by Product (2021-2032)
By Application
Cosmetic And Toiletries
Therapeutic
Industrial
By End-User
FMCG Manufacturer
Cosmetic Companies
Pharmaceutical Companies
Others
By Grade
Pharma Grade
Therapeutic Grade
Chapter 14. Tea Tree Oil Company Profiles
14.1 Business Overview
14.2 Product Profiles
14.3 SWOT Profiles
14.5 Recent Developments
14.6 Financial Profile
List of Companies
AOS Product Pvt. Ltd.
Bontoux S.A.S.
dÅTERRA International, LLC
GR Davis Pty Ltd
Isagenix International LLC
Jenbrook Pty Ltd
Main Camp Natural Extracts Pty Ltd
NOW Health Group, Inc.
SOiL (Pty) Ltd
Young Living Essential Oils, LC
15. Methodology and Data Sources
15.1 Customization Offerings
15.2 Subscription Services
15.3 Related Reports
15.4 Publisher Expertise
LIST OF TABLES
Table 1 Market Segmentation Analysis
Table 2 Global Tea Tree Oil Market Share of Leading Companies, 2023
Table 3 Product Offerings of Leading Companies
Table 4 Low Growth Scenario Forecasts
Table 5 Reference Case Growth Scenario
Table 6 High Growth Case Scenario
Table 7 Global Tea Tree Oil Revenue (USD Million) And CAGR (%) By Type (2021-2032)
Table 8 Global Tea Tree Oil Revenue (USD Million) And CAGR (%) By Application (2021-2032)
Table 9 Global Tea Tree Oil Revenue (USD Million) And CAGR (%) By Product (2021-2032)
Table 10 Global Tea Tree Oil Market Revenue (USD Million) By Regions (2021-2032)
Table 11 Global Tea Tree Oil Market Share (%) By Regions (2021-2032)
Table 12 North America Tea Tree Oil Revenue (USD Million) By Country (2021-2032)
Table 13 Europe Tea Tree Oil Revenue (USD Million) By Country (2021-2032)
Table 14 Asia Pacific Tea Tree Oil Revenue (USD Million) By Country (2021-2032)
Table 15 South America Tea Tree Oil Revenue (USD Million) By Country (2021-2032)
Table 16 Middle East and Africa Tea Tree Oil Revenue (USD Million) By Region (2021-2032)
Table 17 North America Tea Tree Oil Revenue (USD Million) By Type (2021-2032)
Table 18 North America Tea Tree Oil Revenue (USD Million) By Application (2021-2032)
Table 19 North America Tea Tree Oil Revenue (USD Million) By Product (2021-2032)
Table 20 Europe Tea Tree Oil Revenue (USD Million) By Type (2021-2032)
Table 21 Europe Tea Tree Oil Revenue (USD Million) By Application (2021-2032)
Table 22 Europe Tea Tree Oil Revenue (USD Million) By Product (2021-2032)
Table 23 Asia Pacific Tea Tree Oil Revenue (USD Million) By Type (2021-2032)
Table 24 Asia Pacific Tea Tree Oil Revenue (USD Million) By Application (2021-2032)
Table 25 Asia Pacific Tea Tree Oil Revenue (USD Million) By Product (2021-2032)
Table 26 South America Tea Tree Oil Revenue (USD Million) By Type (2021-2032)
Table 27 South America Tea Tree Oil Revenue (USD Million) By Application (2021-2032)
Table 28 South America Tea Tree Oil Revenue (USD Million) By Product (2021-2032)
Table 29 Middle East and Africa Tea Tree Oil Revenue (USD Million) By Type (2021-2032)
Table 30 Middle East and Africa Tea Tree Oil Revenue (USD Million) By Application (2021-2032)
Table 31 Middle East and Africa Tea Tree Oil Revenue (USD Million) By Product (2021-2032)
LIST OF FIGURES
Figure 1. Market Scope
Figure 2. Pricing Forecasts Per Unit, 2023- 2032
Figure 3. Porter’s Five Forces
Figure 4. Global Tea Tree Oil Market Revenue (USD Million) By Regions (2021-2032)
Figure 5. Global Tea Tree Oil Market Share (%) By Regions (2023)
Figure 6. North America Tea Tree Oil Revenue (USD Million) By Country (2021-2032)
Figure 7. United States Tea Tree Oil Revenue (USD Million) By Country (2021-2032)
Figure 8. Canada Tea Tree Oil Revenue (USD Million) By Country (2021-2032)
Figure 9. Mexico Tea Tree Oil Revenue (USD Million) By Country (2021-2032)
Figure 10. Europe Tea Tree Oil Revenue (USD Million) By Country (2021-2032)
Figure 11. Germany Tea Tree Oil Revenue (USD Million) By Country (2021-2032)
Figure 12. France Tea Tree Oil Revenue (USD Million) By Country (2021-2032)
Figure 13. United Kingdom Tea Tree Oil Revenue (USD Million) By Country (2021-2032)
Figure 14. Spain Tea Tree Oil Revenue (USD Million) By Country (2021-2032)
Figure 15. Italy Tea Tree Oil Revenue (USD Million) By Country (2021-2032)
Figure 16. Russia Tea Tree Oil Revenue (USD Million) By Country (2021-2032)
Figure 17. Rest of Europe Tea Tree Oil Revenue (USD Million) By Country (2021-2032)
Figure 11. Asia Pacific Tea Tree Oil Revenue (USD Million) By Country (2021-2032)
Figure 12. China Tea Tree Oil Revenue (USD Million) By Country (2021-2032)
Figure 13. Japan Tea Tree Oil Revenue (USD Million) By Country (2021-2032)
Figure 14. India Tea Tree Oil Revenue (USD Million) By Country (2021-2032)
Figure 15. South Korea Tea Tree Oil Revenue (USD Million) By Country (2021-2032)
Figure 16. Australia Tea Tree Oil Revenue (USD Million) By Country (2021-2032)
Figure 17. South East Asia Tea Tree Oil Revenue (USD Million) By Country (2021-2032)
Figure 18. South America Tea Tree Oil Revenue (USD Million) By Country (2021-2032)
Figure 19. Brazil Tea Tree Oil Revenue (USD Million) By Country (2021-2032)
Figure 20. Argentina Tea Tree Oil Revenue (USD Million) By Country (2021-2032)
Figure 21. Rest of Asia Pacific Tea Tree Oil Revenue (USD Million) By Country (2021-2032)
Figure 22. Middle East and Africa Tea Tree Oil Revenue (USD Million) By Region (2021-2032)
Figure 23. Saudi Arabia Tea Tree Oil Revenue (USD Million) By Region (2021-2032)
Figure 24. The UAE Tea Tree Oil Revenue (USD Million) By Region (2021-2032)
Figure 25. Rest of Middle East Tea Tree Oil Revenue (USD Million) By Region (2021-2032)
Figure 26. South Africa Tea Tree Oil Revenue (USD Million) By Region (2021-2032)
Figure 27. Africa Tea Tree Oil Revenue (USD Million) By Region (2021-2032)
Figure 28. North America Tea Tree Oil Revenue (USD Million) By Type (2021-2032)
Figure 29. North America Tea Tree Oil Revenue (USD Million) By Application (2021-2032)
Figure 30. North America Tea Tree Oil Revenue (USD Million) By Product (2021-2032)
Figure 31. Europe Tea Tree Oil Revenue (USD Million) By Type (2021-2032)
Figure 32. Europe Tea Tree Oil Revenue (USD Million) By Application (2021-2032)
Figure 33. Europe Tea Tree Oil Revenue (USD Million) By Product (2021-2032)
Figure 34. Asia Pacific Tea Tree Oil Revenue (USD Million) By Type (2021-2032)
Figure 35. Asia Pacific Tea Tree Oil Revenue (USD Million) By Application (2021-2032)
Figure 36. Asia Pacific Tea Tree Oil Revenue (USD Million) By Product (2021-2032)
Figure 37. South America Tea Tree Oil Revenue (USD Million) By Type (2021-2032)
Figure 38. South America Tea Tree Oil Revenue (USD Million) By Application (2021-2032)
Figure 39. South America Tea Tree Oil Revenue (USD Million) By Product (2021-2032)
Figure 40. Middle East and Africa Tea Tree Oil Revenue (USD Million) By Type (2021-2032)
Figure 41. Middle East and Africa Tea Tree Oil Revenue (USD Million) By Application (2021-2032)
Figure 42. Middle East and Africa Tea Tree Oil Revenue (USD Million) By Product (2021-2032)
By Application
Cosmetic And Toiletries
Therapeutic
Industrial
By End-User
FMCG Manufacturer
Cosmetic Companies
Pharmaceutical Companies
Others
By Grade
Pharma Grade
Therapeutic Grade
Countries Analyzed
North America (US, Canada, Mexico)
Europe (Germany, UK, France, Spain, Italy, Russia, Rest of Europe)
Asia Pacific (China, India, Japan, South Korea, Australia, South East Asia, Rest of Asia)
South America (Brazil, Argentina, Rest of South America)
Middle East and Africa (Saudi Arabia, UAE, Rest of Middle East, South Africa, Egypt, Rest of Africa)
