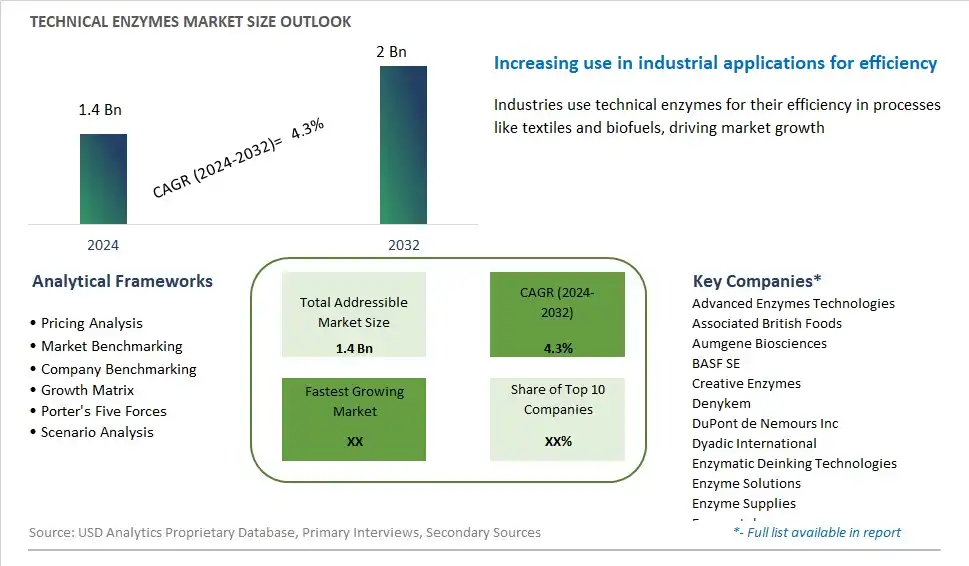
Global Technical Enzymes Market Size is valued at $1.4 Billion in 2024 and is forecast to register a growth rate (CAGR) of 4.3% to reach $2 Billion by 2032.
The global Technical Enzymes Market Comprehensive Study analyzes and forecasts the market size across 6 regions and 24 countries for diverse segments -By End-User (Biofuel, Starch processing, Textiles & leather, Paper & pulp, Others), By Form (Liquid, Dry), By Type (Amylases, Cellulases, Proteases, Lipases, Others)
An Introduction to Technical Enzymes Market
Technical enzymes are enzymes used in various industrial processes such as food processing, brewing, textiles, and biofuels production in 2024. These enzymes perform specific functions such as catalyzing chemical reactions, breaking down complex molecules, or modifying substrates to enhance process efficiency, product quality, and sustainability. Technical enzymes may include amylases, proteases, lipases, cellulases, and xylanases, each tailored to specific applications and operating conditions. With increasing demand for sustainable and eco-friendly manufacturing practices, the market for technical enzymes is expanding, driven by innovations in enzyme engineering, biotechnology, and bioprocessing that enable manufacturers to optimize resource use, reduce waste, and improve product performance while meeting regulatory requirements and industry standards.
Technical Enzymes Competitive Landscape
The market report analyses the leading companies in the industry including Advanced Enzymes Technologies, Associated British Foods, Aumgene Biosciences, BASF SE, Creative Enzymes, Denykem, DuPont de Nemours Inc, Dyadic International, Enzymatic Deinking Technologies, Enzyme Solutions, Enzyme Supplies, Epygen Labs, Maps Enzymes, Megazyme, MetGen, Novozymes A/S, Royal DSM N.V., Sunson Industry Group, Tex Biosciences, Transbiodiesel, and Others.
Technical Enzymes Market Dynamics
Technical Enzymes Market Trend: Increasing Demand for Sustainable and Eco-Friendly Solutions
A prominent market trend for technical enzymes is the increasing demand for sustainable and eco-friendly solutions across various industries. As businesses and consumers alike prioritize environmental sustainability, there is a growing preference for enzymatic processes that offer greener alternatives to traditional chemical methods. Technical enzymes, derived from natural sources such as microorganisms and plants, enable efficient and environmentally friendly processes in industries such as food and beverage, textile, pulp and paper, and biofuel production. This trend is driven by regulatory pressures, consumer awareness, and corporate sustainability initiatives, driving the adoption of technical enzymes as a sustainable solution to meet industry needs while reducing environmental impact.
Market Driver: Advancements in Biotechnology and Enzyme Engineering
A significant market driver for technical enzymes is the continuous advancements in biotechnology and enzyme engineering. With ongoing research and development efforts, scientists and engineers are discovering new enzymes, optimizing existing ones, and developing innovative enzyme-based technologies. These advancements enable the creation of enzymes with enhanced properties such as higher substrate specificity, increased stability, and improved performance under a wide range of conditions. Additionally, advancements in enzyme immobilization techniques and protein engineering methods further expand the applicability of technical enzymes in diverse industrial processes. This driver fuels market growth by unlocking new opportunities for enzyme applications and driving efficiency gains in various industries.
Market Opportunity: Expansion into Bioremediation and Waste Management
An opportunity within the technical enzymes market lies in the expansion into bioremediation and waste management applications. Enzymes offer powerful tools for the degradation and transformation of various pollutants, contaminants, and organic waste materials. By leveraging the catalytic capabilities of enzymes, industries such as environmental remediation, wastewater treatment, and solid waste management can develop sustainable solutions for pollution control and waste remediation. Technical enzymes can facilitate the biodegradation of pollutants such as petroleum hydrocarbons, pesticides, and heavy metals, as well as the conversion of organic waste into valuable products such as biofuels and biogas. This expansion into bioremediation and waste management applications presents a compelling opportunity for technical enzyme manufacturers to address environmental challenges while creating value from waste materials.
Technical Enzymes Market Share Analysis: Starch Processing held the dominant market share in 2024
Within the Technical Enzymes Market, the Starch Processing segment is the largest category, primarily driven by the extensive use of enzymes in starch modification and conversion processes across various industries. Enzymes play a crucial role in starch processing applications, including liquefaction, saccharification, and fermentation, facilitating the production of a wide range of starch-derived products such as sweeteners, syrups, and modified starches. The starch processing industry relies heavily on enzymes to enhance process efficiency, improve product quality, and reduce production costs. Additionally, enzymes offer environmentally friendly alternatives to traditional chemical processing methods, aligning with industry trends towards sustainability and green manufacturing practices. With the increasing demand for starch-based ingredients in food, beverage, and industrial applications, the Starch Processing segment continues to dominate the Technical Enzymes Market, presenting significant opportunities for enzyme manufacturers to innovate and cater to the evolving needs of starch processing industries worldwide.
Technical Enzymes Market Share Analysis: Liquid market is poised to register the fastest growth rae over the forecast period to 2032
Among the segments in the Technical Enzymes Market, the Liquid category is the fastest-growing segment, driven by its superior performance, ease of use, and versatility across various industrial applications. Liquid enzymes offer several advantages over dry forms, including higher enzymatic activity, better solubility, and improved process control. These attributes make liquid enzymes particularly suitable for complex enzymatic reactions, such as starch liquefaction and fermentation, in industries such as biofuel production, starch processing, and textiles. Additionally, liquid enzymes enable precise dosing and efficient mixing, resulting in enhanced process efficiency and product quality. With increasing demand for enzymatic solutions that optimize production processes, reduce energy consumption, and minimize environmental impact, the Liquid segment is poised for rapid growth, presenting lucrative opportunities for enzyme manufacturers to meet the evolving needs of industries within the Technical Enzymes Market.
Technical Enzymes Market Share Analysis: Amylases held the dominant market share in 2024
In the Technical Enzymes Market, the Amylases segment is the largest category, primarily driven by its extensive applications in starch processing, textile manufacturing, and biofuel production. Amylases play a crucial role in catalyzing the hydrolysis of starch molecules into simpler sugars, facilitating the production of various starch-derived products such as sweeteners, syrups, and ethanol. Additionally, amylases are widely utilized in the textile industry for desizing, scouring, and biofinishing processes, contributing to improved fabric quality and sustainability. The versatility and efficiency of amylases in diverse industrial applications make them indispensable enzymes in the Technical Enzymes Market. With the growing demand for starch-based ingredients, sustainable textile processing, and biofuel alternatives, the Amylases segment continues to dominate the market, presenting significant opportunities for enzyme manufacturers to innovate and expand their product portfolios to meet evolving industry needs.
Technical Enzymes Market Segmentation
By End-User
Biofuel
Starch processing
Textiles & leather
Paper & pulp
Others
By Form
Liquid
Dry
By Type
Amylases
Cellulases
Proteases
Lipases
Others
Countries Analyzed
North America (US, Canada, Mexico)
Europe (Germany, UK, France, Spain, Italy, Russia, Rest of Europe)
Asia Pacific (China, India, Japan, South Korea, Australia, South East Asia, Rest of Asia)
South America (Brazil, Argentina, Rest of South America)
Middle East and Africa (Saudi Arabia, UAE, Rest of Middle East, South Africa, Egypt, Rest of Africa)
Technical Enzymes Companies Profiled in the Study
Advanced Enzymes Technologies
Associated British Foods
Aumgene Biosciences
BASF SE
Creative Enzymes
Denykem
DuPont de Nemours Inc
Dyadic International
Enzymatic Deinking Technologies
Enzyme Solutions
Enzyme Supplies
Epygen Labs
Maps Enzymes
Megazyme
MetGen
Novozymes A/S
Royal DSM N.V.
Sunson Industry Group
Tex Biosciences
Transbiodiesel
*- List Not Exhaustive
Chapter 1. TABLE OF CONTENTS
Chapter 2. Introduction to Technical Enzymes Market
2.1. Market Overview
2.2. Key Statistics and Report Highlights
2.3. Scope of the Comprehensive Study
2.3.1. Market Definition
2.3.2 Countries and Regions Covered
2.3.3 Research Objective
2.3.4 Units, Currency, and Conversions
2.3.5 Industry Value Chain
2.4. Key Market Segments
2.5. Key Companies
2.6. Study Period
Chapter 3. Strategic Analysis Review
3.1. Technical Enzymes Pricing Analysis and Forecast
3.2. Porter’s Five Forces
3.3. Market Ecosystem
3.4. SWOT Analysis
3.5. Regulatory Scenario
3.3. Effects of Inflation, Russia-Ukraine War, moderating economic growth, and other macroeconomic factors
Chapter 4. Competitive Landscape
4.1. Market Share Analysis
4.1.1. Global Technical Enzymes Market Share by Company, 2023
4.1.2. Product Offerings of Leading Technical Enzymes Companies
4.2. Market Entropy
4.2.1. New Product Launches in the Industry
4.2.2. Mergers, Acquisitions, Joint ventures, and Partnerships
4.3. Key Strategies and Best Practices
Chapter 5. Global Market Projections: Best, Reference, and Low Case Scenarios
5.1. Growth Analysis- Case Scenario Definitions
5.2. Low Growth Case Scenario Forecasts
5.3. Reference Growth Case Scenario Forecasts
5.4. High Growth Case Scenario Forecasts
Chapter 6. Market Dynamics
6.1. Technical Enzymes Market Drivers
6.2. Technical Enzymes Market Challenges
6.6. Technical Enzymes Market Opportunities
6.4. Technical Enzymes Market Trends
Chapter 7. Global Technical Enzymes Market Outlook Trends
7.1. Global Technical Enzymes Revenue (USD Million) and CAGR (%) by Type (2021-2032)
7.2. Global Technical Enzymes Revenue (USD Million) and CAGR (%) by Application (2021-2032)
7.3. Global Technical Enzymes Revenue (USD Million) and CAGR (%) by Product (2021-2032)
By End-User
Biofuel
Starch processing
Textiles & leather
Paper & pulp
Others
By Form
Liquid
Dry
By Type
Amylases
Cellulases
Proteases
Lipases
Others
Chapter 8. Global Technical Enzymes Regional Analysis and Outlook
8.1. Global Technical Enzymes Revenue (USD Million) By Regions (2021- 2032)
8.2. North America Technical Enzymes Revenue (USD Million) by Country (2021-2032)
8.2.1. United States Technical Enzymes Regional Analysis and Outlook
8.2.2. Canada Technical Enzymes Regional Analysis and Outlook
8.2.3. Mexico Technical Enzymes Regional Analysis and Outlook
8.3. Europe Technical Enzymes Revenue (USD Million), by Country (2021-2032)
8.3.1. Germany Technical Enzymes Regional Analysis and Outlook
8.3.2. France Technical Enzymes Regional Analysis and Outlook
8.3.3. United Kingdom Technical Enzymes Regional Analysis and Outlook
8.3.4. Spain Technical Enzymes Regional Analysis and Outlook
8.3.5. Italy Technical Enzymes Regional Analysis and Outlook
8.3.6. Russia Technical Enzymes Regional Analysis and Outlook
8.3.7. Rest of Europe Technical Enzymes Regional Analysis and Outlook
8.4. Asia Pacific Technical Enzymes Revenue (USD Million) by Country (2021-2032)
8.4.1. China Technical Enzymes Regional Analysis and Outlook
8.4.2. Japan Technical Enzymes Regional Analysis and Outlook
8.4.3. India Technical Enzymes Regional Analysis and Outlook
8.4.4. South Korea Technical Enzymes Regional Analysis and Outlook
8.4.5. Australia Technical Enzymes Regional Analysis and Outlook
8.4.6. South East Asia Technical Enzymes Regional Analysis and Outlook
8.4.7. Rest of Asia Pacific Technical Enzymes Regional Analysis and Outlook
8.5. South America Technical Enzymes Revenue (USD Million), by Country (2021-2032)
8.5.1. Brazil Technical Enzymes Regional Analysis and Outlook
8.5.2. Argentina Technical Enzymes Regional Analysis and Outlook
8.5.3. Rest of South America Technical Enzymes Regional Analysis and Outlook
8.6. Middle East and Africa Technical Enzymes Revenue (USD Million) by Country (2021-2032)
8.6.1. Middle East Technical Enzymes Regional Analysis and Outlook
8.6.2. Africa Technical Enzymes Regional Analysis and Outlook
Chapter 9. North America Technical Enzymes Analysis and Outlook
9.1. North America Technical Enzymes Revenue (USD Million) by Segments (2021-2032)
9.1.1. North America Technical Enzymes Revenue (USD Million) by Type (2021-2032)
9.1.2. North America Technical Enzymes Revenue (USD Million) by Application (2021-2032)
9.1.3. North America Technical Enzymes Revenue (USD Million) by Product (2021-2032)
By End-User
Biofuel
Starch processing
Textiles & leather
Paper & pulp
Others
By Form
Liquid
Dry
By Type
Amylases
Cellulases
Proteases
Lipases
Others
Chapter 10. Europe Technical Enzymes Analysis and Outlook
10.1. Europe Technical Enzymes Revenue (USD Million), by Segments (USD Million) (2021-2032)
10.1.1. Europe Technical Enzymes Revenue (USD Million) by Type (2021-2032)
10.1.2. Europe Technical Enzymes Revenue (USD Million) by Application (2021-2032)
10.1.3. Europe Technical Enzymes Revenue (USD Million) by Product (2021-2032)
By End-User
Biofuel
Starch processing
Textiles & leather
Paper & pulp
Others
By Form
Liquid
Dry
By Type
Amylases
Cellulases
Proteases
Lipases
Others
Chapter 11. Asia Pacific Technical Enzymes Analysis and Outlook
11.1. Asia Pacific Technical Enzymes Revenue (USD Million), and Revenue (USD Million) by Segments (2021-2032)
11.1.1. Asia Pacific Technical Enzymes Revenue (USD Million) by Type (2021-2032)
11.1.2. Asia Pacific Technical Enzymes Revenue (USD Million) by Application (2021-2032)
11.1.3. Asia Pacific Technical Enzymes Revenue (USD Million) by Product (2021-2032)
By End-User
Biofuel
Starch processing
Textiles & leather
Paper & pulp
Others
By Form
Liquid
Dry
By Type
Amylases
Cellulases
Proteases
Lipases
Others
Chapter 12. South America Technical Enzymes Analysis and Outlook
12.1. South America Technical Enzymes Revenue (USD Million), by Segments (2021-2032)
12.1.1. South America Technical Enzymes Revenue (USD Million) by Type (2021-2032)
12.1.2. South America Technical Enzymes Revenue (USD Million) by Application (2021-2032)
12.1.3. South America Technical Enzymes Revenue (USD Million) by Product (2021-2032)
By End-User
Biofuel
Starch processing
Textiles & leather
Paper & pulp
Others
By Form
Liquid
Dry
By Type
Amylases
Cellulases
Proteases
Lipases
Others
Chapter 13. Middle East and Africa Technical Enzymes Analysis and Outlook
13.1. Middle East and Africa Technical Enzymes Revenue (USD Million), by Segments (2021-2032)
13.1.1. Middle East and Africa Technical Enzymes Revenue (USD Million) by Type (2021-2032)
13.1.2. Middle East and Africa Technical Enzymes Revenue (USD Million) by Application (2021-2032)
13.1.3. Middle East and Africa Technical Enzymes Revenue (USD Million) by Product (2021-2032)
By End-User
Biofuel
Starch processing
Textiles & leather
Paper & pulp
Others
By Form
Liquid
Dry
By Type
Amylases
Cellulases
Proteases
Lipases
Others
Chapter 14. Technical Enzymes Company Profiles
14.1 Business Overview
14.2 Product Profiles
14.3 SWOT Profiles
14.5 Recent Developments
14.6 Financial Profile
List of Companies
Advanced Enzymes Technologies
Associated British Foods
Aumgene Biosciences
BASF SE
Creative Enzymes
Denykem
DuPont de Nemours Inc
Dyadic International
Enzymatic Deinking Technologies
Enzyme Solutions
Enzyme Supplies
Epygen Labs
Maps Enzymes
Megazyme
MetGen
Novozymes A/S
Royal DSM N.V.
Sunson Industry Group
Tex Biosciences
Transbiodiesel
15. Methodology and Data Sources
15.1 Customization Offerings
15.2 Subscription Services
15.3 Related Reports
15.4 Publisher Expertise
LIST OF TABLES
Table 1 Market Segmentation Analysis
Table 2 Global Technical Enzymes Market Share of Leading Companies, 2023
Table 3 Product Offerings of Leading Companies
Table 4 Low Growth Scenario Forecasts
Table 5 Reference Case Growth Scenario
Table 6 High Growth Case Scenario
Table 7 Global Technical Enzymes Revenue (USD Million) And CAGR (%) By Type (2021-2032)
Table 8 Global Technical Enzymes Revenue (USD Million) And CAGR (%) By Application (2021-2032)
Table 9 Global Technical Enzymes Revenue (USD Million) And CAGR (%) By Product (2021-2032)
Table 10 Global Technical Enzymes Market Revenue (USD Million) By Regions (2021-2032)
Table 11 Global Technical Enzymes Market Share (%) By Regions (2021-2032)
Table 12 North America Technical Enzymes Revenue (USD Million) By Country (2021-2032)
Table 13 Europe Technical Enzymes Revenue (USD Million) By Country (2021-2032)
Table 14 Asia Pacific Technical Enzymes Revenue (USD Million) By Country (2021-2032)
Table 15 South America Technical Enzymes Revenue (USD Million) By Country (2021-2032)
Table 16 Middle East and Africa Technical Enzymes Revenue (USD Million) By Region (2021-2032)
Table 17 North America Technical Enzymes Revenue (USD Million) By Type (2021-2032)
Table 18 North America Technical Enzymes Revenue (USD Million) By Application (2021-2032)
Table 19 North America Technical Enzymes Revenue (USD Million) By Product (2021-2032)
Table 20 Europe Technical Enzymes Revenue (USD Million) By Type (2021-2032)
Table 21 Europe Technical Enzymes Revenue (USD Million) By Application (2021-2032)
Table 22 Europe Technical Enzymes Revenue (USD Million) By Product (2021-2032)
Table 23 Asia Pacific Technical Enzymes Revenue (USD Million) By Type (2021-2032)
Table 24 Asia Pacific Technical Enzymes Revenue (USD Million) By Application (2021-2032)
Table 25 Asia Pacific Technical Enzymes Revenue (USD Million) By Product (2021-2032)
Table 26 South America Technical Enzymes Revenue (USD Million) By Type (2021-2032)
Table 27 South America Technical Enzymes Revenue (USD Million) By Application (2021-2032)
Table 28 South America Technical Enzymes Revenue (USD Million) By Product (2021-2032)
Table 29 Middle East and Africa Technical Enzymes Revenue (USD Million) By Type (2021-2032)
Table 30 Middle East and Africa Technical Enzymes Revenue (USD Million) By Application (2021-2032)
Table 31 Middle East and Africa Technical Enzymes Revenue (USD Million) By Product (2021-2032)
LIST OF FIGURES
Figure 1. Market Scope
Figure 2. Pricing Forecasts Per Unit, 2023- 2032
Figure 3. Porter’s Five Forces
Figure 4. Global Technical Enzymes Market Revenue (USD Million) By Regions (2021-2032)
Figure 5. Global Technical Enzymes Market Share (%) By Regions (2023)
Figure 6. North America Technical Enzymes Revenue (USD Million) By Country (2021-2032)
Figure 7. United States Technical Enzymes Revenue (USD Million) By Country (2021-2032)
Figure 8. Canada Technical Enzymes Revenue (USD Million) By Country (2021-2032)
Figure 9. Mexico Technical Enzymes Revenue (USD Million) By Country (2021-2032)
Figure 10. Europe Technical Enzymes Revenue (USD Million) By Country (2021-2032)
Figure 11. Germany Technical Enzymes Revenue (USD Million) By Country (2021-2032)
Figure 12. France Technical Enzymes Revenue (USD Million) By Country (2021-2032)
Figure 13. United Kingdom Technical Enzymes Revenue (USD Million) By Country (2021-2032)
Figure 14. Spain Technical Enzymes Revenue (USD Million) By Country (2021-2032)
Figure 15. Italy Technical Enzymes Revenue (USD Million) By Country (2021-2032)
Figure 16. Russia Technical Enzymes Revenue (USD Million) By Country (2021-2032)
Figure 17. Rest of Europe Technical Enzymes Revenue (USD Million) By Country (2021-2032)
Figure 11. Asia Pacific Technical Enzymes Revenue (USD Million) By Country (2021-2032)
Figure 12. China Technical Enzymes Revenue (USD Million) By Country (2021-2032)
Figure 13. Japan Technical Enzymes Revenue (USD Million) By Country (2021-2032)
Figure 14. India Technical Enzymes Revenue (USD Million) By Country (2021-2032)
Figure 15. South Korea Technical Enzymes Revenue (USD Million) By Country (2021-2032)
Figure 16. Australia Technical Enzymes Revenue (USD Million) By Country (2021-2032)
Figure 17. South East Asia Technical Enzymes Revenue (USD Million) By Country (2021-2032)
Figure 18. South America Technical Enzymes Revenue (USD Million) By Country (2021-2032)
Figure 19. Brazil Technical Enzymes Revenue (USD Million) By Country (2021-2032)
Figure 20. Argentina Technical Enzymes Revenue (USD Million) By Country (2021-2032)
Figure 21. Rest of Asia Pacific Technical Enzymes Revenue (USD Million) By Country (2021-2032)
Figure 22. Middle East and Africa Technical Enzymes Revenue (USD Million) By Region (2021-2032)
Figure 23. Saudi Arabia Technical Enzymes Revenue (USD Million) By Region (2021-2032)
Figure 24. The UAE Technical Enzymes Revenue (USD Million) By Region (2021-2032)
Figure 25. Rest of Middle East Technical Enzymes Revenue (USD Million) By Region (2021-2032)
Figure 26. South Africa Technical Enzymes Revenue (USD Million) By Region (2021-2032)
Figure 27. Africa Technical Enzymes Revenue (USD Million) By Region (2021-2032)
Figure 28. North America Technical Enzymes Revenue (USD Million) By Type (2021-2032)
Figure 29. North America Technical Enzymes Revenue (USD Million) By Application (2021-2032)
Figure 30. North America Technical Enzymes Revenue (USD Million) By Product (2021-2032)
Figure 31. Europe Technical Enzymes Revenue (USD Million) By Type (2021-2032)
Figure 32. Europe Technical Enzymes Revenue (USD Million) By Application (2021-2032)
Figure 33. Europe Technical Enzymes Revenue (USD Million) By Product (2021-2032)
Figure 34. Asia Pacific Technical Enzymes Revenue (USD Million) By Type (2021-2032)
Figure 35. Asia Pacific Technical Enzymes Revenue (USD Million) By Application (2021-2032)
Figure 36. Asia Pacific Technical Enzymes Revenue (USD Million) By Product (2021-2032)
Figure 37. South America Technical Enzymes Revenue (USD Million) By Type (2021-2032)
Figure 38. South America Technical Enzymes Revenue (USD Million) By Application (2021-2032)
Figure 39. South America Technical Enzymes Revenue (USD Million) By Product (2021-2032)
Figure 40. Middle East and Africa Technical Enzymes Revenue (USD Million) By Type (2021-2032)
Figure 41. Middle East and Africa Technical Enzymes Revenue (USD Million) By Application (2021-2032)
Figure 42. Middle East and Africa Technical Enzymes Revenue (USD Million) By Product (2021-2032)
By End-User
Biofuel
Starch processing
Textiles & leather
Paper & pulp
Others
By Form
Liquid
Dry
By Type
Amylases
Cellulases
Proteases
Lipases
Others
Countries Analyzed
North America (US, Canada, Mexico)
Europe (Germany, UK, France, Spain, Italy, Russia, Rest of Europe)
Asia Pacific (China, India, Japan, South Korea, Australia, South East Asia, Rest of Asia)
South America (Brazil, Argentina, Rest of South America)
Middle East and Africa (Saudi Arabia, UAE, Rest of Middle East, South Africa, Egypt, Rest of Africa)
