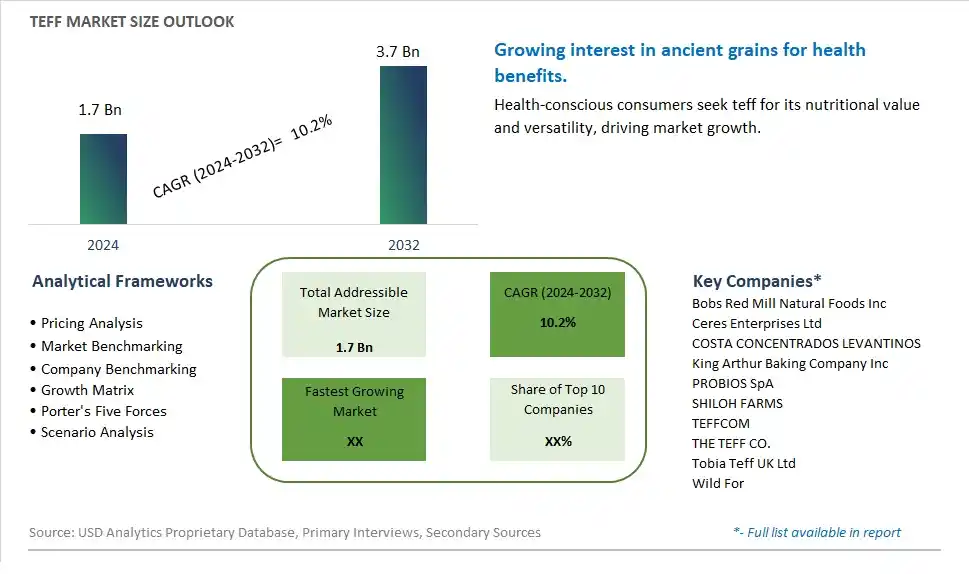
Global Teff Market Size is valued at $1.7 Billion in 2024 and is forecast to register a growth rate (CAGR) of 10.2% to reach $3.7 Billion by 2032.
The global Teff Market Comprehensive Study analyzes and forecasts the market size across 6 regions and 24 countries for diverse segments -By Product (Conventional Teff, Organic Teff), By Application (Flour, Bakery, Cereals, Beverages, Snacks, Others)
An Introduction to Teff Market
The teff market in 2024 is set to expand significantly, driven by the growing popularity of ancient grains and gluten-free diets. Teff, a nutrient-dense grain native to Ethiopia, is celebrated for its high protein content, rich fiber, and essential minerals like iron and calcium. The market is benefiting from the rising demand for superfoods and the increasing interest in diverse and nutritious grains. Teff is being incorporated into a variety of food products, including bread, cereals, pasta, and snack bars, appealing to health-conscious consumers and those with gluten sensitivities. The clean label trend and the preference for minimally processed ingredients are also driving demand for teff-based products. Furthermore, the promotion of teff as a sustainable crop, with its ability to thrive in harsh conditions and support small-scale farmers, is enhancing its market appeal. As consumers seek healthy and sustainable food options, the teff market is poised for robust growth.
Teff Competitive Landscape
The market report analyses the leading companies in the industry including Bobs Red Mill Natural Foods Inc, Ceres Enterprises Ltd, COSTA CONCENTRADOS LEVANTINOS, King Arthur Baking Company Inc, PROBIOS SpA, SHILOH FARMS, TEFFCOM, THE TEFF CO., Tobia Teff UK Ltd, Wild For, and Others.
Teff Market Dynamics
Teff Market Trend: Growing Demand for Gluten-Free and Nutrient-Dense Foods
One prominent market trend in the teff industry is the growing demand for gluten-free and nutrient-dense foods. As consumers become increasingly health-conscious and seek alternatives to traditional grains, teff has gained popularity for its gluten-free properties and nutritional benefits. Teff is naturally rich in protein, fiber, vitamins, and minerals, making it an attractive option for individuals with dietary restrictions or those looking to incorporate more nutrient-dense foods into their diets. This trend is driven by factors such as rising awareness of gluten intolerance, celiac disease, and the desire for healthier eating habits, positioning teff as a versatile and nutritious ingredient in various food products.
Market Driver: Expansion of Health Food and Specialty Markets
A key market driver for teff is the expansion of health food and specialty markets. As health-conscious consumers increasingly prioritize nutrition and wellness, there is a growing demand for alternative grains and superfoods like teff in the health food and specialty markets. This driver is reinforced by factors such as increasing adoption of plant-based diets, interest in ancient grains, and the influence of wellness trends on consumer purchasing behavior. Teff's unique nutritional profile and culinary versatility make it well-suited for use in a wide range of products, including baked goods, cereals, snacks, and beverages, driving its adoption in the health food and specialty segments of the food industry.
Market Opportunity: Diversification of Product Offerings and Market Expansion
The growing demand for teff presents a significant opportunity for the diversification of product offerings and market expansion. Manufacturers and food entrepreneurs can capitalize on this trend by developing innovative teff-based products that cater to diverse consumer preferences and dietary needs. This opportunity includes exploring new product categories such as teff-based snacks, ready-to-eat meals, and functional foods fortified with teff flour or teff-derived ingredients. Additionally, there is potential for market expansion beyond traditional health food stores to mainstream grocery retailers, specialty food markets, and e-commerce platforms, where teff products can reach a wider audience of health-conscious consumers seeking nutritious and flavorful alternatives to conventional grains. By tapping into the growing demand for teff and leveraging its nutritional benefits, stakeholders in the teff market can seize opportunities for growth, differentiation, and market penetration in the evolving landscape of the health and wellness industry.
Teff Market Share Analysis: Conventional Teff held the dominant market share in 2024
Within the teff market, the conventional teff segment stands as the largest, driven by several pivotal factors. Conventional teff, cultivated using traditional agricultural practices and without the stringent requirements of organic certification, is more widely available and accessible to consumers. Additionally, conventional teff often benefits from lower production costs, resulting in more competitive pricing compared to organic alternatives. Further, conventional teff satisfies the demand of a broader consumer base, including those who prioritize affordability and availability over organic certification. As a staple food in many cultures, conventional teff remains the preferred choice for consumers seeking nutritious and versatile grains for various culinary applications. Overall, these factors contribute to the dominance of the conventional teff segment in the market.
Teff Market Share Analysis: Bakery market is poised to register the fastest growth rae over the forecast period to 2032
Among the applications in the teff market, the bakery segment is the fastest-growing, driven by several key factors. Teff flour is gaining popularity among bakers and consumers alike due to its gluten-free properties and nutritional benefits. Teff flour is rich in essential nutrients such as fiber, protein, and iron, making it an attractive ingredient for producing healthier baked goods. Further, teff imparts a unique nutty flavor and pleasant texture to baked products, enhancing their taste and appeal. Additionally, the rising demand for gluten-free alternatives and the increasing prevalence of gluten-related sensitivities and allergies propel the growth of teff-based bakery products. As consumers prioritize healthier and allergy-friendly options in their diets, the bakery segment experiences rapid expansion, reshaping the landscape of the teff market.
Teff Market Segmentation
By Product
Conventional Teff
Organic Teff
By Application
Flour
Bakery
Cereals
Beverages
Snacks
Others
Countries Analyzed
North America (US, Canada, Mexico)
Europe (Germany, UK, France, Spain, Italy, Russia, Rest of Europe)
Asia Pacific (China, India, Japan, South Korea, Australia, South East Asia, Rest of Asia)
South America (Brazil, Argentina, Rest of South America)
Middle East and Africa (Saudi Arabia, UAE, Rest of Middle East, South Africa, Egypt, Rest of Africa)
Teff Companies Profiled in the Study
Bobs Red Mill Natural Foods Inc
Ceres Enterprises Ltd
COSTA CONCENTRADOS LEVANTINOS
King Arthur Baking Company Inc
PROBIOS SpA
SHILOH FARMS
TEFFCOM
THE TEFF CO.
Tobia Teff UK Ltd
Wild For
*- List Not Exhaustive
Chapter 1. TABLE OF CONTENTS
Chapter 2. Introduction to Teff Market
2.1. Market Overview
2.2. Key Statistics and Report Highlights
2.3. Scope of the Comprehensive Study
2.3.1. Market Definition
2.3.2 Countries and Regions Covered
2.3.3 Research Objective
2.3.4 Units, Currency, and Conversions
2.3.5 Industry Value Chain
2.4. Key Market Segments
2.5. Key Companies
2.6. Study Period
Chapter 3. Strategic Analysis Review
3.1. Teff Pricing Analysis and Forecast
3.2. Porter’s Five Forces
3.3. Market Ecosystem
3.4. SWOT Analysis
3.5. Regulatory Scenario
3.3. Effects of Inflation, Russia-Ukraine War, moderating economic growth, and other macroeconomic factors
Chapter 4. Competitive Landscape
4.1. Market Share Analysis
4.1.1. Global Teff Market Share by Company, 2023
4.1.2. Product Offerings of Leading Teff Companies
4.2. Market Entropy
4.2.1. New Product Launches in the Industry
4.2.2. Mergers, Acquisitions, Joint ventures, and Partnerships
4.3. Key Strategies and Best Practices
Chapter 5. Global Market Projections: Best, Reference, and Low Case Scenarios
5.1. Growth Analysis- Case Scenario Definitions
5.2. Low Growth Case Scenario Forecasts
5.3. Reference Growth Case Scenario Forecasts
5.4. High Growth Case Scenario Forecasts
Chapter 6. Market Dynamics
6.1. Teff Market Drivers
6.2. Teff Market Challenges
6.6. Teff Market Opportunities
6.4. Teff Market Trends
Chapter 7. Global Teff Market Outlook Trends
7.1. Global Teff Revenue (USD Million) and CAGR (%) by Type (2021-2032)
7.2. Global Teff Revenue (USD Million) and CAGR (%) by Application (2021-2032)
7.3. Global Teff Revenue (USD Million) and CAGR (%) by Product (2021-2032)
By Product
Conventional Teff
Organic Teff
By Application
Flour
Bakery
Cereals
Beverages
Snacks
Others
Chapter 8. Global Teff Regional Analysis and Outlook
8.1. Global Teff Revenue (USD Million) By Regions (2021- 2032)
8.2. North America Teff Revenue (USD Million) by Country (2021-2032)
8.2.1. United States Teff Regional Analysis and Outlook
8.2.2. Canada Teff Regional Analysis and Outlook
8.2.3. Mexico Teff Regional Analysis and Outlook
8.3. Europe Teff Revenue (USD Million), by Country (2021-2032)
8.3.1. Germany Teff Regional Analysis and Outlook
8.3.2. France Teff Regional Analysis and Outlook
8.3.3. United Kingdom Teff Regional Analysis and Outlook
8.3.4. Spain Teff Regional Analysis and Outlook
8.3.5. Italy Teff Regional Analysis and Outlook
8.3.6. Russia Teff Regional Analysis and Outlook
8.3.7. Rest of Europe Teff Regional Analysis and Outlook
8.4. Asia Pacific Teff Revenue (USD Million) by Country (2021-2032)
8.4.1. China Teff Regional Analysis and Outlook
8.4.2. Japan Teff Regional Analysis and Outlook
8.4.3. India Teff Regional Analysis and Outlook
8.4.4. South Korea Teff Regional Analysis and Outlook
8.4.5. Australia Teff Regional Analysis and Outlook
8.4.6. South East Asia Teff Regional Analysis and Outlook
8.4.7. Rest of Asia Pacific Teff Regional Analysis and Outlook
8.5. South America Teff Revenue (USD Million), by Country (2021-2032)
8.5.1. Brazil Teff Regional Analysis and Outlook
8.5.2. Argentina Teff Regional Analysis and Outlook
8.5.3. Rest of South America Teff Regional Analysis and Outlook
8.6. Middle East and Africa Teff Revenue (USD Million) by Country (2021-2032)
8.6.1. Middle East Teff Regional Analysis and Outlook
8.6.2. Africa Teff Regional Analysis and Outlook
Chapter 9. North America Teff Analysis and Outlook
9.1. North America Teff Revenue (USD Million) by Segments (2021-2032)
9.1.1. North America Teff Revenue (USD Million) by Type (2021-2032)
9.1.2. North America Teff Revenue (USD Million) by Application (2021-2032)
9.1.3. North America Teff Revenue (USD Million) by Product (2021-2032)
By Product
Conventional Teff
Organic Teff
By Application
Flour
Bakery
Cereals
Beverages
Snacks
Others
Chapter 10. Europe Teff Analysis and Outlook
10.1. Europe Teff Revenue (USD Million), by Segments (USD Million) (2021-2032)
10.1.1. Europe Teff Revenue (USD Million) by Type (2021-2032)
10.1.2. Europe Teff Revenue (USD Million) by Application (2021-2032)
10.1.3. Europe Teff Revenue (USD Million) by Product (2021-2032)
By Product
Conventional Teff
Organic Teff
By Application
Flour
Bakery
Cereals
Beverages
Snacks
Others
Chapter 11. Asia Pacific Teff Analysis and Outlook
11.1. Asia Pacific Teff Revenue (USD Million), and Revenue (USD Million) by Segments (2021-2032)
11.1.1. Asia Pacific Teff Revenue (USD Million) by Type (2021-2032)
11.1.2. Asia Pacific Teff Revenue (USD Million) by Application (2021-2032)
11.1.3. Asia Pacific Teff Revenue (USD Million) by Product (2021-2032)
By Product
Conventional Teff
Organic Teff
By Application
Flour
Bakery
Cereals
Beverages
Snacks
Others
Chapter 12. South America Teff Analysis and Outlook
12.1. South America Teff Revenue (USD Million), by Segments (2021-2032)
12.1.1. South America Teff Revenue (USD Million) by Type (2021-2032)
12.1.2. South America Teff Revenue (USD Million) by Application (2021-2032)
12.1.3. South America Teff Revenue (USD Million) by Product (2021-2032)
By Product
Conventional Teff
Organic Teff
By Application
Flour
Bakery
Cereals
Beverages
Snacks
Others
Chapter 13. Middle East and Africa Teff Analysis and Outlook
13.1. Middle East and Africa Teff Revenue (USD Million), by Segments (2021-2032)
13.1.1. Middle East and Africa Teff Revenue (USD Million) by Type (2021-2032)
13.1.2. Middle East and Africa Teff Revenue (USD Million) by Application (2021-2032)
13.1.3. Middle East and Africa Teff Revenue (USD Million) by Product (2021-2032)
By Product
Conventional Teff
Organic Teff
By Application
Flour
Bakery
Cereals
Beverages
Snacks
Others
Chapter 14. Teff Company Profiles
14.1 Business Overview
14.2 Product Profiles
14.3 SWOT Profiles
14.5 Recent Developments
14.6 Financial Profile
List of Companies
Bobs Red Mill Natural Foods Inc
Ceres Enterprises Ltd
COSTA CONCENTRADOS LEVANTINOS
King Arthur Baking Company Inc
PROBIOS SpA
SHILOH FARMS
TEFFCOM
THE TEFF CO.
Tobia Teff UK Ltd
Wild For
15. Methodology and Data Sources
15.1 Customization Offerings
15.2 Subscription Services
15.3 Related Reports
15.4 Publisher Expertise
LIST OF TABLES
Table 1 Market Segmentation Analysis
Table 2 Global Teff Market Share of Leading Companies, 2023
Table 3 Product Offerings of Leading Companies
Table 4 Low Growth Scenario Forecasts
Table 5 Reference Case Growth Scenario
Table 6 High Growth Case Scenario
Table 7 Global Teff Revenue (USD Million) And CAGR (%) By Type (2021-2032)
Table 8 Global Teff Revenue (USD Million) And CAGR (%) By Application (2021-2032)
Table 9 Global Teff Revenue (USD Million) And CAGR (%) By Product (2021-2032)
Table 10 Global Teff Market Revenue (USD Million) By Regions (2021-2032)
Table 11 Global Teff Market Share (%) By Regions (2021-2032)
Table 12 North America Teff Revenue (USD Million) By Country (2021-2032)
Table 13 Europe Teff Revenue (USD Million) By Country (2021-2032)
Table 14 Asia Pacific Teff Revenue (USD Million) By Country (2021-2032)
Table 15 South America Teff Revenue (USD Million) By Country (2021-2032)
Table 16 Middle East and Africa Teff Revenue (USD Million) By Region (2021-2032)
Table 17 North America Teff Revenue (USD Million) By Type (2021-2032)
Table 18 North America Teff Revenue (USD Million) By Application (2021-2032)
Table 19 North America Teff Revenue (USD Million) By Product (2021-2032)
Table 20 Europe Teff Revenue (USD Million) By Type (2021-2032)
Table 21 Europe Teff Revenue (USD Million) By Application (2021-2032)
Table 22 Europe Teff Revenue (USD Million) By Product (2021-2032)
Table 23 Asia Pacific Teff Revenue (USD Million) By Type (2021-2032)
Table 24 Asia Pacific Teff Revenue (USD Million) By Application (2021-2032)
Table 25 Asia Pacific Teff Revenue (USD Million) By Product (2021-2032)
Table 26 South America Teff Revenue (USD Million) By Type (2021-2032)
Table 27 South America Teff Revenue (USD Million) By Application (2021-2032)
Table 28 South America Teff Revenue (USD Million) By Product (2021-2032)
Table 29 Middle East and Africa Teff Revenue (USD Million) By Type (2021-2032)
Table 30 Middle East and Africa Teff Revenue (USD Million) By Application (2021-2032)
Table 31 Middle East and Africa Teff Revenue (USD Million) By Product (2021-2032)
LIST OF FIGURES
Figure 1. Market Scope
Figure 2. Pricing Forecasts Per Unit, 2023- 2032
Figure 3. Porter’s Five Forces
Figure 4. Global Teff Market Revenue (USD Million) By Regions (2021-2032)
Figure 5. Global Teff Market Share (%) By Regions (2023)
Figure 6. North America Teff Revenue (USD Million) By Country (2021-2032)
Figure 7. United States Teff Revenue (USD Million) By Country (2021-2032)
Figure 8. Canada Teff Revenue (USD Million) By Country (2021-2032)
Figure 9. Mexico Teff Revenue (USD Million) By Country (2021-2032)
Figure 10. Europe Teff Revenue (USD Million) By Country (2021-2032)
Figure 11. Germany Teff Revenue (USD Million) By Country (2021-2032)
Figure 12. France Teff Revenue (USD Million) By Country (2021-2032)
Figure 13. United Kingdom Teff Revenue (USD Million) By Country (2021-2032)
Figure 14. Spain Teff Revenue (USD Million) By Country (2021-2032)
Figure 15. Italy Teff Revenue (USD Million) By Country (2021-2032)
Figure 16. Russia Teff Revenue (USD Million) By Country (2021-2032)
Figure 17. Rest of Europe Teff Revenue (USD Million) By Country (2021-2032)
Figure 11. Asia Pacific Teff Revenue (USD Million) By Country (2021-2032)
Figure 12. China Teff Revenue (USD Million) By Country (2021-2032)
Figure 13. Japan Teff Revenue (USD Million) By Country (2021-2032)
Figure 14. India Teff Revenue (USD Million) By Country (2021-2032)
Figure 15. South Korea Teff Revenue (USD Million) By Country (2021-2032)
Figure 16. Australia Teff Revenue (USD Million) By Country (2021-2032)
Figure 17. South East Asia Teff Revenue (USD Million) By Country (2021-2032)
Figure 18. South America Teff Revenue (USD Million) By Country (2021-2032)
Figure 19. Brazil Teff Revenue (USD Million) By Country (2021-2032)
Figure 20. Argentina Teff Revenue (USD Million) By Country (2021-2032)
Figure 21. Rest of Asia Pacific Teff Revenue (USD Million) By Country (2021-2032)
Figure 22. Middle East and Africa Teff Revenue (USD Million) By Region (2021-2032)
Figure 23. Saudi Arabia Teff Revenue (USD Million) By Region (2021-2032)
Figure 24. The UAE Teff Revenue (USD Million) By Region (2021-2032)
Figure 25. Rest of Middle East Teff Revenue (USD Million) By Region (2021-2032)
Figure 26. South Africa Teff Revenue (USD Million) By Region (2021-2032)
Figure 27. Africa Teff Revenue (USD Million) By Region (2021-2032)
Figure 28. North America Teff Revenue (USD Million) By Type (2021-2032)
Figure 29. North America Teff Revenue (USD Million) By Application (2021-2032)
Figure 30. North America Teff Revenue (USD Million) By Product (2021-2032)
Figure 31. Europe Teff Revenue (USD Million) By Type (2021-2032)
Figure 32. Europe Teff Revenue (USD Million) By Application (2021-2032)
Figure 33. Europe Teff Revenue (USD Million) By Product (2021-2032)
Figure 34. Asia Pacific Teff Revenue (USD Million) By Type (2021-2032)
Figure 35. Asia Pacific Teff Revenue (USD Million) By Application (2021-2032)
Figure 36. Asia Pacific Teff Revenue (USD Million) By Product (2021-2032)
Figure 37. South America Teff Revenue (USD Million) By Type (2021-2032)
Figure 38. South America Teff Revenue (USD Million) By Application (2021-2032)
Figure 39. South America Teff Revenue (USD Million) By Product (2021-2032)
Figure 40. Middle East and Africa Teff Revenue (USD Million) By Type (2021-2032)
Figure 41. Middle East and Africa Teff Revenue (USD Million) By Application (2021-2032)
Figure 42. Middle East and Africa Teff Revenue (USD Million) By Product (2021-2032)
By Product
Conventional Teff
Organic Teff
By Application
Flour
Bakery
Cereals
Beverages
Snacks
Others
Countries Analyzed
North America (US, Canada, Mexico)
Europe (Germany, UK, France, Spain, Italy, Russia, Rest of Europe)
Asia Pacific (China, India, Japan, South Korea, Australia, South East Asia, Rest of Asia)
South America (Brazil, Argentina, Rest of South America)
Middle East and Africa (Saudi Arabia, UAE, Rest of Middle East, South Africa, Egypt, Rest of Africa)
