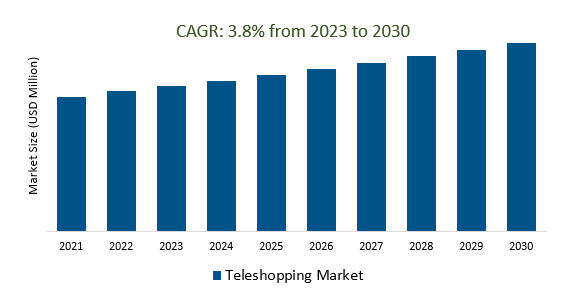
The Global Teleshopping Market Size is estimated to register 3.8% growth over the forecast period from 2023 to 2030.
The market growth is driven by increasing environmental awareness has led some teleshopping companies to focus on eco-friendly products and sustainable business practices. Leading Companies that are focusing on digital Transformation, Augmented Reality (AR) and Virtual Reality (VR), Artificial Intelligence (AI), Global Expansion, Partnerships and Collaborations, Health and Wellness Products, Regulatory Compliance, and others to boost market shares in the industry.
Market Overview
The teleshopping market, characterized by the sale of a wide range of products through television-based programs, has evolved with digital integration, personalization, live streaming, celebrity endorsements, and global expansion. Major players in the industry include QVC, HSN, and Shop LC, among others. The market has adapted to consumer preferences, offering convenience and interactive shopping experiences. Additionally, eco-friendly products, augmented reality, and compliance with regulations have become prominent trends in the teleshopping sector.
Market Dynamics
Market Trends - Live streaming and interactive shopping offer a number of benefits for teleshopping consumers, such as increased convenience, better product information, and a more engaging shopping experience.
Live streaming and interactive shopping in the teleshopping industry provide numerous advantages to consumers. First and foremost, they enhance convenience by allowing viewers to make purchases in real time, eliminating the need to visit physical stores. These formats also offer a deeper level of product information through live demonstrations and Q&A sessions, which help customers make informed decisions. Furthermore, the interactive nature of these platforms creates a more engaging shopping experience, as viewers can ask questions, receive immediate responses, and even witness products in action, all of which contribute to increased customer satisfaction and trust in the teleshopping process.
Market Driver- The growing demand for multi-channel marketing is driving the growth of the teleshopping market.
The teleshopping market is experiencing robust growth due to the increasing demand for multi-channel marketing strategies. Businesses are expanding beyond traditional television-based sales by integrating digital platforms, such as websites and mobile apps, to reach a broader audience. This multi-channel approach enhances the market's reach and convenience, allowing consumers to shop through their preferred medium, ultimately driving the overall growth of the teleshopping industry.
Market Opportunity- The introduction of home delivery has made teleshopping more convenient and accessible for consumers.
The introduction of home delivery has significantly improved the convenience and accessibility of teleshopping for consumers. By offering reliable and efficient delivery services, teleshopping companies ensure that customers can receive their ordered products at their doorstep, eliminating the need for in-person store visits. This added convenience not only saves time and effort for consumers but also aligns with the increasing consumer preference for online and at-home shopping, making teleshopping a more attractive and user-friendly retail option.
The Global Teleshopping Market is analyzed across Dedicated Channel, Infomercial, and others. Dedicated Channel is poised to register significant growth. Dedicated channel teleshopping involves round-the-clock broadcasts on specific television channels where products are presented and sold, and viewers can place orders via phone, SMS, or online platforms. It offers a wide range of consumer goods, emphasizing convenience and interactive shopping experiences. The market has evolved with digital integration, personalization, and product diversification, remaining a competitive segment within the teleshopping industry.
Market Share Analysis- Personal Care held a significant market share in 2023
The Global Teleshopping Market is analyzed across various applications including Personal Care, Cosmetics, Apparel and Accessories, Home Furnishing, and others. Of these, personal Care held a significant market share in 2023. Personal care products in the teleshopping market cover a range of health and beauty items, including skincare, cosmetics, and grooming tools, which are demonstrated and explained on television channels and online platforms. Teleshopping offers convenience and accessibility for customers seeking to purchase these products from home. Digital integration, influencer collaboration, and addressing self-care and wellness needs have driven the growth of personal care products within the teleshopping industry.
Teleshopping Market Segmentation
By Type
- Dedicated Channel
- Infomercial
By Application
- Personal Care
- Cosmetics
- Apparels and Accessories
- Home Furnishing
- Others
By Payment Mode
- Cash on Delivery
- Debit/Credit Card
- Others
By Region
- North America (United States, Canada, Mexico)
- Europe (Germany, France, United Kingdom, Spain, Italy, Others)
- Asia Pacific (China, India, Japan, South Korea, Australia, Others)
- Latin America (Brazil, Argentina, Others)
- Middle East and Africa (Saudi Arabia, UAE, Kuwait, Other Middle East, South Africa, Nigeria, Other Africa)
Teleshopping Market Companies
- EVINE Live Inc (United States)
- HSN Inc (United States)
- QVC Inc (United States)
- America's Value Channel (United States)
- Shop LC (United States)
- America's Collectibles Network Inc (United States)
- Tristar Products Inc (United States)
- Gem Shopping Network Inc (Georgia)
- Ideal Shopping Direct Ltd (United Kingdom)
*List not exhaustive
Teleshopping Market Outlook 2023
1 Market Overview
1.1 Introduction to the Teleshopping Market
1.2 Scope of the Study
1.3 Research Objective
1.3.1 Key Market Scope and Segments
1.3.2 Players Covered
1.3.3 Years Considered
2 Executive Summary
2.1 2023 Teleshopping Industry- Market Statistics
3 Market Dynamics
3.1 Market Drivers
3.2 Market Challenges
3.3 Market Opportunities
3.4 Market Trends
4 Market Factor Analysis
4.1 Porter’s Five Forces
4.2 Market Entropy
4.2.1 Global Teleshopping Market Companies with Area Served
4.2.2 Products Offerings Global Teleshopping Market
5 COVID-19 Impact Analysis and Outlook Scenarios
5.1.1 Covid-19 Impact Analysis
5.1.2 post-COVID-19 Scenario- Low Growth Case
5.1.3 post-COVID-19 Scenario- Reference Growth Case
5.1.4 post-COVID-19 Scenario- Low Growth Case
6 Global Teleshopping Market Trends
6.1 Global Teleshopping Revenue (USD Million) and CAGR (%) by Type (2018-2030)
6.2 Global Teleshopping Revenue (USD Million) and CAGR (%) by Applications (2018-2030)
6.3 Global Teleshopping Revenue (USD Million) and CAGR (%) by regions (2018-2030)
7 Global Teleshopping Market Revenue (USD Million) by Type, and Applications (2018-2022)
7.1 Global Teleshopping Revenue (USD Million) by Type (2018-2022)
7.1.1 Global Teleshopping Revenue (USD Million), Market Share (%) by Type (2018-2022)
7.2 Global Teleshopping Revenue (USD Million) by Applications (2018-2022)
7.2.1 Global Teleshopping Revenue (USD Million), Market Share (%) by Applications (2018-2022)
8 Global Teleshopping Development Regional Status and Outlook
8.1 Global Teleshopping Revenue (USD Million) By Regions (2018-2022)
8.2 North America Teleshopping Revenue (USD Million) by Type, and Application (2018-2022)
8.2.1 North America Teleshopping Revenue (USD Million) by Country (2018-2022)
8.2.2 North America Teleshopping Revenue (USD Million) by Type (2018-2022)
8.2.3 North America Teleshopping Revenue (USD Million) by Applications (2018-2022)
8.3 Europe Teleshopping Revenue (USD Million), by Type, and Applications (USD Million) (2018-2022)
8.3.1 Europe Teleshopping Revenue (USD Million), by Country (2018-2022)
8.3.2 Europe Teleshopping Revenue (USD Million) by Type (2018-2022)
8.3.3 Europe Teleshopping Revenue (USD Million) by Applications (2018-2022)
8.4 Asia Pacific Teleshopping Revenue (USD Million), and Revenue (USD Million) by Type, and Applications (2018-2022)
8.4.1 Asia Pacific Teleshopping Revenue (USD Million) by Country (2018-2022)
8.4.2 Asia Pacific Teleshopping Revenue (USD Million) by Type (2018-2022)
8.4.3 Asia Pacific Teleshopping Revenue (USD Million) by Applications (2018-2022)
8.5 South America Teleshopping Revenue (USD Million), by Type, and Applications (2018-2022)
8.5.1 South America Teleshopping Revenue (USD Million), by Country (2018-2022)
8.5.2 South America Teleshopping Revenue (USD Million) by Type (2018-2022)
8.5.3 South America Teleshopping Revenue (USD Million) by Applications (2018-2022)
8.6 Middle East and Africa Teleshopping Revenue (USD Million), by Type, Technology, Application, Thickness (2018-2022)
8.6.1 Middle East and Africa Teleshopping Revenue (USD Million) by Country (2018-2022)
8.6.2 Middle East and Africa Teleshopping Revenue (USD Million) by Type (2018-2022)
8.6.3 Middle East and Africa Teleshopping Revenue (USD Million) by Applications (2018-2022)
9 Company Profiles
10 Global Teleshopping Market Revenue (USD Million), by Type, and Applications (2023-2030)
10.1 Global Teleshopping Revenue (USD Million) and Market Share (%) by Type (2023-2030)
10.1.1 Global Teleshopping Revenue (USD Million), and Market Share (%) by Type (2023-2030)
10.2 Global Teleshopping Revenue (USD Million) and Market Share (%) by Applications (2023-2030)
10.2.1 Global Teleshopping Revenue (USD Million), and Market Share (%) by Applications (2023-2030)
11 Global Teleshopping Development Regional Status and Outlook Forecast
11.1 Global Teleshopping Revenue (USD Million) By Regions (2023-2030)
11.2 North America Teleshopping Revenue (USD Million) by Type, and Applications (2023-2030)
11.2.1 North America Teleshopping Revenue (USD) Million by Country (2023-2030)
11.2.2 North America Teleshopping Revenue (USD Million), by Type (2023-2030)
11.2.3 North America Teleshopping Revenue (USD Million), Market Share (%) by Applications (2023-2030)
11.3 Europe Teleshopping Revenue (USD Million), by Type, and Applications (2023-2030)
11.3.1 Europe Teleshopping Revenue (USD Million), by Country (2023-2030)
11.3.2 Europe Teleshopping Revenue (USD Million), by Type (2023-2030)
11.3.3 Europe Teleshopping Revenue (USD Million), by Applications (2023-2030)
11.4 Asia Pacific Teleshopping Revenue (USD Million) by Type, and Applications (2023-2030)
11.4.1 Asia Pacific Teleshopping Revenue (USD Million), by Country (2023-2030)
11.4.2 Asia Pacific Teleshopping Revenue (USD Million), by Type (2023-2030)
11.4.3 Asia Pacific Teleshopping Revenue (USD Million), by Applications (2023-2030)
11.5 South America Teleshopping Revenue (USD Million), by Type, and Applications (2023-2030)
11.5.1 South America Teleshopping Revenue (USD Million), by Country (2023-2030)
11.5.2 South America Teleshopping Revenue (USD Million), by Type (2023-2030)
11.5.3 South America Teleshopping Revenue (USD Million), by Applications (2023-2030)
11.6 Middle East and Africa Teleshopping Revenue (USD Million), by Type, and Applications (2023-2030)
11.6.1 Middle East and Africa Teleshopping Revenue (USD Million), by region (2023-2030)
11.6.2 Middle East and Africa Teleshopping Revenue (USD Million), by Type (2023-2030)
11.6.3 Middle East and Africa Teleshopping Revenue (USD Million), by Applications (2023-2030)
12 Methodology and Data Sources
12.1 Methodology/Research Approach
12.1.1 Research Programs/Design
12.1.2 Market Size Estimation
12.1.3 Market Breakdown and Data Triangulation
12.2 Data Sources
12.2.1 Secondary Sources
12.2.2 Primary Sources
12.3 Disclaimer
List of Tables
Table 1 Market Segmentation Analysis
Table 2 Global Teleshopping Market Companies with Areas Served
Table 3 Products Offerings Global Teleshopping Market
Table 4 Low Growth Scenario Forecasts
Table 5 Reference Case Growth Scenario
Table 6 High Growth Case Scenario
Table 7 Global Teleshopping Revenue (USD Million) And CAGR (%) By Type (2018-2030)
Table 8 Global Teleshopping Revenue (USD Million) And CAGR (%) By Applications (2018-2030)
Table 9 Global Teleshopping Revenue (USD Million) And CAGR (%) By Regions (2018-2030)
Table 10 Global Teleshopping Revenue (USD Million) By Type (2018-2022)
Table 11 Global Teleshopping Revenue Market Share (%) By Type (2018-2022)
Table 12 Global Teleshopping Revenue (USD Million) By Applications (2018-2022)
Table 13 Global Teleshopping Revenue Market Share (%) By Applications (2018-2022)
Table 14 Global Teleshopping Market Revenue (USD Million) By Regions (2018-2022)
Table 15 Global Teleshopping Market Share (%) By Regions (2018-2022)
Table 16 North America Teleshopping Revenue (USD Million) By Country (2018-2022)
Table 17 North America Teleshopping Revenue (USD Million) By Type (2018-2022)
Table 18 North America Teleshopping Revenue (USD Million) By Applications (2018-2022)
Table 19 Europe Teleshopping Revenue (USD Million) By Country (2018-2022)
Table 20 Europe Teleshopping Revenue (USD Million) By Type (2018-2022)
Table 21 Europe Teleshopping Revenue (USD Million) By Applications (2018-2022)
Table 22 Asia Pacific Teleshopping Revenue (USD Million) By Country (2018-2022)
Table 23 Asia Pacific Teleshopping Revenue (USD Million) By Type (2018-2022)
Table 24 Asia Pacific Teleshopping Revenue (USD Million) By Applications (2018-2022)
Table 25 South America Teleshopping Revenue (USD Million) By Country (2018-2022)
Table 26 South America Teleshopping Revenue (USD Million) By Type (2018-2022)
Table 27 South America Teleshopping Revenue (USD Million) By Applications (2018-2022)
Table 28 Middle East and Africa Teleshopping Revenue (USD Million) By Region (2018-2022)
Table 29 Middle East and Africa Teleshopping Revenue (USD Million) By Type (2018-2022)
Table 30 Middle East and Africa Teleshopping Revenue (USD Million) By Applications (2018-2022)
Table 31 Financial Analysis
Table 32 Global Teleshopping Revenue (USD Million) By Type (2023-2030)
Table 33 Global Teleshopping Revenue Market Share (%) By Type (2023-2030)
Table 34 Global Teleshopping Revenue (USD Million) By Applications (2023-2030)
Table 35 Global Teleshopping Revenue Market Share (%) By Applications (2023-2030)
Table 36 Global Teleshopping Market Revenue (USD Million), And Revenue (USD Million) By Regions (2023-2030)
Table 37 North America Teleshopping Revenue (USD)By Country (2023-2030)
Table 38 North America Teleshopping Revenue (USD Million) By Type (2023-2030)
Table 39 North America Teleshopping Revenue (USD Million) By Applications (2023-2030)
Table 40 Europe Teleshopping Revenue (USD Million) By Country (2023-2030)
Table 41 Europe Teleshopping Revenue (USD Million) By Type (2023-2030)
Table 42 Europe Teleshopping Revenue (USD Million) By Applications (2023-2030)
Table 43 Asia Pacific Teleshopping Revenue (USD Million) By Country (2023-2030)
Table 44 Asia Pacific Teleshopping Revenue (USD Million) By Type (2023-2030)
Table 45 Asia Pacific Teleshopping Revenue (USD Million) By Applications (2023-2030)
Table 46 South America Teleshopping Revenue (USD Million) By Country (2023-2030)
Table 47 South America Teleshopping Revenue (USD Million) By Type (2023-2030)
Table 48 South America Teleshopping Revenue (USD Million) By Applications (2023-2030)
Table 49 Middle East and Africa Teleshopping Revenue (USD Million) By Region (2023-2030)
Table 50 Middle East and Africa Teleshopping Revenue (USD Million) By Region (2023-2030)
Table 51 Middle East and Africa Teleshopping Revenue (USD Million) By Type (2023-2030)
Table 52 Middle East and Africa Teleshopping Revenue (USD Million) By Applications (2023-2030)
Table 53 Research Programs/Design for This Report
Table 54 Key Data Information from Secondary Sources
Table 55 Key Data Information from Primary Sources
List of Figures
Figure 1 Market Scope
Figure 2 Porter’s Five Forces
Figure 3 Global Teleshopping Revenue (USD Million) By Type (2018-2022)
Figure 4 Global Teleshopping Revenue Market Share (%) By Type (2022)
Figure 5 Global Teleshopping Revenue (USD Million) By Applications (2018-2022)
Figure 6 Global Teleshopping Revenue Market Share (%) By Applications (2022)
Figure 7 Global Teleshopping Market Revenue (USD Million) By Regions (2018-2022)
Figure 8 Global Teleshopping Market Share (%) By Regions (2022)
Figure 9 North America Teleshopping Revenue (USD Million) By Country (2018-2022)
Figure 10 North America Teleshopping Revenue (USD Million) By Type (2018-2022)
Figure 11 North America Teleshopping Revenue (USD Million) By Applications (2018-2022)
Figure 12 Europe Teleshopping Revenue (USD Million) By Country (2018-2022)
Figure 13 Europe Teleshopping Revenue (USD Million) By Type (2018-2022)
Figure 14 Europe Teleshopping Revenue (USD Million) By Applications (2018-2022)
Figure 15 Asia Pacific Teleshopping Revenue (USD Million) By Country (2018-2022)
Figure 16 Asia Pacific Teleshopping Revenue (USD Million) By Type (2018-2022)
Figure 17 Asia Pacific Teleshopping Revenue (USD Million) By Applications (2018-2022)
Figure 18 South America Teleshopping Revenue (USD Million) By Country (2018-2022)
Figure 19 South America Teleshopping Revenue (USD Million) By Type (2018-2022)
Figure 20 South America Teleshopping Revenue (USD Million) By Applications (2018-2022)
Figure 21 Middle East and Africa Teleshopping Revenue (USD Million) By Region (2018-2022)
Figure 22 Middle East and Africa Teleshopping Revenue (USD Million) By Type (2018-2022)
Figure 23 Middle East and Africa Teleshopping Revenue (USD Million) By Applications (2018-2022)
Figure 24 Global Teleshopping Revenue (USD Million) By Type (2023-2030)
Figure 25 Global Teleshopping Revenue Market Share (%) By Type (2030)
Figure 26 Global Teleshopping Revenue (USD Million) By Applications (2023-2030)
Figure 27 Global Teleshopping Revenue Market Share (%) By Applications (2030)
Figure 28 Global Teleshopping Market Revenue (USD Million) By Regions (2023-2030)
Figure 29 North America Teleshopping Revenue (USD Million) By Country (2023-2030)
Figure 30 North America Teleshopping Revenue (USD Million) By Type (2023-2030)
Figure 31 North America Teleshopping Revenue (USD Million) By Applications (2023-2030)
Figure 32 Europe Teleshopping Revenue (USD Million) By Country (2023-2030)
Figure 33 Europe Teleshopping Revenue (USD Million) By Type (2023-2030)
Figure 34 Europe Teleshopping Revenue (USD Million) By Applications (2023-2030)
Figure 35 Asia Pacific Teleshopping Revenue (USD Million) By Country (2023-2030)
Figure 36 Asia Pacific Teleshopping Revenue (USD Million) By Type (2023-2030)
Figure 37 Asia Pacific Teleshopping Revenue (USD Million) By Applications (2023-2030)
Figure 38 South America Teleshopping Revenue (USD Million) By Country (2023-2030)
Figure 39 South America Teleshopping Revenue (USD Million) By Type (2023-2030)
Figure 40 South America Teleshopping Revenue (USD Million) By Applications (2023-2030)
Figure 41 Middle East and Africa Teleshopping Revenue (USD Million) By Region (2023-2030)
Figure 42 Middle East and Africa Teleshopping Revenue (USD Million) By Region (2023-2030)
Figure 43 Middle East and Africa Teleshopping Revenue (USD Million) By Type (2023-2030)
Figure 44 Middle East and Africa Teleshopping Revenue (USD Million) By Applications (2023-2030)
Figure 45 Bottom-Up and Top-Down Approaches for This Report
Figure 46 Data Triangulation
