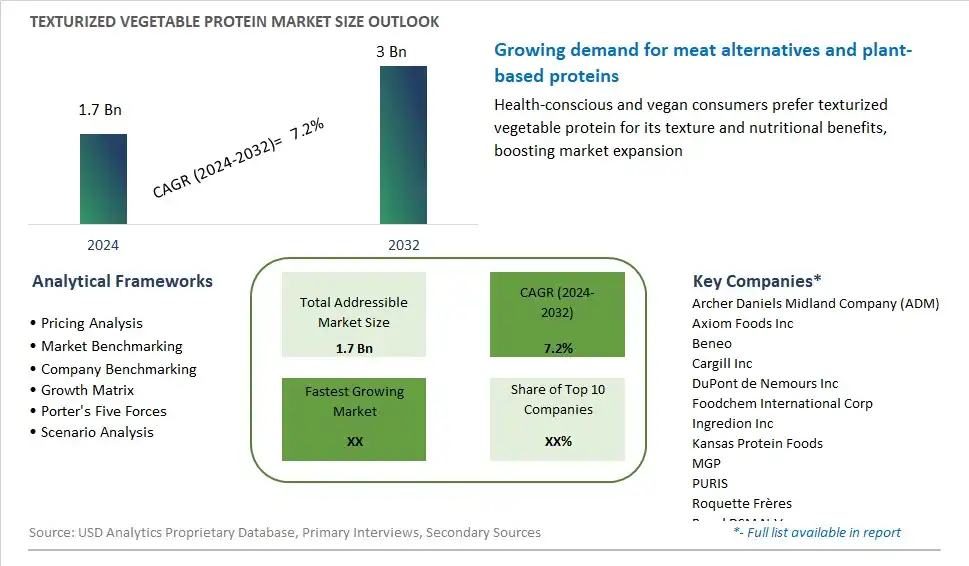
Global Texturized Vegetable Protein Market Size is valued at $1.7 Billion in 2024 and is forecast to register a growth rate (CAGR) of 7.2% to reach $3 Billion by 2032.
The global Texturized Vegetable Protein Market Comprehensive Study analyzes and forecasts the market size across 6 regions and 24 countries for diverse segments -By Type (Chunks, Flakes, Slices, Granules), By Application (Meat Alternatives, Meat Extenders, Meat Analogues, Cereals and Snacks, Others), By Source (Soy, Wheat, Pea), By Form (Dry, Wet), By Nature (Organic, Conventional)
An Introduction to Texturized Vegetable Protein Market
Texturized vegetable protein (TVP), also known as textured soy protein or soy meat, is a versatile plant-based ingredient widely used as a meat substitute in vegetarian and vegan diets. In 2024, the market for texturized vegetable protein is expanding rapidly as consumers increasingly embrace plant-centric eating habits for health, environmental, and ethical reasons. TVP is derived from defatted soy flour or soy protein concentrate and processed to mimic the texture and appearance of meat, making it a convenient and nutritious alternative in a variety of dishes, including burgers, tacos, stir-fries, and casseroles. The market is witnessing innovation with new formulations and flavor profiles to enhance the taste, texture, and nutritional profile of texturized vegetable protein products, catering to diverse dietary preferences and culinary trends. Moreover, the growing demand for sustainable and plant-based protein sources is driving investment in research and development to improve the sustainability and scalability of TVP production methods. As awareness of the health and environmental benefits of plant-based diets continues to grow, the texturized vegetable protein market is poised for continued expansion, offering a viable and flavorful alternative to conventional meat products.
Texturized Vegetable Protein Competitive Landscape
The market report analyses the leading companies in the industry including Archer Daniels Midland Company (ADM), Axiom Foods Inc, Beneo, Cargill Inc, DuPont de Nemours Inc, Foodchem International Corp, Ingredion Inc, Kansas Protein Foods, MGP, PURIS, Roquette Frères, Royal DSM N.V., Shandong Yuxin Biotechnology Co. Ltd, The Scoular Company, and Others.
Texturized Vegetable Protein Market Dynamics
Texturized Vegetable Protein Market Trend: Growing Demand for Plant-Based Protein Alternatives
The market for Texturized Vegetable Protein (TVP) is witnessing a significant trend driven by the increasing consumer shift towards plant-based protein alternatives. With rising awareness of the environmental impact of animal agriculture and the health benefits associated with plant-based diets, consumers are actively seeking protein sources derived from plants. Texturized vegetable protein offers a versatile and sustainable solution as a meat substitute, providing a source of protein that is cholesterol-free, low in fat, and rich in nutrients. This trend is further fueled by the growing adoption of vegetarian and vegan lifestyles, as well as the expanding market for plant-based food products across various segments, including meat analogs, snacks, and ready-to-eat meals.
Market Driver: Rising Health Consciousness and Dietary Preferences
The market for Texturized Vegetable Protein is primarily driven by the increasing health consciousness and evolving dietary preferences among consumers. As individuals become more mindful of their nutritional intake and seek healthier food options, there's a growing demand for protein-rich ingredients that support overall well-being and align with specific dietary requirements. Texturized vegetable protein serves as an attractive alternative to animal-based proteins for individuals looking to reduce their meat consumption, manage weight, or address dietary restrictions such as vegetarianism or veganism. Additionally, the versatility of TVP in culinary applications, its long shelf life, and cost-effectiveness contribute to its appeal among food manufacturers seeking to formulate healthier, more sustainable products to meet consumer demand.
Market Opportunity: Expansion in Food Manufacturing and Foodservice
The market for Texturized Vegetable Protein presents a significant opportunity for expansion in food manufacturing and foodservice sectors. As the demand for plant-based protein alternatives continues to rise, there's a growing opportunity for food manufacturers to incorporate texturized vegetable protein into a wide range of food products, including meat substitutes, plant-based burgers, sausages, snacks, and convenience foods. By leveraging the functional properties of TVP, such as its ability to mimic the texture and mouthfeel of meat, manufacturers can innovate and develop new product offerings that cater to diverse consumer preferences and dietary needs. Additionally, in the foodservice industry, there's an opportunity to introduce TVP-based menu items in restaurants, cafeterias, and catering services, providing consumers with more plant-based options and driving the adoption of sustainable and nutritious food choices. By capitalizing on this opportunity for expansion in food manufacturing and foodservice, companies can tap into a growing market segment and contribute to the broader shift towards plant-based eating.
Texturized Vegetable Protein Market Share Analysis: Chunks held the dominant market share in 2024
In the Texturized Vegetable Protein (TVP) Market, the Chunks segment is the largest. This dominance is primarily attributed to the versatility and widespread application of TVP chunks across various cuisines and food products. TVP chunks offer a meat-like texture and consistency, making them an ideal substitute for meat in vegetarian and vegan dishes. Their ability to absorb flavors and sauces while retaining their shape and texture makes them a popular choice among consumers and food manufacturers alike. Further, TVP chunks serve as a convenient ingredient for a wide range of recipes, including stews, casseroles, burgers, and stir-fries, contributing to their widespread acceptance and adoption. Additionally, the rising demand for plant-based protein alternatives, driven by health and sustainability concerns, further fuels the consumption of TVP chunks as a meat substitute. As a result, the Chunks segment maintains its position as the largest segment in the Texturized Vegetable Protein Market, offering a versatile and flavorful solution for meat-free meals.
Texturized Vegetable Protein Market Share Analysis: Meat Alternatives market is poised to register the fastest growth rae over the forecast period to 2032
Within the Texturized Vegetable Protein (TVP) Market, the Meat Alternatives segment is the fastest-growing. This surge is driven by the increasing consumer shift towards plant-based diets and the rising awareness of the environmental and health benefits associated with reducing meat consumption. Meat alternatives made from TVP offer a compelling solution for individuals seeking nutritious and sustainable protein sources without sacrificing taste or texture. These products closely mimic the taste, appearance, and mouthfeel of meat, making them appealing to flexitarians, vegetarians, and vegans alike. Further, the versatility of TVP allows manufacturers to create a diverse range of meat alternative products, including burgers, sausages, nuggets, and meatballs, catering to a broad spectrum of consumer preferences. Additionally, the growing availability and marketing of meat alternative products in supermarkets, restaurants, and fast-food chains further contribute to the segment's rapid growth. As consumer demand for ethical and eco-friendly food options continues to rise, the Meat Alternatives segment is poised for sustained expansion within the Texturized Vegetable Protein Market.
Texturized Vegetable Protein Market Share Analysis: Soy held the dominant market share in 2024
In the Texturized Vegetable Protein (TVP) Market, the Soy segment is the largest. This dominance is primarily attributed to soy's long-standing presence and extensive use in the global food industry. Soy-based TVP offers a rich source of plant-based protein with a texture and flavor profile that closely resembles meat, making it a popular choice among consumers seeking meat alternatives. Additionally, soy's versatility allows for the creation of a wide range of TVP products, including burgers, sausages, nuggets, and meatballs, catering to diverse dietary preferences and culinary applications. Further, soy's nutritional benefits, such as being low in fat and cholesterol-free, further contribute to its widespread acceptance and adoption. Furthermore, the availability of soy as a cost-effective and sustainable crop ensures a steady supply chain, bolstering its position as the largest segment in the Texturized Vegetable Protein Market.
Texturized Vegetable Protein Market Segmentation
By Type
Chunks
Flakes
Slices
Granules
By Application
Meat Alternatives
Meat Extenders
Meat Analogues
Cereals and Snacks
Others
By Source
Soy
Wheat
Pea
By Form
Dry
Wet
By Nature
Organic
Conventional
Countries Analyzed
North America (US, Canada, Mexico)
Europe (Germany, UK, France, Spain, Italy, Russia, Rest of Europe)
Asia Pacific (China, India, Japan, South Korea, Australia, South East Asia, Rest of Asia)
South America (Brazil, Argentina, Rest of South America)
Middle East and Africa (Saudi Arabia, UAE, Rest of Middle East, South Africa, Egypt, Rest of Africa)
Texturized Vegetable Protein Companies Profiled in the Study
Archer Daniels Midland Company (ADM)
Axiom Foods Inc
Beneo
Cargill Inc
DuPont de Nemours Inc
Foodchem International Corp
Ingredion Inc
Kansas Protein Foods
MGP
PURIS
Roquette Frères
Royal DSM N.V.
Shandong Yuxin Biotechnology Co. Ltd
The Scoular Company
*- List Not Exhaustive
Chapter 1. TABLE OF CONTENTS
Chapter 2. Introduction to Texturized Vegetable Protein Market
2.1. Market Overview
2.2. Key Statistics and Report Highlights
2.3. Scope of the Comprehensive Study
2.3.1. Market Definition
2.3.2 Countries and Regions Covered
2.3.3 Research Objective
2.3.4 Units, Currency, and Conversions
2.3.5 Industry Value Chain
2.4. Key Market Segments
2.5. Key Companies
2.6. Study Period
Chapter 3. Strategic Analysis Review
3.1. Texturized Vegetable Protein Pricing Analysis and Forecast
3.2. Porter’s Five Forces
3.3. Market Ecosystem
3.4. SWOT Analysis
3.5. Regulatory Scenario
3.3. Effects of Inflation, Russia-Ukraine War, moderating economic growth, and other macroeconomic factors
Chapter 4. Competitive Landscape
4.1. Market Share Analysis
4.1.1. Global Texturized Vegetable Protein Market Share by Company, 2023
4.1.2. Product Offerings of Leading Texturized Vegetable Protein Companies
4.2. Market Entropy
4.2.1. New Product Launches in the Industry
4.2.2. Mergers, Acquisitions, Joint ventures, and Partnerships
4.3. Key Strategies and Best Practices
Chapter 5. Global Market Projections: Best, Reference, and Low Case Scenarios
5.1. Growth Analysis- Case Scenario Definitions
5.2. Low Growth Case Scenario Forecasts
5.3. Reference Growth Case Scenario Forecasts
5.4. High Growth Case Scenario Forecasts
Chapter 6. Market Dynamics
6.1. Texturized Vegetable Protein Market Drivers
6.2. Texturized Vegetable Protein Market Challenges
6.6. Texturized Vegetable Protein Market Opportunities
6.4. Texturized Vegetable Protein Market Trends
Chapter 7. Global Texturized Vegetable Protein Market Outlook Trends
7.1. Global Texturized Vegetable Protein Revenue (USD Million) and CAGR (%) by Type (2021-2032)
7.2. Global Texturized Vegetable Protein Revenue (USD Million) and CAGR (%) by Application (2021-2032)
7.3. Global Texturized Vegetable Protein Revenue (USD Million) and CAGR (%) by Product (2021-2032)
By Type
Chunks
Flakes
Slices
Granules
By Application
Meat Alternatives
Meat Extenders
Meat Analogues
Cereals and Snacks
Others
By Source
Soy
Wheat
Pea
By Form
Dry
Wet
By Nature
Organic
Conventional
Chapter 8. Global Texturized Vegetable Protein Regional Analysis and Outlook
8.1. Global Texturized Vegetable Protein Revenue (USD Million) By Regions (2021- 2032)
8.2. North America Texturized Vegetable Protein Revenue (USD Million) by Country (2021-2032)
8.2.1. United States Texturized Vegetable Protein Regional Analysis and Outlook
8.2.2. Canada Texturized Vegetable Protein Regional Analysis and Outlook
8.2.3. Mexico Texturized Vegetable Protein Regional Analysis and Outlook
8.3. Europe Texturized Vegetable Protein Revenue (USD Million), by Country (2021-2032)
8.3.1. Germany Texturized Vegetable Protein Regional Analysis and Outlook
8.3.2. France Texturized Vegetable Protein Regional Analysis and Outlook
8.3.3. United Kingdom Texturized Vegetable Protein Regional Analysis and Outlook
8.3.4. Spain Texturized Vegetable Protein Regional Analysis and Outlook
8.3.5. Italy Texturized Vegetable Protein Regional Analysis and Outlook
8.3.6. Russia Texturized Vegetable Protein Regional Analysis and Outlook
8.3.7. Rest of Europe Texturized Vegetable Protein Regional Analysis and Outlook
8.4. Asia Pacific Texturized Vegetable Protein Revenue (USD Million) by Country (2021-2032)
8.4.1. China Texturized Vegetable Protein Regional Analysis and Outlook
8.4.2. Japan Texturized Vegetable Protein Regional Analysis and Outlook
8.4.3. India Texturized Vegetable Protein Regional Analysis and Outlook
8.4.4. South Korea Texturized Vegetable Protein Regional Analysis and Outlook
8.4.5. Australia Texturized Vegetable Protein Regional Analysis and Outlook
8.4.6. South East Asia Texturized Vegetable Protein Regional Analysis and Outlook
8.4.7. Rest of Asia Pacific Texturized Vegetable Protein Regional Analysis and Outlook
8.5. South America Texturized Vegetable Protein Revenue (USD Million), by Country (2021-2032)
8.5.1. Brazil Texturized Vegetable Protein Regional Analysis and Outlook
8.5.2. Argentina Texturized Vegetable Protein Regional Analysis and Outlook
8.5.3. Rest of South America Texturized Vegetable Protein Regional Analysis and Outlook
8.6. Middle East and Africa Texturized Vegetable Protein Revenue (USD Million) by Country (2021-2032)
8.6.1. Middle East Texturized Vegetable Protein Regional Analysis and Outlook
8.6.2. Africa Texturized Vegetable Protein Regional Analysis and Outlook
Chapter 9. North America Texturized Vegetable Protein Analysis and Outlook
9.1. North America Texturized Vegetable Protein Revenue (USD Million) by Segments (2021-2032)
9.1.1. North America Texturized Vegetable Protein Revenue (USD Million) by Type (2021-2032)
9.1.2. North America Texturized Vegetable Protein Revenue (USD Million) by Application (2021-2032)
9.1.3. North America Texturized Vegetable Protein Revenue (USD Million) by Product (2021-2032)
By Type
Chunks
Flakes
Slices
Granules
By Application
Meat Alternatives
Meat Extenders
Meat Analogues
Cereals and Snacks
Others
By Source
Soy
Wheat
Pea
By Form
Dry
Wet
By Nature
Organic
Conventional
Chapter 10. Europe Texturized Vegetable Protein Analysis and Outlook
10.1. Europe Texturized Vegetable Protein Revenue (USD Million), by Segments (USD Million) (2021-2032)
10.1.1. Europe Texturized Vegetable Protein Revenue (USD Million) by Type (2021-2032)
10.1.2. Europe Texturized Vegetable Protein Revenue (USD Million) by Application (2021-2032)
10.1.3. Europe Texturized Vegetable Protein Revenue (USD Million) by Product (2021-2032)
By Type
Chunks
Flakes
Slices
Granules
By Application
Meat Alternatives
Meat Extenders
Meat Analogues
Cereals and Snacks
Others
By Source
Soy
Wheat
Pea
By Form
Dry
Wet
By Nature
Organic
Conventional
Chapter 11. Asia Pacific Texturized Vegetable Protein Analysis and Outlook
11.1. Asia Pacific Texturized Vegetable Protein Revenue (USD Million), and Revenue (USD Million) by Segments (2021-2032)
11.1.1. Asia Pacific Texturized Vegetable Protein Revenue (USD Million) by Type (2021-2032)
11.1.2. Asia Pacific Texturized Vegetable Protein Revenue (USD Million) by Application (2021-2032)
11.1.3. Asia Pacific Texturized Vegetable Protein Revenue (USD Million) by Product (2021-2032)
By Type
Chunks
Flakes
Slices
Granules
By Application
Meat Alternatives
Meat Extenders
Meat Analogues
Cereals and Snacks
Others
By Source
Soy
Wheat
Pea
By Form
Dry
Wet
By Nature
Organic
Conventional
Chapter 12. South America Texturized Vegetable Protein Analysis and Outlook
12.1. South America Texturized Vegetable Protein Revenue (USD Million), by Segments (2021-2032)
12.1.1. South America Texturized Vegetable Protein Revenue (USD Million) by Type (2021-2032)
12.1.2. South America Texturized Vegetable Protein Revenue (USD Million) by Application (2021-2032)
12.1.3. South America Texturized Vegetable Protein Revenue (USD Million) by Product (2021-2032)
By Type
Chunks
Flakes
Slices
Granules
By Application
Meat Alternatives
Meat Extenders
Meat Analogues
Cereals and Snacks
Others
By Source
Soy
Wheat
Pea
By Form
Dry
Wet
By Nature
Organic
Conventional
Chapter 13. Middle East and Africa Texturized Vegetable Protein Analysis and Outlook
13.1. Middle East and Africa Texturized Vegetable Protein Revenue (USD Million), by Segments (2021-2032)
13.1.1. Middle East and Africa Texturized Vegetable Protein Revenue (USD Million) by Type (2021-2032)
13.1.2. Middle East and Africa Texturized Vegetable Protein Revenue (USD Million) by Application (2021-2032)
13.1.3. Middle East and Africa Texturized Vegetable Protein Revenue (USD Million) by Product (2021-2032)
By Type
Chunks
Flakes
Slices
Granules
By Application
Meat Alternatives
Meat Extenders
Meat Analogues
Cereals and Snacks
Others
By Source
Soy
Wheat
Pea
By Form
Dry
Wet
By Nature
Organic
Conventional
Chapter 14. Texturized Vegetable Protein Company Profiles
14.1 Business Overview
14.2 Product Profiles
14.3 SWOT Profiles
14.5 Recent Developments
14.6 Financial Profile
List of Companies
Archer Daniels Midland Company (ADM)
Axiom Foods Inc
Beneo
Cargill Inc
DuPont de Nemours Inc
Foodchem International Corp
Ingredion Inc
Kansas Protein Foods
MGP
PURIS
Roquette Frères
Royal DSM N.V.
Shandong Yuxin Biotechnology Co. Ltd
The Scoular Company
15. Methodology and Data Sources
15.1 Customization Offerings
15.2 Subscription Services
15.3 Related Reports
15.4 Publisher Expertise
LIST OF TABLES
Table 1 Market Segmentation Analysis
Table 2 Global Texturized Vegetable Protein Market Share of Leading Companies, 2023
Table 3 Product Offerings of Leading Companies
Table 4 Low Growth Scenario Forecasts
Table 5 Reference Case Growth Scenario
Table 6 High Growth Case Scenario
Table 7 Global Texturized Vegetable Protein Revenue (USD Million) And CAGR (%) By Type (2021-2032)
Table 8 Global Texturized Vegetable Protein Revenue (USD Million) And CAGR (%) By Application (2021-2032)
Table 9 Global Texturized Vegetable Protein Revenue (USD Million) And CAGR (%) By Product (2021-2032)
Table 10 Global Texturized Vegetable Protein Market Revenue (USD Million) By Regions (2021-2032)
Table 11 Global Texturized Vegetable Protein Market Share (%) By Regions (2021-2032)
Table 12 North America Texturized Vegetable Protein Revenue (USD Million) By Country (2021-2032)
Table 13 Europe Texturized Vegetable Protein Revenue (USD Million) By Country (2021-2032)
Table 14 Asia Pacific Texturized Vegetable Protein Revenue (USD Million) By Country (2021-2032)
Table 15 South America Texturized Vegetable Protein Revenue (USD Million) By Country (2021-2032)
Table 16 Middle East and Africa Texturized Vegetable Protein Revenue (USD Million) By Region (2021-2032)
Table 17 North America Texturized Vegetable Protein Revenue (USD Million) By Type (2021-2032)
Table 18 North America Texturized Vegetable Protein Revenue (USD Million) By Application (2021-2032)
Table 19 North America Texturized Vegetable Protein Revenue (USD Million) By Product (2021-2032)
Table 20 Europe Texturized Vegetable Protein Revenue (USD Million) By Type (2021-2032)
Table 21 Europe Texturized Vegetable Protein Revenue (USD Million) By Application (2021-2032)
Table 22 Europe Texturized Vegetable Protein Revenue (USD Million) By Product (2021-2032)
Table 23 Asia Pacific Texturized Vegetable Protein Revenue (USD Million) By Type (2021-2032)
Table 24 Asia Pacific Texturized Vegetable Protein Revenue (USD Million) By Application (2021-2032)
Table 25 Asia Pacific Texturized Vegetable Protein Revenue (USD Million) By Product (2021-2032)
Table 26 South America Texturized Vegetable Protein Revenue (USD Million) By Type (2021-2032)
Table 27 South America Texturized Vegetable Protein Revenue (USD Million) By Application (2021-2032)
Table 28 South America Texturized Vegetable Protein Revenue (USD Million) By Product (2021-2032)
Table 29 Middle East and Africa Texturized Vegetable Protein Revenue (USD Million) By Type (2021-2032)
Table 30 Middle East and Africa Texturized Vegetable Protein Revenue (USD Million) By Application (2021-2032)
Table 31 Middle East and Africa Texturized Vegetable Protein Revenue (USD Million) By Product (2021-2032)
LIST OF FIGURES
Figure 1. Market Scope
Figure 2. Pricing Forecasts Per Unit, 2023- 2032
Figure 3. Porter’s Five Forces
Figure 4. Global Texturized Vegetable Protein Market Revenue (USD Million) By Regions (2021-2032)
Figure 5. Global Texturized Vegetable Protein Market Share (%) By Regions (2023)
Figure 6. North America Texturized Vegetable Protein Revenue (USD Million) By Country (2021-2032)
Figure 7. United States Texturized Vegetable Protein Revenue (USD Million) By Country (2021-2032)
Figure 8. Canada Texturized Vegetable Protein Revenue (USD Million) By Country (2021-2032)
Figure 9. Mexico Texturized Vegetable Protein Revenue (USD Million) By Country (2021-2032)
Figure 10. Europe Texturized Vegetable Protein Revenue (USD Million) By Country (2021-2032)
Figure 11. Germany Texturized Vegetable Protein Revenue (USD Million) By Country (2021-2032)
Figure 12. France Texturized Vegetable Protein Revenue (USD Million) By Country (2021-2032)
Figure 13. United Kingdom Texturized Vegetable Protein Revenue (USD Million) By Country (2021-2032)
Figure 14. Spain Texturized Vegetable Protein Revenue (USD Million) By Country (2021-2032)
Figure 15. Italy Texturized Vegetable Protein Revenue (USD Million) By Country (2021-2032)
Figure 16. Russia Texturized Vegetable Protein Revenue (USD Million) By Country (2021-2032)
Figure 17. Rest of Europe Texturized Vegetable Protein Revenue (USD Million) By Country (2021-2032)
Figure 11. Asia Pacific Texturized Vegetable Protein Revenue (USD Million) By Country (2021-2032)
Figure 12. China Texturized Vegetable Protein Revenue (USD Million) By Country (2021-2032)
Figure 13. Japan Texturized Vegetable Protein Revenue (USD Million) By Country (2021-2032)
Figure 14. India Texturized Vegetable Protein Revenue (USD Million) By Country (2021-2032)
Figure 15. South Korea Texturized Vegetable Protein Revenue (USD Million) By Country (2021-2032)
Figure 16. Australia Texturized Vegetable Protein Revenue (USD Million) By Country (2021-2032)
Figure 17. South East Asia Texturized Vegetable Protein Revenue (USD Million) By Country (2021-2032)
Figure 18. South America Texturized Vegetable Protein Revenue (USD Million) By Country (2021-2032)
Figure 19. Brazil Texturized Vegetable Protein Revenue (USD Million) By Country (2021-2032)
Figure 20. Argentina Texturized Vegetable Protein Revenue (USD Million) By Country (2021-2032)
Figure 21. Rest of Asia Pacific Texturized Vegetable Protein Revenue (USD Million) By Country (2021-2032)
Figure 22. Middle East and Africa Texturized Vegetable Protein Revenue (USD Million) By Region (2021-2032)
Figure 23. Saudi Arabia Texturized Vegetable Protein Revenue (USD Million) By Region (2021-2032)
Figure 24. The UAE Texturized Vegetable Protein Revenue (USD Million) By Region (2021-2032)
Figure 25. Rest of Middle East Texturized Vegetable Protein Revenue (USD Million) By Region (2021-2032)
Figure 26. South Africa Texturized Vegetable Protein Revenue (USD Million) By Region (2021-2032)
Figure 27. Africa Texturized Vegetable Protein Revenue (USD Million) By Region (2021-2032)
Figure 28. North America Texturized Vegetable Protein Revenue (USD Million) By Type (2021-2032)
Figure 29. North America Texturized Vegetable Protein Revenue (USD Million) By Application (2021-2032)
Figure 30. North America Texturized Vegetable Protein Revenue (USD Million) By Product (2021-2032)
Figure 31. Europe Texturized Vegetable Protein Revenue (USD Million) By Type (2021-2032)
Figure 32. Europe Texturized Vegetable Protein Revenue (USD Million) By Application (2021-2032)
Figure 33. Europe Texturized Vegetable Protein Revenue (USD Million) By Product (2021-2032)
Figure 34. Asia Pacific Texturized Vegetable Protein Revenue (USD Million) By Type (2021-2032)
Figure 35. Asia Pacific Texturized Vegetable Protein Revenue (USD Million) By Application (2021-2032)
Figure 36. Asia Pacific Texturized Vegetable Protein Revenue (USD Million) By Product (2021-2032)
Figure 37. South America Texturized Vegetable Protein Revenue (USD Million) By Type (2021-2032)
Figure 38. South America Texturized Vegetable Protein Revenue (USD Million) By Application (2021-2032)
Figure 39. South America Texturized Vegetable Protein Revenue (USD Million) By Product (2021-2032)
Figure 40. Middle East and Africa Texturized Vegetable Protein Revenue (USD Million) By Type (2021-2032)
Figure 41. Middle East and Africa Texturized Vegetable Protein Revenue (USD Million) By Application (2021-2032)
Figure 42. Middle East and Africa Texturized Vegetable Protein Revenue (USD Million) By Product (2021-2032)
By Type
Chunks
Flakes
Slices
Granules
By Application
Meat Alternatives
Meat Extenders
Meat Analogues
Cereals and Snacks
Others
By Source
Soy
Wheat
Pea
By Form
Dry
Wet
By Nature
Organic
Conventional
Countries Analyzed
North America (US, Canada, Mexico)
Europe (Germany, UK, France, Spain, Italy, Russia, Rest of Europe)
Asia Pacific (China, India, Japan, South Korea, Australia, South East Asia, Rest of Asia)
South America (Brazil, Argentina, Rest of South America)
Middle East and Africa (Saudi Arabia, UAE, Rest of Middle East, South Africa, Egypt, Rest of Africa)
