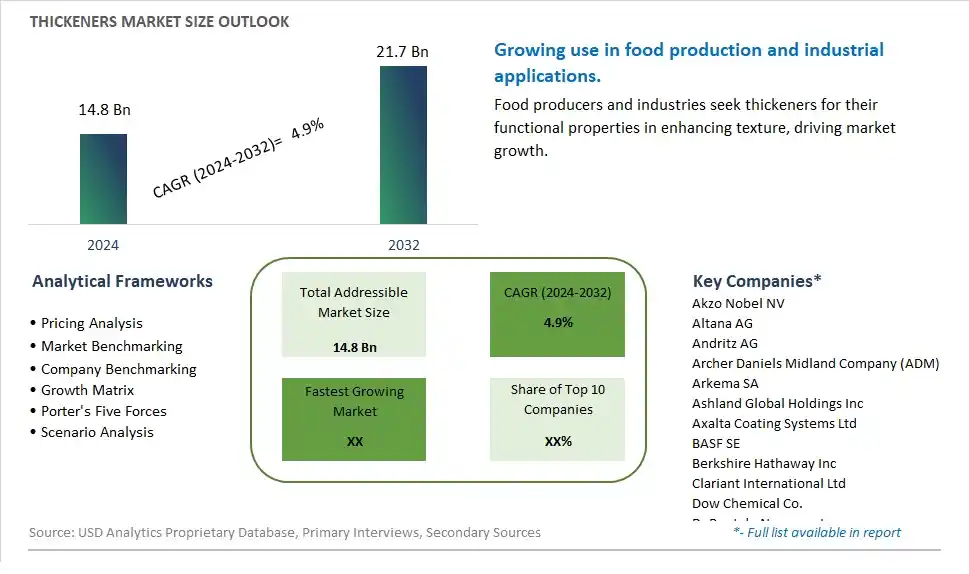
Global Thickeners Market Size is valued at $14.8 Billion in 2024 and is forecast to register a growth rate (CAGR) of 4.9% to reach $21.7 Billion by 2032.
The global Thickeners Market Comprehensive Study analyzes and forecasts the market size across 6 regions and 24 countries for diverse segments -By Type (Organic, Inorganic), By End-User (Building and Construction, Automotive, Packaging, Others)
An Introduction to Thickeners Market
In 2024, the market for thickeners is experiencing significant expansion across various industries, including food and beverage, pharmaceuticals, and cosmetics. Thickeners play a crucial role in enhancing texture, stability, and viscosity in a wide range of products, from soups and sauces to medications and personal care items. The growing demand for natural and clean label ingredients has prompted manufacturers to explore plant-based and clean label thickeners such as agar-agar, guar gum, and xanthan gum. Additionally, technological advancements have led to the development of novel thickeners with improved functionality and compatibility, catering to evolving consumer preferences and industry requirements.
Thickeners Competitive Landscape
The market report analyses the leading companies in the industry including Akzo Nobel NV, Altana AG, Andritz AG, Archer Daniels Midland Company (ADM), Arkema SA, Ashland Global Holdings Inc, Axalta Coating Systems Ltd, BASF SE, Berkshire Hathaway Inc, Clariant International Ltd, Dow Chemical Co., DuPont de Nemours Inc, Eastman Chemical Co., Henkel AG & Co. KGaA, J M Huber Corp, Nouryon Chemicals Holding BV, PPG Industries Inc, RAG Stiftung, Standard Industries Inc , Sumitomo Chemical Co. Ltd, and Others.
Thickeners Market Dynamics
Thickeners Market Trend: Increased Demand for Clean Label and Natural Ingredients
One prominent market trend in the thickeners industry is the increased demand for clean label and natural ingredients. As consumers become more health-conscious and seek transparency in food labeling, there is a growing preference for thickeners derived from natural sources such as plants, seaweed, and microbial sources, as opposed to synthetic or chemically modified options. This trend is driven by factors such as rising awareness of health and wellness, clean eating movements, and the desire for minimally processed foods. Manufacturers are responding by reformulating products to replace artificial thickeners with natural alternatives, positioning natural thickeners as a key component in clean label formulations across various food and beverage categories.
Market Driver: Expansion of Convenience and Processed Food Industries
A key market driver for thickeners is the expansion of convenience and processed food industries. As busy lifestyles and urbanization drive the demand for convenient and ready-to-eat foods, there is a growing need for thickeners to enhance texture, stability, and mouthfeel in processed food products such as sauces, soups, dressings, and desserts. This driver is reinforced by factors such as changing dietary habits, increasing urbanization, and the globalization of food preferences, which have fueled the growth of the convenience food sector worldwide. Thickeners play a crucial role in improving the sensory attributes and shelf-life of processed foods, driving their widespread adoption by food manufacturers seeking to meet consumer demand for convenient and appealing food products.
Market Opportunity: Innovation in Functional and Plant-Based Thickeners
The growing demand for thickeners presents a significant opportunity for innovation in functional and plant-based thickeners. Manufacturers and ingredient suppliers can capitalize on this trend by developing new thickeners with enhanced functionality, such as improved texture modification, stability, and nutritional benefits. This opportunity includes exploring novel sources of thickeners, such as plant-based gums, starches, and fibers, as well as innovative extraction and processing techniques to enhance the performance and versatility of thickeners in food applications. Additionally, there is potential for market expansion into new product categories such as plant-based meat alternatives, dairy-free products, and clean label formulations, where functional and plant-based thickeners can offer unique solutions to meet consumer preferences for healthier and sustainable food options. By investing in research and development and exploring emerging trends in the food industry, stakeholders in the thickeners market can seize opportunities for growth, differentiation, and market leadership in the evolving landscape of food formulation and ingredient innovation.
Thickeners Market Share Analysis: Inorganic held the dominant market share in 2024
Within the thickeners market, the inorganic segment stands as the largest, driven by several pivotal factors. Inorganic thickeners, such as modified starches and synthetic polymers, are widely used in various industries due to their cost-effectiveness, versatility, and stability in a wide range of applications. These thickeners offer manufacturers consistent performance and functionality, making them preferred choices for food, pharmaceutical, and industrial applications. Further, inorganic thickeners often have longer shelf lives and greater resistance to temperature and pH variations compared to organic alternatives, enhancing their suitability for use in diverse formulations. Additionally, the abundance and availability of raw materials for inorganic thickeners contribute to their dominance in the market. Overall, these factors drive the widespread adoption and dominance of the inorganic segment in the thickeners market.
Thickeners Market Share Analysis: Packaging market is poised to register the fastest growth rae over the forecast period to 2032
Among the end-users in the thickeners market, the packaging segment is the fastest-growing, driven by several key factors. Thickeners play a crucial role in the formulation of various packaging materials, including adhesives, coatings, and inks, where they enhance viscosity, improve stability, and provide better flow properties. With the increasing demand for sustainable and eco-friendly packaging solutions, there is a growing need for thickeners that can be incorporated into water-based and solvent-free formulations, reducing environmental impact. Additionally, the rise of e-commerce and food delivery services has spurred the demand for packaging materials that can withstand rigorous handling and transportation while maintaining product integrity. Thickeners enable the production of coatings and adhesives that offer strong bonding and protection for packaged goods. Further, advancements in packaging technology and the growing emphasis on product differentiation drive the innovation and adoption of specialty thickeners tailored to specific packaging applications. As manufacturers strive to meet evolving consumer demands for efficient and sustainable packaging solutions, the packaging segment experiences rapid expansion, reshaping the landscape of the thickeners market.
Thickeners Market Segmentation
By Type
Organic
Inorganic
By End-User
Building and Construction
Automotive
Packaging
Others
Countries Analyzed
North America (US, Canada, Mexico)
Europe (Germany, UK, France, Spain, Italy, Russia, Rest of Europe)
Asia Pacific (China, India, Japan, South Korea, Australia, South East Asia, Rest of Asia)
South America (Brazil, Argentina, Rest of South America)
Middle East and Africa (Saudi Arabia, UAE, Rest of Middle East, South Africa, Egypt, Rest of Africa)
Thickeners Companies Profiled in the Study
Akzo Nobel NV
Altana AG
Andritz AG
Archer Daniels Midland Company (ADM)
Arkema SA
Ashland Global Holdings Inc
Axalta Coating Systems Ltd
BASF SE
Berkshire Hathaway Inc
Clariant International Ltd
Dow Chemical Co.
DuPont de Nemours Inc
Eastman Chemical Co.
Henkel AG & Co. KGaA
J M Huber Corp
Nouryon Chemicals Holding BV
PPG Industries Inc
RAG Stiftung
Standard Industries Inc
Sumitomo Chemical Co. Ltd
*- List Not Exhaustive
Chapter 1. TABLE OF CONTENTS
Chapter 2. Introduction to Thickeners Market
2.1. Market Overview
2.2. Key Statistics and Report Highlights
2.3. Scope of the Comprehensive Study
2.3.1. Market Definition
2.3.2 Countries and Regions Covered
2.3.3 Research Objective
2.3.4 Units, Currency, and Conversions
2.3.5 Industry Value Chain
2.4. Key Market Segments
2.5. Key Companies
2.6. Study Period
Chapter 3. Strategic Analysis Review
3.1. Thickeners Pricing Analysis and Forecast
3.2. Porter’s Five Forces
3.3. Market Ecosystem
3.4. SWOT Analysis
3.5. Regulatory Scenario
3.3. Effects of Inflation, Russia-Ukraine War, moderating economic growth, and other macroeconomic factors
Chapter 4. Competitive Landscape
4.1. Market Share Analysis
4.1.1. Global Thickeners Market Share by Company, 2023
4.1.2. Product Offerings of Leading Thickeners Companies
4.2. Market Entropy
4.2.1. New Product Launches in the Industry
4.2.2. Mergers, Acquisitions, Joint ventures, and Partnerships
4.3. Key Strategies and Best Practices
Chapter 5. Global Market Projections: Best, Reference, and Low Case Scenarios
5.1. Growth Analysis- Case Scenario Definitions
5.2. Low Growth Case Scenario Forecasts
5.3. Reference Growth Case Scenario Forecasts
5.4. High Growth Case Scenario Forecasts
Chapter 6. Market Dynamics
6.1. Thickeners Market Drivers
6.2. Thickeners Market Challenges
6.6. Thickeners Market Opportunities
6.4. Thickeners Market Trends
Chapter 7. Global Thickeners Market Outlook Trends
7.1. Global Thickeners Revenue (USD Million) and CAGR (%) by Type (2021-2032)
7.2. Global Thickeners Revenue (USD Million) and CAGR (%) by Application (2021-2032)
7.3. Global Thickeners Revenue (USD Million) and CAGR (%) by Product (2021-2032)
By Type
Organic
Inorganic
By End-User
Building and Construction
Automotive
Packaging
Others
Chapter 8. Global Thickeners Regional Analysis and Outlook
8.1. Global Thickeners Revenue (USD Million) By Regions (2021- 2032)
8.2. North America Thickeners Revenue (USD Million) by Country (2021-2032)
8.2.1. United States Thickeners Regional Analysis and Outlook
8.2.2. Canada Thickeners Regional Analysis and Outlook
8.2.3. Mexico Thickeners Regional Analysis and Outlook
8.3. Europe Thickeners Revenue (USD Million), by Country (2021-2032)
8.3.1. Germany Thickeners Regional Analysis and Outlook
8.3.2. France Thickeners Regional Analysis and Outlook
8.3.3. United Kingdom Thickeners Regional Analysis and Outlook
8.3.4. Spain Thickeners Regional Analysis and Outlook
8.3.5. Italy Thickeners Regional Analysis and Outlook
8.3.6. Russia Thickeners Regional Analysis and Outlook
8.3.7. Rest of Europe Thickeners Regional Analysis and Outlook
8.4. Asia Pacific Thickeners Revenue (USD Million) by Country (2021-2032)
8.4.1. China Thickeners Regional Analysis and Outlook
8.4.2. Japan Thickeners Regional Analysis and Outlook
8.4.3. India Thickeners Regional Analysis and Outlook
8.4.4. South Korea Thickeners Regional Analysis and Outlook
8.4.5. Australia Thickeners Regional Analysis and Outlook
8.4.6. South East Asia Thickeners Regional Analysis and Outlook
8.4.7. Rest of Asia Pacific Thickeners Regional Analysis and Outlook
8.5. South America Thickeners Revenue (USD Million), by Country (2021-2032)
8.5.1. Brazil Thickeners Regional Analysis and Outlook
8.5.2. Argentina Thickeners Regional Analysis and Outlook
8.5.3. Rest of South America Thickeners Regional Analysis and Outlook
8.6. Middle East and Africa Thickeners Revenue (USD Million) by Country (2021-2032)
8.6.1. Middle East Thickeners Regional Analysis and Outlook
8.6.2. Africa Thickeners Regional Analysis and Outlook
Chapter 9. North America Thickeners Analysis and Outlook
9.1. North America Thickeners Revenue (USD Million) by Segments (2021-2032)
9.1.1. North America Thickeners Revenue (USD Million) by Type (2021-2032)
9.1.2. North America Thickeners Revenue (USD Million) by Application (2021-2032)
9.1.3. North America Thickeners Revenue (USD Million) by Product (2021-2032)
By Type
Organic
Inorganic
By End-User
Building and Construction
Automotive
Packaging
Others
Chapter 10. Europe Thickeners Analysis and Outlook
10.1. Europe Thickeners Revenue (USD Million), by Segments (USD Million) (2021-2032)
10.1.1. Europe Thickeners Revenue (USD Million) by Type (2021-2032)
10.1.2. Europe Thickeners Revenue (USD Million) by Application (2021-2032)
10.1.3. Europe Thickeners Revenue (USD Million) by Product (2021-2032)
By Type
Organic
Inorganic
By End-User
Building and Construction
Automotive
Packaging
Others
Chapter 11. Asia Pacific Thickeners Analysis and Outlook
11.1. Asia Pacific Thickeners Revenue (USD Million), and Revenue (USD Million) by Segments (2021-2032)
11.1.1. Asia Pacific Thickeners Revenue (USD Million) by Type (2021-2032)
11.1.2. Asia Pacific Thickeners Revenue (USD Million) by Application (2021-2032)
11.1.3. Asia Pacific Thickeners Revenue (USD Million) by Product (2021-2032)
By Type
Organic
Inorganic
By End-User
Building and Construction
Automotive
Packaging
Others
Chapter 12. South America Thickeners Analysis and Outlook
12.1. South America Thickeners Revenue (USD Million), by Segments (2021-2032)
12.1.1. South America Thickeners Revenue (USD Million) by Type (2021-2032)
12.1.2. South America Thickeners Revenue (USD Million) by Application (2021-2032)
12.1.3. South America Thickeners Revenue (USD Million) by Product (2021-2032)
By Type
Organic
Inorganic
By End-User
Building and Construction
Automotive
Packaging
Others
Chapter 13. Middle East and Africa Thickeners Analysis and Outlook
13.1. Middle East and Africa Thickeners Revenue (USD Million), by Segments (2021-2032)
13.1.1. Middle East and Africa Thickeners Revenue (USD Million) by Type (2021-2032)
13.1.2. Middle East and Africa Thickeners Revenue (USD Million) by Application (2021-2032)
13.1.3. Middle East and Africa Thickeners Revenue (USD Million) by Product (2021-2032)
By Type
Organic
Inorganic
By End-User
Building and Construction
Automotive
Packaging
Others
Chapter 14. Thickeners Company Profiles
14.1 Business Overview
14.2 Product Profiles
14.3 SWOT Profiles
14.5 Recent Developments
14.6 Financial Profile
List of Companies
Akzo Nobel NV
Altana AG
Andritz AG
Archer Daniels Midland Company (ADM)
Arkema SA
Ashland Global Holdings Inc
Axalta Coating Systems Ltd
BASF SE
Berkshire Hathaway Inc
Clariant International Ltd
Dow Chemical Co.
DuPont de Nemours Inc
Eastman Chemical Co.
Henkel AG & Co. KGaA
J M Huber Corp
Nouryon Chemicals Holding BV
PPG Industries Inc
RAG Stiftung
Standard Industries Inc
Sumitomo Chemical Co. Ltd
15. Methodology and Data Sources
15.1 Customization Offerings
15.2 Subscription Services
15.3 Related Reports
15.4 Publisher Expertise
LIST OF TABLES
Table 1 Market Segmentation Analysis
Table 2 Global Thickeners Market Share of Leading Companies, 2023
Table 3 Product Offerings of Leading Companies
Table 4 Low Growth Scenario Forecasts
Table 5 Reference Case Growth Scenario
Table 6 High Growth Case Scenario
Table 7 Global Thickeners Revenue (USD Million) And CAGR (%) By Type (2021-2032)
Table 8 Global Thickeners Revenue (USD Million) And CAGR (%) By Application (2021-2032)
Table 9 Global Thickeners Revenue (USD Million) And CAGR (%) By Product (2021-2032)
Table 10 Global Thickeners Market Revenue (USD Million) By Regions (2021-2032)
Table 11 Global Thickeners Market Share (%) By Regions (2021-2032)
Table 12 North America Thickeners Revenue (USD Million) By Country (2021-2032)
Table 13 Europe Thickeners Revenue (USD Million) By Country (2021-2032)
Table 14 Asia Pacific Thickeners Revenue (USD Million) By Country (2021-2032)
Table 15 South America Thickeners Revenue (USD Million) By Country (2021-2032)
Table 16 Middle East and Africa Thickeners Revenue (USD Million) By Region (2021-2032)
Table 17 North America Thickeners Revenue (USD Million) By Type (2021-2032)
Table 18 North America Thickeners Revenue (USD Million) By Application (2021-2032)
Table 19 North America Thickeners Revenue (USD Million) By Product (2021-2032)
Table 20 Europe Thickeners Revenue (USD Million) By Type (2021-2032)
Table 21 Europe Thickeners Revenue (USD Million) By Application (2021-2032)
Table 22 Europe Thickeners Revenue (USD Million) By Product (2021-2032)
Table 23 Asia Pacific Thickeners Revenue (USD Million) By Type (2021-2032)
Table 24 Asia Pacific Thickeners Revenue (USD Million) By Application (2021-2032)
Table 25 Asia Pacific Thickeners Revenue (USD Million) By Product (2021-2032)
Table 26 South America Thickeners Revenue (USD Million) By Type (2021-2032)
Table 27 South America Thickeners Revenue (USD Million) By Application (2021-2032)
Table 28 South America Thickeners Revenue (USD Million) By Product (2021-2032)
Table 29 Middle East and Africa Thickeners Revenue (USD Million) By Type (2021-2032)
Table 30 Middle East and Africa Thickeners Revenue (USD Million) By Application (2021-2032)
Table 31 Middle East and Africa Thickeners Revenue (USD Million) By Product (2021-2032)
LIST OF FIGURES
Figure 1. Market Scope
Figure 2. Pricing Forecasts Per Unit, 2023- 2032
Figure 3. Porter’s Five Forces
Figure 4. Global Thickeners Market Revenue (USD Million) By Regions (2021-2032)
Figure 5. Global Thickeners Market Share (%) By Regions (2023)
Figure 6. North America Thickeners Revenue (USD Million) By Country (2021-2032)
Figure 7. United States Thickeners Revenue (USD Million) By Country (2021-2032)
Figure 8. Canada Thickeners Revenue (USD Million) By Country (2021-2032)
Figure 9. Mexico Thickeners Revenue (USD Million) By Country (2021-2032)
Figure 10. Europe Thickeners Revenue (USD Million) By Country (2021-2032)
Figure 11. Germany Thickeners Revenue (USD Million) By Country (2021-2032)
Figure 12. France Thickeners Revenue (USD Million) By Country (2021-2032)
Figure 13. United Kingdom Thickeners Revenue (USD Million) By Country (2021-2032)
Figure 14. Spain Thickeners Revenue (USD Million) By Country (2021-2032)
Figure 15. Italy Thickeners Revenue (USD Million) By Country (2021-2032)
Figure 16. Russia Thickeners Revenue (USD Million) By Country (2021-2032)
Figure 17. Rest of Europe Thickeners Revenue (USD Million) By Country (2021-2032)
Figure 11. Asia Pacific Thickeners Revenue (USD Million) By Country (2021-2032)
Figure 12. China Thickeners Revenue (USD Million) By Country (2021-2032)
Figure 13. Japan Thickeners Revenue (USD Million) By Country (2021-2032)
Figure 14. India Thickeners Revenue (USD Million) By Country (2021-2032)
Figure 15. South Korea Thickeners Revenue (USD Million) By Country (2021-2032)
Figure 16. Australia Thickeners Revenue (USD Million) By Country (2021-2032)
Figure 17. South East Asia Thickeners Revenue (USD Million) By Country (2021-2032)
Figure 18. South America Thickeners Revenue (USD Million) By Country (2021-2032)
Figure 19. Brazil Thickeners Revenue (USD Million) By Country (2021-2032)
Figure 20. Argentina Thickeners Revenue (USD Million) By Country (2021-2032)
Figure 21. Rest of Asia Pacific Thickeners Revenue (USD Million) By Country (2021-2032)
Figure 22. Middle East and Africa Thickeners Revenue (USD Million) By Region (2021-2032)
Figure 23. Saudi Arabia Thickeners Revenue (USD Million) By Region (2021-2032)
Figure 24. The UAE Thickeners Revenue (USD Million) By Region (2021-2032)
Figure 25. Rest of Middle East Thickeners Revenue (USD Million) By Region (2021-2032)
Figure 26. South Africa Thickeners Revenue (USD Million) By Region (2021-2032)
Figure 27. Africa Thickeners Revenue (USD Million) By Region (2021-2032)
Figure 28. North America Thickeners Revenue (USD Million) By Type (2021-2032)
Figure 29. North America Thickeners Revenue (USD Million) By Application (2021-2032)
Figure 30. North America Thickeners Revenue (USD Million) By Product (2021-2032)
Figure 31. Europe Thickeners Revenue (USD Million) By Type (2021-2032)
Figure 32. Europe Thickeners Revenue (USD Million) By Application (2021-2032)
Figure 33. Europe Thickeners Revenue (USD Million) By Product (2021-2032)
Figure 34. Asia Pacific Thickeners Revenue (USD Million) By Type (2021-2032)
Figure 35. Asia Pacific Thickeners Revenue (USD Million) By Application (2021-2032)
Figure 36. Asia Pacific Thickeners Revenue (USD Million) By Product (2021-2032)
Figure 37. South America Thickeners Revenue (USD Million) By Type (2021-2032)
Figure 38. South America Thickeners Revenue (USD Million) By Application (2021-2032)
Figure 39. South America Thickeners Revenue (USD Million) By Product (2021-2032)
Figure 40. Middle East and Africa Thickeners Revenue (USD Million) By Type (2021-2032)
Figure 41. Middle East and Africa Thickeners Revenue (USD Million) By Application (2021-2032)
Figure 42. Middle East and Africa Thickeners Revenue (USD Million) By Product (2021-2032)
By Type
Organic
Inorganic
By End-User
Building and Construction
Automotive
Packaging
Others
Countries Analyzed
North America (US, Canada, Mexico)
Europe (Germany, UK, France, Spain, Italy, Russia, Rest of Europe)
Asia Pacific (China, India, Japan, South Korea, Australia, South East Asia, Rest of Asia)
South America (Brazil, Argentina, Rest of South America)
Middle East and Africa (Saudi Arabia, UAE, Rest of Middle East, South Africa, Egypt, Rest of Africa)
