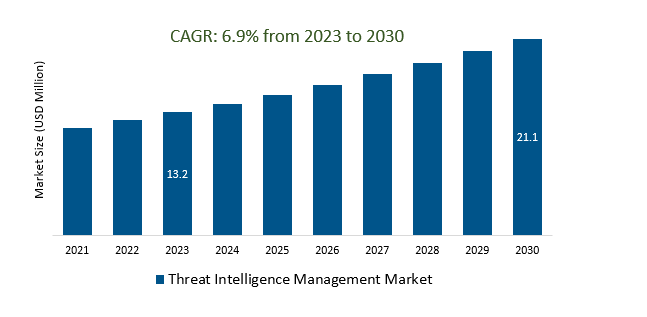
The global Threat Intelligence Management Market Size is estimated to be US$ 13.2 Billion in 2023 and is poised to register 6.9% growth over the forecast period from 2023 to 2030 to grow US$ 21.1 billion in 2030
The market growth is driven by Increasing number and sophistication of cyber threats, including ransomware, data breaches, and advanced persistent threats (APTs), are driving the need for effective threat intelligence management solutions. Leading companies that are focusing on Increasing Cyber Threat Complexity, IoT and Edge Computing Security, AI and ML Advancements, Regulatory Compliance, Emerging Threat Vectors, and others to boost market shares in the industry.
Market Overview
The Threat Intelligence Management Market encompasses the collection, analysis, and dissemination of cybersecurity threat data to help organizations identify and respond to cyber threats effectively. Driven by the rising complexity of cyber threats, regulatory compliance requirements, digital transformation, cloud adoption, IoT security challenges, and the shift to zero-trust models, this market is segmented by threat intelligence type, deployment mode, organization size, vertical, and region. Key players include IBM, McAfee, Palo Alto Networks, and others. Challenges include data management and the shortage of skilled professionals. The future outlook is positive, with ongoing growth expected, driven by emerging technologies and increased collaboration in the cybersecurity ecosystem.
Market Dynamics
Market Trends: Using AI and ML to Automate Threat Detection and Response
Using AI and ML for threat detection and response enhances cybersecurity by enabling anomaly detection, pattern recognition, behavioral analysis, and predictive analysis, reducing false positives, automating responses, and improving scalability. These technologies integrate with threat intelligence, streamline incident response, and assist in threat hunting. Challenges include data quality, algorithm biases, and the need for human oversight.
Market Driver: Zero trust security is increasing demand for threat intelligence management solutions
The adoption of zero-trust security models is indeed increasing the demand for threat intelligence management solutions. In zero-trust environments, trust is never assumed, and every user and device is continuously verified. Threat intelligence plays a crucial role in providing real-time information about potential threats and vulnerabilities, aiding in continuous monitoring, and enabling organizations to make informed access control decisions based on the latest threat data. This alignment with zero trust principles enhances overall security and drives the need for robust threat intelligence management solutions.
Market opportunity: Introduction of Mobile Threats
The rise of mobile devices in personal and professional use has heightened the significance of mobile threat intelligence within the Threat Intelligence Management Market. Mobile threats, including malware, phishing, network vulnerabilities, and data leakage through mobile apps, are prompting organizations to integrate mobile-specific threat intelligence into their security strategies, driving the need for specialized solutions to detect, analyze, and respond to these threats effectively.
Market share Analysis: Cloud Based Threat Intelligence Management Market will register the fastest growth
The Global Threat Intelligence Management Market is analyzed across Cloud-based, On-premise, and others. Software is poised to register significant growth. The Cloud-Based Threat Intelligence Management Market offers threat intelligence services and solutions via cloud platforms, providing scalability and flexibility. It centralizes threat data, facilitates real-time updates, and streamlines threat detection and response, making it increasingly popular in cloud-centric environments. This trend is driven by growing cloud reliance, rapid threat information sharing, and cost-effective accessibility.
Market Share Analysis: BFSI held a significant market share in 2023
The Global Threat Intelligence Management Market is analyzed across various applications including BFSI, Healthcare, Telecommunication, Manufacturing, Retail, Education, Research Organizations, and others. Of these, BFSI held a significant market share in 2023. The BFSI sector (Financial Services Industry) is a significant market within Threat Intelligence Management, with heavy investments in solutions to proactively address cybersecurity threats and protect sensitive customer data. These solutions help detect financial fraud, ensure regulatory compliance, and safeguard critical infrastructure from various cyberattacks. The BFSI sector's demand for threat intelligence management is driven by the need to maintain trust and financial stability in a digital, interconnected financial landscape.
Threat Intelligence Management Market Segmentation
By Type
By Application
- BFSI
- Healthcare
- Telecommunication
- Manufacturing
- Retail
- Education
- Research Organizations
- Others
By Region
- North America (United States, Canada, Mexico)
- Europe (Germany, France, United Kingdom, Spain, Italy, Others)
- Asia Pacific (China, India, Japan, South Korea, Australia, Others)
- Latin America (Brazil, Argentina, Others)
- Middle East and Africa (Saudi Arabia, UAE, Kuwait, Other Middle East, South Africa, Nigeria, Other Africa)
Threat Intelligence Management Market Companies
- Juniper Networks
- Trend Micro
- IBM
- Dell
- McAfee
- Check Point
- FireEye
- LogRhythm
- LookingGlass Cyber Solutions
- Splunk
- Symantec
- Webroot
- F-Secure
- AlienVault
- Farsight Security
- Optiv Security
*List not exhaustive
Threat Intelligence Management Market Outlook 2023
1 Market Overview
1.1 Introduction to the Threat Intelligence Management Market
1.2 Scope of the Study
1.3 Research Objective
1.3.1 Key Market Scope and Segments
1.3.2 Players Covered
1.3.3 Years Considered
2 Executive Summary
2.1 2023 Threat Intelligence Management Industry- Market Statistics
3 Market Dynamics
3.1 Market Drivers
3.2 Market Challenges
3.3 Market Opportunities
3.4 Market Trends
4 Market Factor Analysis
4.1 Porter’s Five Forces
4.2 Market Entropy
4.2.1 Global Threat Intelligence Management Market Companies with Area Served
4.2.2 Products Offerings Global Threat Intelligence Management Market
5 COVID-19 Impact Analysis and Outlook Scenarios
5.1.1 Covid-19 Impact Analysis
5.1.2 post-COVID-19 Scenario- Low Growth Case
5.1.3 post-COVID-19 Scenario- Reference Growth Case
5.1.4 post-COVID-19 Scenario- Low Growth Case
6 Global Threat Intelligence Management Market Trends
6.1 Global Threat Intelligence Management Revenue (USD Million) and CAGR (%) by Type (2018-2030)
6.2 Global Threat Intelligence Management Revenue (USD Million) and CAGR (%) by Applications (2018-2030)
6.3 Global Threat Intelligence Management Revenue (USD Million) and CAGR (%) by regions (2018-2030)
7 Global Threat Intelligence Management Market Revenue (USD Million) by Type, and Applications (2018-2022)
7.1 Global Threat Intelligence Management Revenue (USD Million) by Type (2018-2022)
7.1.1 Global Threat Intelligence Management Revenue (USD Million), Market Share (%) by Type (2018-2022)
7.2 Global Threat Intelligence Management Revenue (USD Million) by Applications (2018-2022)
7.2.1 Global Threat Intelligence Management Revenue (USD Million), Market Share (%) by Applications (2018-2022)
8 Global Threat Intelligence Management Development Regional Status and Outlook
8.1 Global Threat Intelligence Management Revenue (USD Million) By Regions (2018-2022)
8.2 North America Threat Intelligence Management Revenue (USD Million) by Type, and Application (2018-2022)
8.2.1 North America Threat Intelligence Management Revenue (USD Million) by Country (2018-2022)
8.2.2 North America Threat Intelligence Management Revenue (USD Million) by Type (2018-2022)
8.2.3 North America Threat Intelligence Management Revenue (USD Million) by Applications (2018-2022)
8.3 Europe Threat Intelligence Management Revenue (USD Million), by Type, and Applications (USD Million) (2018-2022)
8.3.1 Europe Threat Intelligence Management Revenue (USD Million), by Country (2018-2022)
8.3.2 Europe Threat Intelligence Management Revenue (USD Million) by Type (2018-2022)
8.3.3 Europe Threat Intelligence Management Revenue (USD Million) by Applications (2018-2022)
8.4 Asia Pacific Threat Intelligence Management Revenue (USD Million), and Revenue (USD Million) by Type, and Applications (2018-2022)
8.4.1 Asia Pacific Threat Intelligence Management Revenue (USD Million) by Country (2018-2022)
8.4.2 Asia Pacific Threat Intelligence Management Revenue (USD Million) by Type (2018-2022)
8.4.3 Asia Pacific Threat Intelligence Management Revenue (USD Million) by Applications (2018-2022)
8.5 South America Threat Intelligence Management Revenue (USD Million), by Type, and Applications (2018-2022)
8.5.1 South America Threat Intelligence Management Revenue (USD Million), by Country (2018-2022)
8.5.2 South America Threat Intelligence Management Revenue (USD Million) by Type (2018-2022)
8.5.3 South America Threat Intelligence Management Revenue (USD Million) by Applications (2018-2022)
8.6 Middle East and Africa Threat Intelligence Management Revenue (USD Million), by Type, Technology, Application, Thickness (2018-2022)
8.6.1 Middle East and Africa Threat Intelligence Management Revenue (USD Million) by Country (2018-2022)
8.6.2 Middle East and Africa Threat Intelligence Management Revenue (USD Million) by Type (2018-2022)
8.6.3 Middle East and Africa Threat Intelligence Management Revenue (USD Million) by Applications (2018-2022)
9 Company Profiles
10 Global Threat Intelligence Management Market Revenue (USD Million), by Type, and Applications (2023-2030)
10.1 Global Threat Intelligence Management Revenue (USD Million) and Market Share (%) by Type (2023-2030)
10.1.1 Global Threat Intelligence Management Revenue (USD Million), and Market Share (%) by Type (2023-2030)
10.2 Global Threat Intelligence Management Revenue (USD Million) and Market Share (%) by Applications (2023-2030)
10.2.1 Global Threat Intelligence Management Revenue (USD Million), and Market Share (%) by Applications (2023-2030)
11 Global Threat Intelligence Management Development Regional Status and Outlook Forecast
11.1 Global Threat Intelligence Management Revenue (USD Million) By Regions (2023-2030)
11.2 North America Threat Intelligence Management Revenue (USD Million) by Type, and Applications (2023-2030)
11.2.1 North America Threat Intelligence Management Revenue (USD) Million by Country (2023-2030)
11.2.2 North America Threat Intelligence Management Revenue (USD Million), by Type (2023-2030)
11.2.3 North America Threat Intelligence Management Revenue (USD Million), Market Share (%) by Applications (2023-2030)
11.3 Europe Threat Intelligence Management Revenue (USD Million), by Type, and Applications (2023-2030)
11.3.1 Europe Threat Intelligence Management Revenue (USD Million), by Country (2023-2030)
11.3.2 Europe Threat Intelligence Management Revenue (USD Million), by Type (2023-2030)
11.3.3 Europe Threat Intelligence Management Revenue (USD Million), by Applications (2023-2030)
11.4 Asia Pacific Threat Intelligence Management Revenue (USD Million) by Type, and Applications (2023-2030)
11.4.1 Asia Pacific Threat Intelligence Management Revenue (USD Million), by Country (2023-2030)
11.4.2 Asia Pacific Threat Intelligence Management Revenue (USD Million), by Type (2023-2030)
11.4.3 Asia Pacific Threat Intelligence Management Revenue (USD Million), by Applications (2023-2030)
11.5 South America Threat Intelligence Management Revenue (USD Million), by Type, and Applications (2023-2030)
11.5.1 South America Threat Intelligence Management Revenue (USD Million), by Country (2023-2030)
11.5.2 South America Threat Intelligence Management Revenue (USD Million), by Type (2023-2030)
11.5.3 South America Threat Intelligence Management Revenue (USD Million), by Applications (2023-2030)
11.6 Middle East and Africa Threat Intelligence Management Revenue (USD Million), by Type, and Applications (2023-2030)
11.6.1 Middle East and Africa Threat Intelligence Management Revenue (USD Million), by region (2023-2030)
11.6.2 Middle East and Africa Threat Intelligence Management Revenue (USD Million), by Type (2023-2030)
11.6.3 Middle East and Africa Threat Intelligence Management Revenue (USD Million), by Applications (2023-2030)
12 Methodology and Data Sources
12.1 Methodology/Research Approach
12.1.1 Research Programs/Design
12.1.2 Market Size Estimation
12.1.3 Market Breakdown and Data Triangulation
12.2 Data Sources
12.2.1 Secondary Sources
12.2.2 Primary Sources
12.3 Disclaimer
List of Tables
Table 1 Market Segmentation Analysis
Table 2 Global Threat Intelligence Management Market Companies with Areas Served
Table 3 Products Offerings Global Threat Intelligence Management Market
Table 4 Low Growth Scenario Forecasts
Table 5 Reference Case Growth Scenario
Table 6 High Growth Case Scenario
Table 7 Global Threat Intelligence Management Revenue (USD Million) And CAGR (%) By Type (2018-2030)
Table 8 Global Threat Intelligence Management Revenue (USD Million) And CAGR (%) By Applications (2018-2030)
Table 9 Global Threat Intelligence Management Revenue (USD Million) And CAGR (%) By Regions (2018-2030)
Table 10 Global Threat Intelligence Management Revenue (USD Million) By Type (2018-2022)
Table 11 Global Threat Intelligence Management Revenue Market Share (%) By Type (2018-2022)
Table 12 Global Threat Intelligence Management Revenue (USD Million) By Applications (2018-2022)
Table 13 Global Threat Intelligence Management Revenue Market Share (%) By Applications (2018-2022)
Table 14 Global Threat Intelligence Management Market Revenue (USD Million) By Regions (2018-2022)
Table 15 Global Threat Intelligence Management Market Share (%) By Regions (2018-2022)
Table 16 North America Threat Intelligence Management Revenue (USD Million) By Country (2018-2022)
Table 17 North America Threat Intelligence Management Revenue (USD Million) By Type (2018-2022)
Table 18 North America Threat Intelligence Management Revenue (USD Million) By Applications (2018-2022)
Table 19 Europe Threat Intelligence Management Revenue (USD Million) By Country (2018-2022)
Table 20 Europe Threat Intelligence Management Revenue (USD Million) By Type (2018-2022)
Table 21 Europe Threat Intelligence Management Revenue (USD Million) By Applications (2018-2022)
Table 22 Asia Pacific Threat Intelligence Management Revenue (USD Million) By Country (2018-2022)
Table 23 Asia Pacific Threat Intelligence Management Revenue (USD Million) By Type (2018-2022)
Table 24 Asia Pacific Threat Intelligence Management Revenue (USD Million) By Applications (2018-2022)
Table 25 South America Threat Intelligence Management Revenue (USD Million) By Country (2018-2022)
Table 26 South America Threat Intelligence Management Revenue (USD Million) By Type (2018-2022)
Table 27 South America Threat Intelligence Management Revenue (USD Million) By Applications (2018-2022)
Table 28 Middle East and Africa Threat Intelligence Management Revenue (USD Million) By Region (2018-2022)
Table 29 Middle East and Africa Threat Intelligence Management Revenue (USD Million) By Type (2018-2022)
Table 30 Middle East and Africa Threat Intelligence Management Revenue (USD Million) By Applications (2018-2022)
Table 31 Financial Analysis
Table 32 Global Threat Intelligence Management Revenue (USD Million) By Type (2023-2030)
Table 33 Global Threat Intelligence Management Revenue Market Share (%) By Type (2023-2030)
Table 34 Global Threat Intelligence Management Revenue (USD Million) By Applications (2023-2030)
Table 35 Global Threat Intelligence Management Revenue Market Share (%) By Applications (2023-2030)
Table 36 Global Threat Intelligence Management Market Revenue (USD Million), And Revenue (USD Million) By Regions (2023-2030)
Table 37 North America Threat Intelligence Management Revenue (USD)By Country (2023-2030)
Table 38 North America Threat Intelligence Management Revenue (USD Million) By Type (2023-2030)
Table 39 North America Threat Intelligence Management Revenue (USD Million) By Applications (2023-2030)
Table 40 Europe Threat Intelligence Management Revenue (USD Million) By Country (2023-2030)
Table 41 Europe Threat Intelligence Management Revenue (USD Million) By Type (2023-2030)
Table 42 Europe Threat Intelligence Management Revenue (USD Million) By Applications (2023-2030)
Table 43 Asia Pacific Threat Intelligence Management Revenue (USD Million) By Country (2023-2030)
Table 44 Asia Pacific Threat Intelligence Management Revenue (USD Million) By Type (2023-2030)
Table 45 Asia Pacific Threat Intelligence Management Revenue (USD Million) By Applications (2023-2030)
Table 46 South America Threat Intelligence Management Revenue (USD Million) By Country (2023-2030)
Table 47 South America Threat Intelligence Management Revenue (USD Million) By Type (2023-2030)
Table 48 South America Threat Intelligence Management Revenue (USD Million) By Applications (2023-2030)
Table 49 Middle East and Africa Threat Intelligence Management Revenue (USD Million) By Region (2023-2030)
Table 50 Middle East and Africa Threat Intelligence Management Revenue (USD Million) By Region (2023-2030)
Table 51 Middle East and Africa Threat Intelligence Management Revenue (USD Million) By Type (2023-2030)
Table 52 Middle East and Africa Threat Intelligence Management Revenue (USD Million) By Applications (2023-2030)
Table 53 Research Programs/Design for This Report
Table 54 Key Data Information from Secondary Sources
Table 55 Key Data Information from Primary Sources
List of Figures
Figure 1 Market Scope
Figure 2 Porter’s Five Forces
Figure 3 Global Threat Intelligence Management Revenue (USD Million) By Type (2018-2022)
Figure 4 Global Threat Intelligence Management Revenue Market Share (%) By Type (2022)
Figure 5 Global Threat Intelligence Management Revenue (USD Million) By Applications (2018-2022)
Figure 6 Global Threat Intelligence Management Revenue Market Share (%) By Applications (2022)
Figure 7 Global Threat Intelligence Management Market Revenue (USD Million) By Regions (2018-2022)
Figure 8 Global Threat Intelligence Management Market Share (%) By Regions (2022)
Figure 9 North America Threat Intelligence Management Revenue (USD Million) By Country (2018-2022)
Figure 10 North America Threat Intelligence Management Revenue (USD Million) By Type (2018-2022)
Figure 11 North America Threat Intelligence Management Revenue (USD Million) By Applications (2018-2022)
Figure 12 Europe Threat Intelligence Management Revenue (USD Million) By Country (2018-2022)
Figure 13 Europe Threat Intelligence Management Revenue (USD Million) By Type (2018-2022)
Figure 14 Europe Threat Intelligence Management Revenue (USD Million) By Applications (2018-2022)
Figure 15 Asia Pacific Threat Intelligence Management Revenue (USD Million) By Country (2018-2022)
Figure 16 Asia Pacific Threat Intelligence Management Revenue (USD Million) By Type (2018-2022)
Figure 17 Asia Pacific Threat Intelligence Management Revenue (USD Million) By Applications (2018-2022)
Figure 18 South America Threat Intelligence Management Revenue (USD Million) By Country (2018-2022)
Figure 19 South America Threat Intelligence Management Revenue (USD Million) By Type (2018-2022)
Figure 20 South America Threat Intelligence Management Revenue (USD Million) By Applications (2018-2022)
Figure 21 Middle East and Africa Threat Intelligence Management Revenue (USD Million) By Region (2018-2022)
Figure 22 Middle East and Africa Threat Intelligence Management Revenue (USD Million) By Type (2018-2022)
Figure 23 Middle East and Africa Threat Intelligence Management Revenue (USD Million) By Applications (2018-2022)
Figure 24 Global Threat Intelligence Management Revenue (USD Million) By Type (2023-2030)
Figure 25 Global Threat Intelligence Management Revenue Market Share (%) By Type (2030)
Figure 26 Global Threat Intelligence Management Revenue (USD Million) By Applications (2023-2030)
Figure 27 Global Threat Intelligence Management Revenue Market Share (%) By Applications (2030)
Figure 28 Global Threat Intelligence Management Market Revenue (USD Million) By Regions (2023-2030)
Figure 29 North America Threat Intelligence Management Revenue (USD Million) By Country (2023-2030)
Figure 30 North America Threat Intelligence Management Revenue (USD Million) By Type (2023-2030)
Figure 31 North America Threat Intelligence Management Revenue (USD Million) By Applications (2023-2030)
Figure 32 Europe Threat Intelligence Management Revenue (USD Million) By Country (2023-2030)
Figure 33 Europe Threat Intelligence Management Revenue (USD Million) By Type (2023-2030)
Figure 34 Europe Threat Intelligence Management Revenue (USD Million) By Applications (2023-2030)
Figure 35 Asia Pacific Threat Intelligence Management Revenue (USD Million) By Country (2023-2030)
Figure 36 Asia Pacific Threat Intelligence Management Revenue (USD Million) By Type (2023-2030)
Figure 37 Asia Pacific Threat Intelligence Management Revenue (USD Million) By Applications (2023-2030)
Figure 38 South America Threat Intelligence Management Revenue (USD Million) By Country (2023-2030)
Figure 39 South America Threat Intelligence Management Revenue (USD Million) By Type (2023-2030)
Figure 40 South America Threat Intelligence Management Revenue (USD Million) By Applications (2023-2030)
Figure 41 Middle East and Africa Threat Intelligence Management Revenue (USD Million) By Region (2023-2030)
Figure 42 Middle East and Africa Threat Intelligence Management Revenue (USD Million) By Region (2023-2030)
Figure 43 Middle East and Africa Threat Intelligence Management Revenue (USD Million) By Type (2023-2030)
Figure 44 Middle East and Africa Threat Intelligence Management Revenue (USD Million) By Applications (2023-2030)
Figure 45 Bottom-Up and Top-Down Approaches for This Report
Figure 46 Data Triangulation
