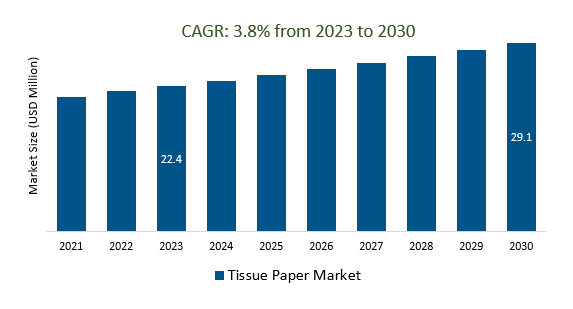
The Tissue Paper Market Size is estimated to register High CAGR over the forecast period from 2023 to 2030.
The market growth is driven by the increasing growth of online shopping has boosted the tissue paper market, as consumers increasingly purchase these products online for convenience and bulk buying. Leading companies that are focused on Sustainability and Eco-Friendly Products, Health and Hygiene, Customization and Premium Products, Market Diversification, Health and Sustainability Certifications: , and others to boost market shares in the industry.
Market Overview
The tissue paper market, encompassing products like toilet paper, facial tissues, and paper towels, has experienced steady growth due to heightened health and hygiene awareness, sustainability concerns, and product innovation. Key players include Procter & Gamble, Kimberly-Clark, and Georgia-Pacific, with emerging markets in Asia, Latin America, and Africa showing substantial potential. Challenges include raw material costs and environmental regulations, while future prospects indicate continued growth, driven by sustainability initiatives, e-commerce expansion, and a focus on eco-friendly products.
Market Dynamics
Market Trends - The Importance of Tissue Paper for Health and Hygiene
Tissue paper is indispensable for health and hygiene, playing a vital role in maintaining personal cleanliness and preventing the spread of infections, particularly highlighted during the COVID-19 pandemic. Products like toilet paper, facial tissues, and paper towels provide convenient and effective means for hand hygiene, surface cleaning, and sanitation. The growing emphasis on health and hygiene awareness among consumers underscores the importance of tissue paper, driving its continued demand and growth in the market.
Market Driver- Health and Sustainability Certifications Demand Tissue Paper Market
Health and sustainability certifications are spurring demand in the tissue paper market as consumers prioritize eco-friendly and health-conscious products. Certifications like FSC and hypoallergenic labels are preferred, highlighting the increasing awareness of sustainability and health concerns. Tissue paper manufacturers are aligning with these certifications to meet consumer expectations and enhance their competitiveness in the market.
Market Opportunity-Introduction of Innovations in Technology
Innovations in technology are propelling the tissue paper market forward by enabling the production of softer, more absorbent, and durable tissue products. These technological advancements, including improved fiber processing and finishing techniques, enhance product quality and performance, align with consumer preferences for comfort and functionality, and contribute to the market's growth and competitiveness.
Market Share Analysis- Wet Wipes Tissue Paper Market will register the fastest growth
The Global Tissue Paper Market is analyzed across Paper Tissues, Wet Wipes, Facial Tissue, and others. · Wet Wipes are poised to register the fastest growth. Wet wipes are a notable product category in the tissue paper market, offering convenient, disposable solutions for personal hygiene, cleaning, and disinfection purposes. They have gained popularity due to their ease of use and effectiveness, particularly in situations where traditional soap and water are not readily available. However, growing sustainability concerns and environmental impact issues related to single-use products have prompted manufacturers to explore eco-friendly and biodegradable alternatives to meet consumer demands for convenience and hygiene while addressing environmental issues.
Market Share Analysis- Bleached Softwood Kraft Pulp (BSK) held a significant market share in 2023
The Global Tissue Paper Market is analyzed across various Raw materials including Bleached Softwood Kraft Pulp (BSK), Birch Hardwood Kraft Pulp (BHK), High Yield Pulp (HYP), and others. Of these, Bleached Softwood Kraft Pulp (BSK) held a significant market share in 2023. Bleached Softwood Kraft Pulp (BSK) is a vital raw material in the tissue paper market, prized for its strong, long fibers that are ideal for producing high-quality tissue products like toilet paper and paper towels. BSK's quality influences the absorbency and durability of tissue papers. Sourcing and availability of BSK have significant cost and quality implications for tissue paper production, with an increasing focus on sustainable and responsible sourcing to align with environmental sustainability goals in the industry.
Tissue Paper Market Segmentation
By Type
- Paper Tissues
- Wet Wipes
- Facial Tissue
- Others
By Raw Material
- Bleached Softwood Kraft Pulp (BSK)
- Birch Hardwood Kraft Pulp (BHK)
- High Yield Pulp (HYP)
- Others
By Packaging Type
- Rolls
- Napkins
- Folded Tissues
- Others
By Application
By Distribution Channel
By Region
- North America (United States, Canada, Mexico)
- Europe (Germany, France, United Kingdom, Spain, Italy, Others)
- Asia Pacific (China, India, Japan, South Korea, Australia, Others)
- Latin America (Brazil, Argentina, Others)
- Middle East and Africa (Saudi Arabia, UAE, Kuwait, Other Middle East, South Africa, Nigeria, Other Africa)
Tissue Paper Market Companies
- Cascades Inc
- Wepa Hygieneprodukte GmbH
- Essity AB
- Christian Senning Verpackungsmaschinen GmbH & Co. KG
- Kruger Inc
- Kimberly-Clark Corporation
- Johnson & Johnson Private Limited
- The Proctor & Gamble Co. Ltd
- Georgia-Pacific LLC
- Clearwater Paper Corporation
*List not exhaustive
Tissue Paper Market Outlook 2023
1 Market Overview
1.1 Introduction to the Tissue Paper Market
1.2 Scope of the Study
1.3 Research Objective
1.3.1 Key Market Scope and Segments
1.3.2 Players Covered
1.3.3 Years Considered
2 Executive Summary
2.1 2023 Tissue Paper Industry- Market Statistics
3 Market Dynamics
3.1 Market Drivers
3.2 Market Challenges
3.3 Market Opportunities
3.4 Market Trends
4 Market Factor Analysis
4.1 Porter’s Five Forces
4.2 Market Entropy
4.2.1 Global Tissue Paper Market Companies with Area Served
4.2.2 Products Offerings Global Tissue Paper Market
5 COVID-19 Impact Analysis and Outlook Scenarios
5.1.1 Covid-19 Impact Analysis
5.1.2 post-COVID-19 Scenario- Low Growth Case
5.1.3 post-COVID-19 Scenario- Reference Growth Case
5.1.4 post-COVID-19 Scenario- Low Growth Case
6 Global Tissue Paper Market Trends
6.1 Global Tissue Paper Revenue (USD Million) and CAGR (%) by Type (2018-2030)
6.2 Global Tissue Paper Revenue (USD Million) and CAGR (%) by Applications (2018-2030)
6.3 Global Tissue Paper Revenue (USD Million) and CAGR (%) by regions (2018-2030)
7 Global Tissue Paper Market Revenue (USD Million) by Type, and Applications (2018-2022)
7.1 Global Tissue Paper Revenue (USD Million) by Type (2018-2022)
7.1.1 Global Tissue Paper Revenue (USD Million), Market Share (%) by Type (2018-2022)
7.2 Global Tissue Paper Revenue (USD Million) by Applications (2018-2022)
7.2.1 Global Tissue Paper Revenue (USD Million), Market Share (%) by Applications (2018-2022)
8 Global Tissue Paper Development Regional Status and Outlook
8.1 Global Tissue Paper Revenue (USD Million) By Regions (2018-2022)
8.2 North America Tissue Paper Revenue (USD Million) by Type, and Application (2018-2022)
8.2.1 North America Tissue Paper Revenue (USD Million) by Country (2018-2022)
8.2.2 North America Tissue Paper Revenue (USD Million) by Type (2018-2022)
8.2.3 North America Tissue Paper Revenue (USD Million) by Applications (2018-2022)
8.3 Europe Tissue Paper Revenue (USD Million), by Type, and Applications (USD Million) (2018-2022)
8.3.1 Europe Tissue Paper Revenue (USD Million), by Country (2018-2022)
8.3.2 Europe Tissue Paper Revenue (USD Million) by Type (2018-2022)
8.3.3 Europe Tissue Paper Revenue (USD Million) by Applications (2018-2022)
8.4 Asia Pacific Tissue Paper Revenue (USD Million), and Revenue (USD Million) by Type, and Applications (2018-2022)
8.4.1 Asia Pacific Tissue Paper Revenue (USD Million) by Country (2018-2022)
8.4.2 Asia Pacific Tissue Paper Revenue (USD Million) by Type (2018-2022)
8.4.3 Asia Pacific Tissue Paper Revenue (USD Million) by Applications (2018-2022)
8.5 South America Tissue Paper Revenue (USD Million), by Type, and Applications (2018-2022)
8.5.1 South America Tissue Paper Revenue (USD Million), by Country (2018-2022)
8.5.2 South America Tissue Paper Revenue (USD Million) by Type (2018-2022)
8.5.3 South America Tissue Paper Revenue (USD Million) by Applications (2018-2022)
8.6 Middle East and Africa Tissue Paper Revenue (USD Million), by Type, Technology, Application, Thickness (2018-2022)
8.6.1 Middle East and Africa Tissue Paper Revenue (USD Million) by Country (2018-2022)
8.6.2 Middle East and Africa Tissue Paper Revenue (USD Million) by Type (2018-2022)
8.6.3 Middle East and Africa Tissue Paper Revenue (USD Million) by Applications (2018-2022)
9 Company Profiles
10 Global Tissue Paper Market Revenue (USD Million), by Type, and Applications (2023-2030)
10.1 Global Tissue Paper Revenue (USD Million) and Market Share (%) by Type (2023-2030)
10.1.1 Global Tissue Paper Revenue (USD Million), and Market Share (%) by Type (2023-2030)
10.2 Global Tissue Paper Revenue (USD Million) and Market Share (%) by Applications (2023-2030)
10.2.1 Global Tissue Paper Revenue (USD Million), and Market Share (%) by Applications (2023-2030)
11 Global Tissue Paper Development Regional Status and Outlook Forecast
11.1 Global Tissue Paper Revenue (USD Million) By Regions (2023-2030)
11.2 North America Tissue Paper Revenue (USD Million) by Type, and Applications (2023-2030)
11.2.1 North America Tissue Paper Revenue (USD) Million by Country (2023-2030)
11.2.2 North America Tissue Paper Revenue (USD Million), by Type (2023-2030)
11.2.3 North America Tissue Paper Revenue (USD Million), Market Share (%) by Applications (2023-2030)
11.3 Europe Tissue Paper Revenue (USD Million), by Type, and Applications (2023-2030)
11.3.1 Europe Tissue Paper Revenue (USD Million), by Country (2023-2030)
11.3.2 Europe Tissue Paper Revenue (USD Million), by Type (2023-2030)
11.3.3 Europe Tissue Paper Revenue (USD Million), by Applications (2023-2030)
11.4 Asia Pacific Tissue Paper Revenue (USD Million) by Type, and Applications (2023-2030)
11.4.1 Asia Pacific Tissue Paper Revenue (USD Million), by Country (2023-2030)
11.4.2 Asia Pacific Tissue Paper Revenue (USD Million), by Type (2023-2030)
11.4.3 Asia Pacific Tissue Paper Revenue (USD Million), by Applications (2023-2030)
11.5 South America Tissue Paper Revenue (USD Million), by Type, and Applications (2023-2030)
11.5.1 South America Tissue Paper Revenue (USD Million), by Country (2023-2030)
11.5.2 South America Tissue Paper Revenue (USD Million), by Type (2023-2030)
11.5.3 South America Tissue Paper Revenue (USD Million), by Applications (2023-2030)
11.6 Middle East and Africa Tissue Paper Revenue (USD Million), by Type, and Applications (2023-2030)
11.6.1 Middle East and Africa Tissue Paper Revenue (USD Million), by region (2023-2030)
11.6.2 Middle East and Africa Tissue Paper Revenue (USD Million), by Type (2023-2030)
11.6.3 Middle East and Africa Tissue Paper Revenue (USD Million), by Applications (2023-2030)
12 Methodology and Data Sources
12.1 Methodology/Research Approach
12.1.1 Research Programs/Design
12.1.2 Market Size Estimation
12.1.3 Market Breakdown and Data Triangulation
12.2 Data Sources
12.2.1 Secondary Sources
12.2.2 Primary Sources
12.3 Disclaimer
List of Tables
Table 1 Market Segmentation Analysis
Table 2 Global Tissue Paper Market Companies with Areas Served
Table 3 Products Offerings Global Tissue Paper Market
Table 4 Low Growth Scenario Forecasts
Table 5 Reference Case Growth Scenario
Table 6 High Growth Case Scenario
Table 7 Global Tissue Paper Revenue (USD Million) And CAGR (%) By Type (2018-2030)
Table 8 Global Tissue Paper Revenue (USD Million) And CAGR (%) By Applications (2018-2030)
Table 9 Global Tissue Paper Revenue (USD Million) And CAGR (%) By Regions (2018-2030)
Table 10 Global Tissue Paper Revenue (USD Million) By Type (2018-2022)
Table 11 Global Tissue Paper Revenue Market Share (%) By Type (2018-2022)
Table 12 Global Tissue Paper Revenue (USD Million) By Applications (2018-2022)
Table 13 Global Tissue Paper Revenue Market Share (%) By Applications (2018-2022)
Table 14 Global Tissue Paper Market Revenue (USD Million) By Regions (2018-2022)
Table 15 Global Tissue Paper Market Share (%) By Regions (2018-2022)
Table 16 North America Tissue Paper Revenue (USD Million) By Country (2018-2022)
Table 17 North America Tissue Paper Revenue (USD Million) By Type (2018-2022)
Table 18 North America Tissue Paper Revenue (USD Million) By Applications (2018-2022)
Table 19 Europe Tissue Paper Revenue (USD Million) By Country (2018-2022)
Table 20 Europe Tissue Paper Revenue (USD Million) By Type (2018-2022)
Table 21 Europe Tissue Paper Revenue (USD Million) By Applications (2018-2022)
Table 22 Asia Pacific Tissue Paper Revenue (USD Million) By Country (2018-2022)
Table 23 Asia Pacific Tissue Paper Revenue (USD Million) By Type (2018-2022)
Table 24 Asia Pacific Tissue Paper Revenue (USD Million) By Applications (2018-2022)
Table 25 South America Tissue Paper Revenue (USD Million) By Country (2018-2022)
Table 26 South America Tissue Paper Revenue (USD Million) By Type (2018-2022)
Table 27 South America Tissue Paper Revenue (USD Million) By Applications (2018-2022)
Table 28 Middle East and Africa Tissue Paper Revenue (USD Million) By Region (2018-2022)
Table 29 Middle East and Africa Tissue Paper Revenue (USD Million) By Type (2018-2022)
Table 30 Middle East and Africa Tissue Paper Revenue (USD Million) By Applications (2018-2022)
Table 31 Financial Analysis
Table 32 Global Tissue Paper Revenue (USD Million) By Type (2023-2030)
Table 33 Global Tissue Paper Revenue Market Share (%) By Type (2023-2030)
Table 34 Global Tissue Paper Revenue (USD Million) By Applications (2023-2030)
Table 35 Global Tissue Paper Revenue Market Share (%) By Applications (2023-2030)
Table 36 Global Tissue Paper Market Revenue (USD Million), And Revenue (USD Million) By Regions (2023-2030)
Table 37 North America Tissue Paper Revenue (USD)By Country (2023-2030)
Table 38 North America Tissue Paper Revenue (USD Million) By Type (2023-2030)
Table 39 North America Tissue Paper Revenue (USD Million) By Applications (2023-2030)
Table 40 Europe Tissue Paper Revenue (USD Million) By Country (2023-2030)
Table 41 Europe Tissue Paper Revenue (USD Million) By Type (2023-2030)
Table 42 Europe Tissue Paper Revenue (USD Million) By Applications (2023-2030)
Table 43 Asia Pacific Tissue Paper Revenue (USD Million) By Country (2023-2030)
Table 44 Asia Pacific Tissue Paper Revenue (USD Million) By Type (2023-2030)
Table 45 Asia Pacific Tissue Paper Revenue (USD Million) By Applications (2023-2030)
Table 46 South America Tissue Paper Revenue (USD Million) By Country (2023-2030)
Table 47 South America Tissue Paper Revenue (USD Million) By Type (2023-2030)
Table 48 South America Tissue Paper Revenue (USD Million) By Applications (2023-2030)
Table 49 Middle East and Africa Tissue Paper Revenue (USD Million) By Region (2023-2030)
Table 50 Middle East and Africa Tissue Paper Revenue (USD Million) By Region (2023-2030)
Table 51 Middle East and Africa Tissue Paper Revenue (USD Million) By Type (2023-2030)
Table 52 Middle East and Africa Tissue Paper Revenue (USD Million) By Applications (2023-2030)
Table 53 Research Programs/Design for This Report
Table 54 Key Data Information from Secondary Sources
Table 55 Key Data Information from Primary Sources
List of Figures
Figure 1 Market Scope
Figure 2 Porter’s Five Forces
Figure 3 Global Tissue Paper Revenue (USD Million) By Type (2018-2022)
Figure 4 Global Tissue Paper Revenue Market Share (%) By Type (2022)
Figure 5 Global Tissue Paper Revenue (USD Million) By Applications (2018-2022)
Figure 6 Global Tissue Paper Revenue Market Share (%) By Applications (2022)
Figure 7 Global Tissue Paper Market Revenue (USD Million) By Regions (2018-2022)
Figure 8 Global Tissue Paper Market Share (%) By Regions (2022)
Figure 9 North America Tissue Paper Revenue (USD Million) By Country (2018-2022)
Figure 10 North America Tissue Paper Revenue (USD Million) By Type (2018-2022)
Figure 11 North America Tissue Paper Revenue (USD Million) By Applications (2018-2022)
Figure 12 Europe Tissue Paper Revenue (USD Million) By Country (2018-2022)
Figure 13 Europe Tissue Paper Revenue (USD Million) By Type (2018-2022)
Figure 14 Europe Tissue Paper Revenue (USD Million) By Applications (2018-2022)
Figure 15 Asia Pacific Tissue Paper Revenue (USD Million) By Country (2018-2022)
Figure 16 Asia Pacific Tissue Paper Revenue (USD Million) By Type (2018-2022)
Figure 17 Asia Pacific Tissue Paper Revenue (USD Million) By Applications (2018-2022)
Figure 18 South America Tissue Paper Revenue (USD Million) By Country (2018-2022)
Figure 19 South America Tissue Paper Revenue (USD Million) By Type (2018-2022)
Figure 20 South America Tissue Paper Revenue (USD Million) By Applications (2018-2022)
Figure 21 Middle East and Africa Tissue Paper Revenue (USD Million) By Region (2018-2022)
Figure 22 Middle East and Africa Tissue Paper Revenue (USD Million) By Type (2018-2022)
Figure 23 Middle East and Africa Tissue Paper Revenue (USD Million) By Applications (2018-2022)
Figure 24 Global Tissue Paper Revenue (USD Million) By Type (2023-2030)
Figure 25 Global Tissue Paper Revenue Market Share (%) By Type (2030)
Figure 26 Global Tissue Paper Revenue (USD Million) By Applications (2023-2030)
Figure 27 Global Tissue Paper Revenue Market Share (%) By Applications (2030)
Figure 28 Global Tissue Paper Market Revenue (USD Million) By Regions (2023-2030)
Figure 29 North America Tissue Paper Revenue (USD Million) By Country (2023-2030)
Figure 30 North America Tissue Paper Revenue (USD Million) By Type (2023-2030)
Figure 31 North America Tissue Paper Revenue (USD Million) By Applications (2023-2030)
Figure 32 Europe Tissue Paper Revenue (USD Million) By Country (2023-2030)
Figure 33 Europe Tissue Paper Revenue (USD Million) By Type (2023-2030)
Figure 34 Europe Tissue Paper Revenue (USD Million) By Applications (2023-2030)
Figure 35 Asia Pacific Tissue Paper Revenue (USD Million) By Country (2023-2030)
Figure 36 Asia Pacific Tissue Paper Revenue (USD Million) By Type (2023-2030)
Figure 37 Asia Pacific Tissue Paper Revenue (USD Million) By Applications (2023-2030)
Figure 38 South America Tissue Paper Revenue (USD Million) By Country (2023-2030)
Figure 39 South America Tissue Paper Revenue (USD Million) By Type (2023-2030)
Figure 40 South America Tissue Paper Revenue (USD Million) By Applications (2023-2030)
Figure 41 Middle East and Africa Tissue Paper Revenue (USD Million) By Region (2023-2030)
Figure 42 Middle East and Africa Tissue Paper Revenue (USD Million) By Region (2023-2030)
Figure 43 Middle East and Africa Tissue Paper Revenue (USD Million) By Type (2023-2030)
Figure 44 Middle East and Africa Tissue Paper Revenue (USD Million) By Applications (2023-2030)
Figure 45 Bottom-Up and Top-Down Approaches for This Report
Figure 46 Data Triangulation
