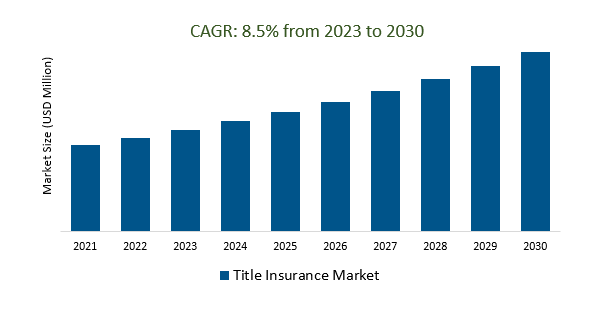
The Global Title Insurance Market Size is estimated to register 8.5% growth over the forecast period from 2023 to 2030.
The market growth is driven by an increasing title insurance industry that is increasingly embracing digital platforms and automation to streamline processes, reduce costs, and improve efficiency. This includes the use of blockchain technology for secure, transparent, and efficient title transfers. Leading Companies focusing on Expansion into International Markets, Smart Contracts, Blockchain Integration, AI and Machine Learning for Risk Assessments, Cybersecurity Services, Digital Identity Verification, and others to boost market shares in the industry.
Market Overview
The Title Insurance Market provides essential financial protection against property title defects, serving homebuyers, lenders, and investors by ensuring a clear and marketable title. It has been influenced by digitization, regulatory changes, and cybersecurity concerns, with a growing emphasis on environmental and climate risks. Market growth is closely tied to real estate transactions and economic conditions, and the industry is exploring innovations such as blockchain integration and customized policies. In the future, it may expand internationally, emphasize cybersecurity, and offer more personalized services, staying responsive to an evolving real estate landscape.
Market Dynamics
Market Trends- The growing number of mergers and acquisitions is driving demand for title insurance, as businesses and investors seek to protect their investments from title defects.
The Title Insurance Market is tightly interconnected with real estate, providing protection against title defects for property buyers and lenders. It reflects economic conditions and housing demand, while also embracing digital advances like blockchain and smart contracts. Environmental and cybersecurity concerns are emerging trends. The industry looks to the future with prospects of international expansion and customizable policies for property buyers and investors.
Market Driver- Evolving consumer expectations are driving demand for title insurance, as buyers and sellers seek a more seamless and efficient closing process.
The Title Insurance Market plays a pivotal role in real estate, offering protection against title defects, while evolving consumer expectations drive demand for a more streamlined closing process through digitalization and automation. Regulatory changes focus on data security and anti-fraud measures, and climate change-related risks are gaining attention. Simultaneously, cybersecurity investments are increasing to counter growing threats. The industry looks ahead to potential international expansion and innovative risk transfer models.
Market Opportunity- Geo-political and economic factors are becoming increasingly important in the title insurance market, as businesses and investors seek to protect their assets in a complex and uncertain world.
The Title Insurance Market, closely linked to real estate, safeguards against title defects for property buyers and lenders. It's responsive to economic conditions, including interest rates and housing market fluctuations, and is undergoing digital transformation with the adoption of blockchain and smart contracts. Environmental concerns and cybersecurity are emerging trends in the industry. The future holds prospects of international expansion and personalized policies for property buyers and investors.
Market Share Analysis- Owner's Title Insurance the Title Insurance Market will register the fastest growth
The Global Title Insurance Market is analyzed across Owner's Title Insurance, Lender's Title Insurance, and others. Owner's Title Insurance is poised to register the fastest growth. Owner's title insurance is a pivotal element within the Title Insurance Market, offering essential financial protection to property buyers against hidden title defects. This sector is closely tied to real estate dynamics, including property transactions, economic conditions, and housing market trends. It is undergoing digital transformation with technologies like blockchain and smart contracts, responding to regulatory changes, consumer expectations for streamlined closings, and emphasizing environmental and cybersecurity factors. The future may involve international expansion and tailored policies to meet the specific needs of property buyers.
Market Share Analysis- Enterprises held a significant market share in 2023
The Global Title Insurance Market is analyzed across various Organizations including Individuals, Enterprises, and others. Of these, Enterprises held a significant market share in 2023. Enterprise title insurance, or lender's title insurance, is a fundamental part of the Title Insurance Market, providing vital protection for lenders against hidden title defects in properties they finance. Its size and growth are closely tied to real estate activity and economic conditions. The industry is adapting to digitalization, regulatory changes, and the increasing importance of environmental and cybersecurity factors. Future developments may include international expansion and innovative technologies like blockchain to streamline transactions.
Title Insurance Market Segmentation
By Type
- Owner's Title Insurance
- Lender's Title Insurance
By End User
By Region
- North America (United States, Canada, Mexico)
- Europe (Germany, France, United Kingdom, Spain, Italy, Others)
- Asia Pacific (China, India, Japan, South Korea, Australia, Others)
- Latin America (Brazil, Argentina, Others)
- Middle East and Africa (Saudi Arabia, UAE, Kuwait, Other Middle East, South Africa, Nigeria, Other Africa)
Title Insurance Market Companies
- Zurich Insurance Group (Switzerland)
- Stewart Title Limited (United Kingdom)
- First American Title Insurance Company Ltd (United Kingdom)
- Fidelity National Title Insurance Company Ltd (United Kingdom)
- Allianz SE (Germany)
- Fidelity National Title Insurance Company (Singapore)
- Stewart Title Guaranty Company Limited (Hong Kong)
- China Life Property and Casualty Insurance Company Limited (China)
- Tokio Marine Insurance Singapore Ltd. (Singapore)
- First American Title Insurance Company (Hong Kong)
*List not exhaustive
Title Insurance Market Outlook 2023
1 Market Overview
1.1 Introduction to the Title Insurance Market
1.2 Scope of the Study
1.3 Research Objective
1.3.1 Key Market Scope and Segments
1.3.2 Players Covered
1.3.3 Years Considered
2 Executive Summary
2.1 2023 Title Insurance Industry- Market Statistics
3 Market Dynamics
3.1 Market Drivers
3.2 Market Challenges
3.3 Market Opportunities
3.4 Market Trends
4 Market Factor Analysis
4.1 Porter’s Five Forces
4.2 Market Entropy
4.2.1 Global Title Insurance Market Companies with Area Served
4.2.2 Products Offerings Global Title Insurance Market
5 COVID-19 Impact Analysis and Outlook Scenarios
5.1.1 Covid-19 Impact Analysis
5.1.2 Post-COVID-19 Scenario- Low Growth Case
5.1.3 Post-COVID-19 Scenario- Reference Growth Case
5.1.4 Post-COVID-19 Scenario- Low Growth Case
6 Global Title Insurance Market Trends
6.1 Global Title Insurance Revenue (USD Million) and CAGR (%) by Type (2018-2030)
6.2 Global Title Insurance Revenue (USD Million) and CAGR (%) by Applications (2018-2030)
6.3 Global Title Insurance Revenue (USD Million) and CAGR (%) by Regions (2018-2030)
7 Global Title Insurance Market Revenue (USD Million) by Type, and Applications (2018-2022)
7.1 Global Title Insurance Revenue (USD Million) by Type (2018-2022)
7.1.1 Global Title Insurance Revenue (USD Million), Market Share (%) by Type (2018-2022)
7.2 Global Title Insurance Revenue (USD Million) by Applications (2018-2022)
7.2.1 Global Title Insurance Revenue (USD Million), Market Share (%) by Applications (2018-2022)
8 Global Title Insurance Development Regional Status and Outlook
8.1 Global Title Insurance Revenue (USD Million) By Regions (2018-2022)
8.2 North America Title Insurance Revenue (USD Million) by Type, and Application (2018-2022)
8.2.1 North America Title Insurance Revenue (USD Million) by Country (2018-2022)
8.2.2 North America Title Insurance Revenue (USD Million) by Type (2018-2022)
8.2.3 North America Title Insurance Revenue (USD Million) by Applications (2018-2022)
8.3 Europe Title Insurance Revenue (USD Million), by Type, and Applications (USD Million) (2018-2022)
8.3.1 Europe Title Insurance Revenue (USD Million), by Country (2018-2022)
8.3.2 Europe Title Insurance Revenue (USD Million) by Type (2018-2022)
8.3.3 Europe Title Insurance Revenue (USD Million) by Applications (2018-2022)
8.4 Asia Pacific Title Insurance Revenue (USD Million), and Revenue (USD Million) by Type, and Applications (2018-2022)
8.4.1 Asia Pacific Title Insurance Revenue (USD Million) by Country (2018-2022)
8.4.2 Asia Pacific Title Insurance Revenue (USD Million) by Type (2018-2022)
8.4.3 Asia Pacific Title Insurance Revenue (USD Million) by Applications (2018-2022)
8.5 South America Title Insurance Revenue (USD Million), by Type, and Applications (2018-2022)
8.5.1 South America Title Insurance Revenue (USD Million), by Country (2018-2022)
8.5.2 South America Title Insurance Revenue (USD Million) by Type (2018-2022)
8.5.3 South America Title Insurance Revenue (USD Million) by Applications (2018-2022)
8.6 Middle East and Africa Title Insurance Revenue (USD Million), by Type, Technology, Application, Thickness (2018-2022)
8.6.1 Middle East and Africa Title Insurance Revenue (USD Million) by Country (2018-2022)
8.6.2 Middle East and Africa Title Insurance Revenue (USD Million) by Type (2018-2022)
8.6.3 Middle East and Africa Title Insurance Revenue (USD Million) by Applications (2018-2022)
9 Company Profiles
10 Global Title Insurance Market Revenue (USD Million), by Type, and Applications (2023-2030)
10.1 Global Title Insurance Revenue (USD Million) and Market Share (%) by Type (2023-2030)
10.1.1 Global Title Insurance Revenue (USD Million), and Market Share (%) by Type (2023-2030)
10.2 Global Title Insurance Revenue (USD Million) and Market Share (%) by Applications (2023-2030)
10.2.1 Global Title Insurance Revenue (USD Million), and Market Share (%) by Applications (2023-2030)
11 Global Title Insurance Development Regional Status and Outlook Forecast
11.1 Global Title Insurance Revenue (USD Million) By Regions (2023-2030)
11.2 North America Title Insurance Revenue (USD Million) by Type, and Applications (2023-2030)
11.2.1 North America Title Insurance Revenue (USD) Million by Country (2023-2030)
11.2.2 North America Title Insurance Revenue (USD Million), by Type (2023-2030)
11.2.3 North America Title Insurance Revenue (USD Million), Market Share (%) by Applications (2023-2030)
11.3 Europe Title Insurance Revenue (USD Million), by Type, and Applications (2023-2030)
11.3.1 Europe Title Insurance Revenue (USD Million), by Country (2023-2030)
11.3.2 Europe Title Insurance Revenue (USD Million), by Type (2023-2030)
11.3.3 Europe Title Insurance Revenue (USD Million), by Applications (2023-2030)
11.4 Asia Pacific Title Insurance Revenue (USD Million) by Type, and Applications (2023-2030)
11.4.1 Asia Pacific Title Insurance Revenue (USD Million), by Country (2023-2030)
11.4.2 Asia Pacific Title Insurance Revenue (USD Million), by Type (2023-2030)
11.4.3 Asia Pacific Title Insurance Revenue (USD Million), by Applications (2023-2030)
11.5 South America Title Insurance Revenue (USD Million), by Type, and Applications (2023-2030)
11.5.1 South America Title Insurance Revenue (USD Million), by Country (2023-2030)
11.5.2 South America Title Insurance Revenue (USD Million), by Type (2023-2030)
11.5.3 South America Title Insurance Revenue (USD Million), by Applications (2023-2030)
11.6 Middle East and Africa Title Insurance Revenue (USD Million), by Type, and Applications (2023-2030)
11.6.1 Middle East and Africa Title Insurance Revenue (USD Million), by Region (2023-2030)
11.6.2 Middle East and Africa Title Insurance Revenue (USD Million), by Type (2023-2030)
11.6.3 Middle East and Africa Title Insurance Revenue (USD Million), by Applications (2023-2030)
12 Methodology and Data Sources
12.1 Methodology/Research Approach
12.1.1 Research Programs/Design
12.1.2 Market Size Estimation
12.1.3 Market Breakdown and Data Triangulation
12.2 Data Sources
12.2.1 Secondary Sources
12.2.2 Primary Sources
12.3 Disclaimer
List of Tables
Table 1 Market Segmentation Analysis
Table 2 Global Title Insurance Market Companies with Areas Served
Table 3 Products Offerings Global Title Insurance Market
Table 4 Low Growth Scenario Forecasts
Table 5 Reference Case Growth Scenario
Table 6 High Growth Case Scenario
Table 7 Global Title Insurance Revenue (USD Million) And CAGR (%) By Type (2018-2030)
Table 8 Global Title Insurance Revenue (USD Million) And CAGR (%) By Applications (2018-2030)
Table 9 Global Title Insurance Revenue (USD Million) And CAGR (%) By Regions (2018-2030)
Table 10 Global Title Insurance Revenue (USD Million) By Type (2018-2022)
Table 11 Global Title Insurance Revenue Market Share (%) By Type (2018-2022)
Table 12 Global Title Insurance Revenue (USD Million) By Applications (2018-2022)
Table 13 Global Title Insurance Revenue Market Share (%) By Applications (2018-2022)
Table 14 Global Title Insurance Market Revenue (USD Million) By Regions (2018-2022)
Table 15 Global Title Insurance Market Share (%) By Regions (2018-2022)
Table 16 North America Title Insurance Revenue (USD Million) By Country (2018-2022)
Table 17 North America Title Insurance Revenue (USD Million) By Type (2018-2022)
Table 18 North America Title Insurance Revenue (USD Million) By Applications (2018-2022)
Table 19 Europe Title Insurance Revenue (USD Million) By Country (2018-2022)
Table 20 Europe Title Insurance Revenue (USD Million) By Type (2018-2022)
Table 21 Europe Title Insurance Revenue (USD Million) By Applications (2018-2022)
Table 22 Asia Pacific Title Insurance Revenue (USD Million) By Country (2018-2022)
Table 23 Asia Pacific Title Insurance Revenue (USD Million) By Type (2018-2022)
Table 24 Asia Pacific Title Insurance Revenue (USD Million) By Applications (2018-2022)
Table 25 South America Title Insurance Revenue (USD Million) By Country (2018-2022)
Table 26 South America Title Insurance Revenue (USD Million) By Type (2018-2022)
Table 27 South America Title Insurance Revenue (USD Million) By Applications (2018-2022)
Table 28 Middle East and Africa Title Insurance Revenue (USD Million) By Region (2018-2022)
Table 29 Middle East and Africa Title Insurance Revenue (USD Million) By Type (2018-2022)
Table 30 Middle East and Africa Title Insurance Revenue (USD Million) By Applications (2018-2022)
Table 31 Financial Analysis
Table 32 Global Title Insurance Revenue (USD Million) By Type (2023-2030)
Table 33 Global Title Insurance Revenue Market Share (%) By Type (2023-2030)
Table 34 Global Title Insurance Revenue (USD Million) By Applications (2023-2030)
Table 35 Global Title Insurance Revenue Market Share (%) By Applications (2023-2030)
Table 36 Global Title Insurance Market Revenue (USD Million), And Revenue (USD Million) By Regions (2023-2030)
Table 37 North America Title Insurance Revenue (USD)By Country (2023-2030)
Table 38 North America Title Insurance Revenue (USD Million) By Type (2023-2030)
Table 39 North America Title Insurance Revenue (USD Million) By Applications (2023-2030)
Table 40 Europe Title Insurance Revenue (USD Million) By Country (2023-2030)
Table 41 Europe Title Insurance Revenue (USD Million) By Type (2023-2030)
Table 42 Europe Title Insurance Revenue (USD Million) By Applications (2023-2030)
Table 43 Asia Pacific Title Insurance Revenue (USD Million) By Country (2023-2030)
Table 44 Asia Pacific Title Insurance Revenue (USD Million) By Type (2023-2030)
Table 45 Asia Pacific Title Insurance Revenue (USD Million) By Applications (2023-2030)
Table 46 South America Title Insurance Revenue (USD Million) By Country (2023-2030)
Table 47 South America Title Insurance Revenue (USD Million) By Type (2023-2030)
Table 48 South America Title Insurance Revenue (USD Million) By Applications (2023-2030)
Table 49 Middle East and Africa Title Insurance Revenue (USD Million) By Region (2023-2030)
Table 50 Middle East and Africa Title Insurance Revenue (USD Million) By Region (2023-2030)
Table 51 Middle East and Africa Title Insurance Revenue (USD Million) By Type (2023-2030)
Table 52 Middle East and Africa Title Insurance Revenue (USD Million) By Applications (2023-2030)
Table 53 Research Programs/Design for This Report
Table 54 Key Data Information from Secondary Sources
Table 55 Key Data Information from Primary Sources
List of Figures
Figure 1 Market Scope
Figure 2 Porter’s Five Forces
Figure 3 Global Title Insurance Revenue (USD Million) By Type (2018-2022)
Figure 4 Global Title Insurance Revenue Market Share (%) By Type (2022)
Figure 5 Global Title Insurance Revenue (USD Million) By Applications (2018-2022)
Figure 6 Global Title Insurance Revenue Market Share (%) By Applications (2022)
Figure 7 Global Title Insurance Market Revenue (USD Million) By Regions (2018-2022)
Figure 8 Global Title Insurance Market Share (%) By Regions (2022)
Figure 9 North America Title Insurance Revenue (USD Million) By Country (2018-2022)
Figure 10 North America Title Insurance Revenue (USD Million) By Type (2018-2022)
Figure 11 North America Title Insurance Revenue (USD Million) By Applications (2018-2022)
Figure 12 Europe Title Insurance Revenue (USD Million) By Country (2018-2022)
Figure 13 Europe Title Insurance Revenue (USD Million) By Type (2018-2022)
Figure 14 Europe Title Insurance Revenue (USD Million) By Applications (2018-2022)
Figure 15 Asia Pacific Title Insurance Revenue (USD Million) By Country (2018-2022)
Figure 16 Asia Pacific Title Insurance Revenue (USD Million) By Type (2018-2022)
Figure 17 Asia Pacific Title Insurance Revenue (USD Million) By Applications (2018-2022)
Figure 18 South America Title Insurance Revenue (USD Million) By Country (2018-2022)
Figure 19 South America Title Insurance Revenue (USD Million) By Type (2018-2022)
Figure 20 South America Title Insurance Revenue (USD Million) By Applications (2018-2022)
Figure 21 Middle East and Africa Title Insurance Revenue (USD Million) By Region (2018-2022)
Figure 22 Middle East and Africa Title Insurance Revenue (USD Million) By Type (2018-2022)
Figure 23 Middle East and Africa Title Insurance Revenue (USD Million) By Applications (2018-2022)
Figure 24 Global Title Insurance Revenue (USD Million) By Type (2023-2030)
Figure 25 Global Title Insurance Revenue Market Share (%) By Type (2030)
Figure 26 Global Title Insurance Revenue (USD Million) By Applications (2023-2030)
Figure 27 Global Title Insurance Revenue Market Share (%) By Applications (2030)
Figure 28 Global Title Insurance Market Revenue (USD Million) By Regions (2023-2030)
Figure 29 North America Title Insurance Revenue (USD Million) By Country (2023-2030)
Figure 30 North America Title Insurance Revenue (USD Million) By Type (2023-2030)
Figure 31 North America Title Insurance Revenue (USD Million) By Applications (2023-2030)
Figure 32 Europe Title Insurance Revenue (USD Million) By Country (2023-2030)
Figure 33 Europe Title Insurance Revenue (USD Million) By Type (2023-2030)
Figure 34 Europe Title Insurance Revenue (USD Million) By Applications (2023-2030)
Figure 35 Asia Pacific Title Insurance Revenue (USD Million) By Country (2023-2030)
Figure 36 Asia Pacific Title Insurance Revenue (USD Million) By Type (2023-2030)
Figure 37 Asia Pacific Title Insurance Revenue (USD Million) By Applications (2023-2030)
Figure 38 South America Title Insurance Revenue (USD Million) By Country (2023-2030)
Figure 39 South America Title Insurance Revenue (USD Million) By Type (2023-2030)
Figure 40 South America Title Insurance Revenue (USD Million) By Applications (2023-2030)
Figure 41 Middle East and Africa Title Insurance Revenue (USD Million) By Region (2023-2030)
Figure 42 Middle East and Africa Title Insurance Revenue (USD Million) By Region (2023-2030)
Figure 43 Middle East and Africa Title Insurance Revenue (USD Million) By Type (2023-2030)
Figure 44 Middle East and Africa Title Insurance Revenue (USD Million) By Applications (2023-2030)
Figure 45 Bottom-Up and Top-Down Approaches For This Report
Figure 46 Data Triangulation
