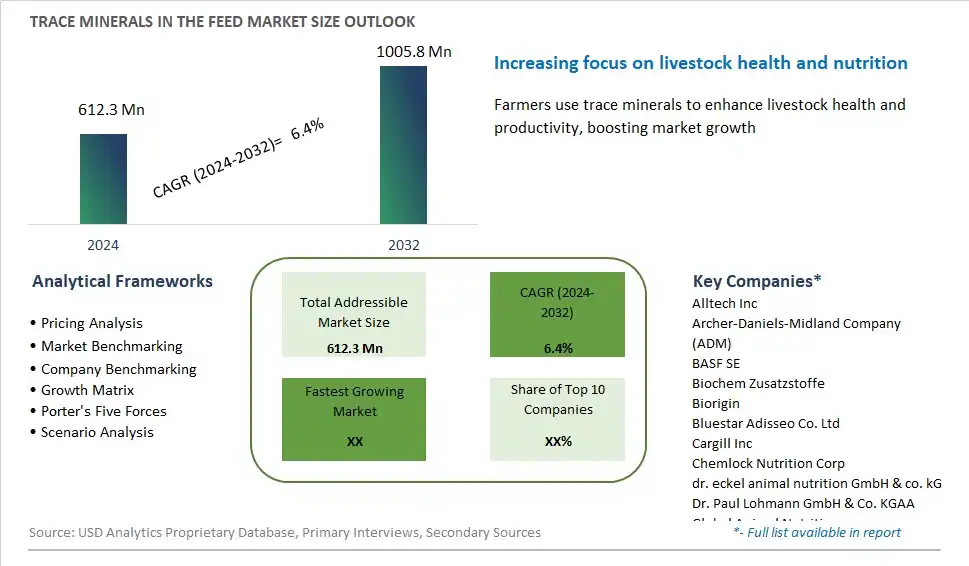
Global Trace Minerals in the Feed Market Size is valued at $612.3 Million in 2024 and is forecast to register a growth rate (CAGR) of 6.4% to reach $1005.8 Million by 2032.
The global Trace Minerals in the Feed Market Comprehensive Study analyzes and forecasts the market size across 6 regions and 24 countries for diverse segments -By Type (Zinc, Copper, Cobalt, Manganese, Iron, Chromium, Others), By Livestock (Poultry, Ruminant, Swine, Aquaculture, Others), By Chelate Type (Amino Acids, Proteinates, Polysaccharides, Others), By Form (Dry, Liquid)
An Introduction to Trace Minerals in the Feed Market
The Trace Minerals in the Feed Market involves the production and sale of mineral supplements used in animal feed to support growth, reproduction, and overall health. These minerals include zinc, copper, iron, and manganese. The market is driven by the increasing demand for high-quality animal protein, rising awareness about animal nutrition, and advancements in feed formulation. Additionally, the growth of the livestock and poultry industry and the expansion of aquaculture operations contribute to market growth.
Trace Minerals In Feed Competitive Landscape
The market report analyses the leading companies in the industry including Alltech Inc, Archer-Daniels-Midland Company (ADM), BASF SE, Biochem Zusatzstoffe, Biorigin, Bluestar Adisseo Co. Ltd, Cargill Inc, Chemlock Nutrition Corp, dr. eckel animal nutrition GmbH & co. kG, Dr. Paul Lohmann GmbH & Co. KGAA, Global Animal Nutrition, Green Mountain Nutritional Services Inc, JH Biotech Inc, Kemin Industries Inc, Koninklijke DSM N.V., Lallemand Inc, Novus International, Nutreco N.V., Orffa, QualiTech Inc, Tanke, Veterinary Professional Services Ltd (Vetpro), Vetline, Virbac, Zinpro, and Others.
Trace Minerals In Feed Market Dynamics
Market Trend: Increasing Use of Organic Trace Minerals
The most prominent trend in the Trace Minerals in the Feed Market is the increasing use of organic trace minerals. As the focus on animal health and nutrition intensifies, there is a growing preference for organic trace minerals, which are more bioavailable and have a lower environmental impact compared to inorganic minerals. This trend is driven by the desire to improve animal performance, enhance feed efficiency, and reduce the excretion of minerals into the environment. The use of organic trace minerals is gaining traction as farmers and feed manufacturers seek to optimize animal nutrition and sustainability
Market Driver: Demand for High-Quality Animal Products
The demand for high-quality animal products is a major driver of the Trace Minerals in the Feed Market. As consumer preferences shift towards meat, dairy, and eggs that are produced with high standards of animal welfare and nutrition, there is an increasing emphasis on providing animals with optimal nutrition. Trace minerals play a crucial role in supporting various physiological functions and enhancing overall animal health. The growing consumer demand for premium animal products is driving the adoption of trace minerals in animal feed
Market Opportunity: Innovation in Trace Mineral Formulations
A significant opportunity in the Trace Minerals in the Feed Market lies in innovation in trace mineral formulations. As research on animal nutrition advances, there is potential for the development of new and improved trace mineral supplements that offer enhanced bioavailability and targeted benefits. By exploring novel delivery systems, such as encapsulation and chelation, companies can create more effective and efficient trace mineral products. This innovation can help improve animal health and performance, driving market growth and differentiation
Trace Minerals in the Feed Market Share Analysis: Type (Zinc, Copper, Cobalt, Manganese, Iron, Chromium, Others)
The zinc segment is anticipated to be the fastest-growing in the Trace Minerals in the Feed Market by type to 2032. Zinc is an essential trace mineral that plays a critical role in various biological functions, including immune system support, enzyme activation, and protein synthesis. The demand for zinc in animal feed is driven by the increasing awareness of its health benefits and the need to improve animal growth, productivity, and disease resistance. Additionally, advancements in feed formulation and the inclusion of high-quality zinc supplements enhance the nutritional profile of animal feed, further boosting the demand for zinc. The expansion of the livestock and aquaculture industries supports the growth of the zinc segment.
Trace Minerals in the Feed Market Share Analysis: Livestock (Poultry, Ruminant, Swine, Aquaculture, Others)
The aquaculture segment is expected to be the fastest-growing in the Trace Minerals in the Feed Market by livestock to 2032. The demand for trace minerals in aquaculture feed is driven by the rapid growth of the aquaculture industry, which is essential to meet the increasing global demand for seafood. Trace minerals are critical for the health and growth of farmed fish and other aquatic species, as they support various physiological functions and improve feed efficiency. Additionally, the rising awareness of the nutritional benefits of trace minerals and the need to enhance the sustainability and productivity of aquaculture operations contribute to the segment's rapid growth. The expansion of the aquaculture industry and the increasing use of trace minerals in feed formulations support the growth of this segment.
Trace Minerals in the Feed Market Share Analysis: Chelate Type (Amino Acids, Proteinates, Polysaccharides, Others)
The amino acids segment is projected to be the fastest-growing in the Trace Minerals in the Feed Market by chelate type to 2032. Amino acid chelates offer several advantages, including improved bioavailability, enhanced absorption, and reduced antagonistic interactions with other minerals. The demand for amino acid chelates is driven by the increasing focus on improving animal nutrition and feed efficiency. Additionally, advancements in chelation technology and the development of high-quality amino acid chelates contribute to the segment's rapid growth. The expanding use of amino acid chelates in various feed formulations, including poultry, swine, ruminant, and aquaculture feeds, supports the growth of this segment.
Trace Minerals in the Feed Market Share Analysis: Form (Dry, Liquid)
The liquid segment is anticipated to be the fastest-growing in the Trace Minerals in the Feed Market by form to 2032. Liquid trace minerals offer several advantages, including ease of mixing, uniform distribution, and improved stability, making them a preferred choice for animal feed formulations. The demand for liquid trace minerals is driven by the increasing focus on precision feeding and the need for accurate and consistent mineral supplementation. Additionally, the rising adoption of automated feeding systems and advancements in liquid mineral formulations contribute to the segment's rapid growth. The expansion of the livestock and aquaculture industries and the increasing use of liquid trace minerals in feed formulations support the growth of this segment.
Trace Minerals In Feed Market Segmentation
By Type
Zinc
Copper
Cobalt
Manganese
Iron
Chromium
Others
By Livestock
Poultry
Ruminant
Swine
Aquaculture
Others
By Chelate Type
Amino Acids
Proteinates
Polysaccharides
Others
By Form
Dry
Liquid
Countries Analyzed
North America (US, Canada, Mexico)
Europe (Germany, UK, France, Spain, Italy, Russia, Rest of Europe)
Asia Pacific (China, India, Japan, South Korea, Australia, South East Asia, Rest of Asia)
South America (Brazil, Argentina, Rest of South America)
Middle East and Africa (Saudi Arabia, UAE, Rest of Middle East, South Africa, Egypt, Rest of Africa)
Trace Minerals In Feed Companies Profiled in the Study
Alltech Inc
Archer-Daniels-Midland Company (ADM)
BASF SE
Biochem Zusatzstoffe
Biorigin
Bluestar Adisseo Co. Ltd
Cargill Inc
Chemlock Nutrition Corp
dr. eckel animal nutrition GmbH & co. kG
Dr. Paul Lohmann GmbH & Co. KGAA
Global Animal Nutrition
Green Mountain Nutritional Services Inc
JH Biotech Inc
Kemin Industries Inc
Koninklijke DSM N.V.
Lallemand Inc
Novus International
Nutreco N.V.
Orffa
QualiTech Inc
Tanke
Veterinary Professional Services Ltd (Vetpro)
Vetline
Virbac
Zinpro
*- List Not Exhaustive
Chapter 1. TABLE OF CONTENTS
Chapter 2. Introduction to Trace Minerals In Feed Market
2.1. Market Overview
2.2. Key Statistics and Report Highlights
2.3. Scope of the Comprehensive Study
2.3.1. Market Definition
2.3.2 Countries and Regions Covered
2.3.3 Research Objective
2.3.4 Units, Currency, and Conversions
2.3.5 Industry Value Chain
2.4. Key Market Segments
2.5. Key Companies
2.6. Study Period
Chapter 3. Strategic Analysis Review
3.1. Trace Minerals In Feed Pricing Analysis and Forecast
3.2. Porter’s Five Forces
3.3. Market Ecosystem
3.4. SWOT Analysis
3.5. Regulatory Scenario
3.3. Effects of Inflation, Russia-Ukraine War, moderating economic growth, and other macroeconomic factors
Chapter 4. Competitive Landscape
4.1. Market Share Analysis
4.1.1. Global Trace Minerals In Feed Market Share by Company, 2023
4.1.2. Product Offerings of Leading Trace Minerals In Feed Companies
4.2. Market Entropy
4.2.1. New Product Launches in the Industry
4.2.2. Mergers, Acquisitions, Joint ventures, and Partnerships
4.3. Key Strategies and Best Practices
Chapter 5. Global Market Projections: Best, Reference, and Low Case Scenarios
5.1. Growth Analysis- Case Scenario Definitions
5.2. Low Growth Case Scenario Forecasts
5.3. Reference Growth Case Scenario Forecasts
5.4. High Growth Case Scenario Forecasts
Chapter 6. Market Dynamics
6.1. Trace Minerals In Feed Market Drivers
6.2. Trace Minerals In Feed Market Challenges
6.6. Trace Minerals In Feed Market Opportunities
6.4. Trace Minerals In Feed Market Trends
Chapter 7. Global Trace Minerals In Feed Market Outlook Trends
7.1. Global Trace Minerals In Feed Revenue (USD Million) and CAGR (%) by Type (2021-2032)
7.2. Global Trace Minerals In Feed Revenue (USD Million) and CAGR (%) by Application (2021-2032)
7.3. Global Trace Minerals In Feed Revenue (USD Million) and CAGR (%) by Product (2021-2032)
By Type
Zinc
Copper
Cobalt
Manganese
Iron
Chromium
Others
By Livestock
Poultry
Ruminant
Swine
Aquaculture
Others
By Chelate Type
Amino Acids
Proteinates
Polysaccharides
Others
By Form
Dry
Liquid
Chapter 8. Global Trace Minerals In Feed Regional Analysis and Outlook
8.1. Global Trace Minerals In Feed Revenue (USD Million) By Regions (2021- 2032)
8.2. North America Trace Minerals In Feed Revenue (USD Million) by Country (2021-2032)
8.2.1. United States Trace Minerals In Feed Regional Analysis and Outlook
8.2.2. Canada Trace Minerals In Feed Regional Analysis and Outlook
8.2.3. Mexico Trace Minerals In Feed Regional Analysis and Outlook
8.3. Europe Trace Minerals In Feed Revenue (USD Million), by Country (2021-2032)
8.3.1. Germany Trace Minerals In Feed Regional Analysis and Outlook
8.3.2. France Trace Minerals In Feed Regional Analysis and Outlook
8.3.3. United Kingdom Trace Minerals In Feed Regional Analysis and Outlook
8.3.4. Spain Trace Minerals In Feed Regional Analysis and Outlook
8.3.5. Italy Trace Minerals In Feed Regional Analysis and Outlook
8.3.6. Russia Trace Minerals In Feed Regional Analysis and Outlook
8.3.7. Rest of Europe Trace Minerals In Feed Regional Analysis and Outlook
8.4. Asia Pacific Trace Minerals In Feed Revenue (USD Million) by Country (2021-2032)
8.4.1. China Trace Minerals In Feed Regional Analysis and Outlook
8.4.2. Japan Trace Minerals In Feed Regional Analysis and Outlook
8.4.3. India Trace Minerals In Feed Regional Analysis and Outlook
8.4.4. South Korea Trace Minerals In Feed Regional Analysis and Outlook
8.4.5. Australia Trace Minerals In Feed Regional Analysis and Outlook
8.4.6. South East Asia Trace Minerals In Feed Regional Analysis and Outlook
8.4.7. Rest of Asia Pacific Trace Minerals In Feed Regional Analysis and Outlook
8.5. South America Trace Minerals In Feed Revenue (USD Million), by Country (2021-2032)
8.5.1. Brazil Trace Minerals In Feed Regional Analysis and Outlook
8.5.2. Argentina Trace Minerals In Feed Regional Analysis and Outlook
8.5.3. Rest of South America Trace Minerals In Feed Regional Analysis and Outlook
8.6. Middle East and Africa Trace Minerals In Feed Revenue (USD Million) by Country (2021-2032)
8.6.1. Middle East Trace Minerals In Feed Regional Analysis and Outlook
8.6.2. Africa Trace Minerals In Feed Regional Analysis and Outlook
Chapter 9. North America Trace Minerals In Feed Analysis and Outlook
9.1. North America Trace Minerals In Feed Revenue (USD Million) by Segments (2021-2032)
9.1.1. North America Trace Minerals In Feed Revenue (USD Million) by Type (2021-2032)
9.1.2. North America Trace Minerals In Feed Revenue (USD Million) by Application (2021-2032)
9.1.3. North America Trace Minerals In Feed Revenue (USD Million) by Product (2021-2032)
By Type
Zinc
Copper
Cobalt
Manganese
Iron
Chromium
Others
By Livestock
Poultry
Ruminant
Swine
Aquaculture
Others
By Chelate Type
Amino Acids
Proteinates
Polysaccharides
Others
By Form
Dry
Liquid
Chapter 10. Europe Trace Minerals In Feed Analysis and Outlook
10.1. Europe Trace Minerals In Feed Revenue (USD Million), by Segments (USD Million) (2021-2032)
10.1.1. Europe Trace Minerals In Feed Revenue (USD Million) by Type (2021-2032)
10.1.2. Europe Trace Minerals In Feed Revenue (USD Million) by Application (2021-2032)
10.1.3. Europe Trace Minerals In Feed Revenue (USD Million) by Product (2021-2032)
By Type
Zinc
Copper
Cobalt
Manganese
Iron
Chromium
Others
By Livestock
Poultry
Ruminant
Swine
Aquaculture
Others
By Chelate Type
Amino Acids
Proteinates
Polysaccharides
Others
By Form
Dry
Liquid
Chapter 11. Asia Pacific Trace Minerals In Feed Analysis and Outlook
11.1. Asia Pacific Trace Minerals In Feed Revenue (USD Million), and Revenue (USD Million) by Segments (2021-2032)
11.1.1. Asia Pacific Trace Minerals In Feed Revenue (USD Million) by Type (2021-2032)
11.1.2. Asia Pacific Trace Minerals In Feed Revenue (USD Million) by Application (2021-2032)
11.1.3. Asia Pacific Trace Minerals In Feed Revenue (USD Million) by Product (2021-2032)
By Type
Zinc
Copper
Cobalt
Manganese
Iron
Chromium
Others
By Livestock
Poultry
Ruminant
Swine
Aquaculture
Others
By Chelate Type
Amino Acids
Proteinates
Polysaccharides
Others
By Form
Dry
Liquid
Chapter 12. South America Trace Minerals In Feed Analysis and Outlook
12.1. South America Trace Minerals In Feed Revenue (USD Million), by Segments (2021-2032)
12.1.1. South America Trace Minerals In Feed Revenue (USD Million) by Type (2021-2032)
12.1.2. South America Trace Minerals In Feed Revenue (USD Million) by Application (2021-2032)
12.1.3. South America Trace Minerals In Feed Revenue (USD Million) by Product (2021-2032)
By Type
Zinc
Copper
Cobalt
Manganese
Iron
Chromium
Others
By Livestock
Poultry
Ruminant
Swine
Aquaculture
Others
By Chelate Type
Amino Acids
Proteinates
Polysaccharides
Others
By Form
Dry
Liquid
Chapter 13. Middle East and Africa Trace Minerals In Feed Analysis and Outlook
13.1. Middle East and Africa Trace Minerals In Feed Revenue (USD Million), by Segments (2021-2032)
13.1.1. Middle East and Africa Trace Minerals In Feed Revenue (USD Million) by Type (2021-2032)
13.1.2. Middle East and Africa Trace Minerals In Feed Revenue (USD Million) by Application (2021-2032)
13.1.3. Middle East and Africa Trace Minerals In Feed Revenue (USD Million) by Product (2021-2032)
By Type
Zinc
Copper
Cobalt
Manganese
Iron
Chromium
Others
By Livestock
Poultry
Ruminant
Swine
Aquaculture
Others
By Chelate Type
Amino Acids
Proteinates
Polysaccharides
Others
By Form
Dry
Liquid
Chapter 14. Trace Minerals In Feed Company Profiles
14.1 Business Overview
14.2 Product Profiles
14.3 SWOT Profiles
14.5 Recent Developments
14.6 Financial Profile
List of Companies
Alltech Inc
Archer-Daniels-Midland Company (ADM)
BASF SE
Biochem Zusatzstoffe
Biorigin
Bluestar Adisseo Co. Ltd
Cargill Inc
Chemlock Nutrition Corp
dr. eckel animal nutrition GmbH & co. kG
Dr. Paul Lohmann GmbH & Co. KGAA
Global Animal Nutrition
Green Mountain Nutritional Services Inc
JH Biotech Inc
Kemin Industries Inc
Koninklijke DSM N.V.
Lallemand Inc
Novus International
Nutreco N.V.
Orffa
QualiTech Inc
Tanke
Veterinary Professional Services Ltd (Vetpro)
Vetline
Virbac
Zinpro
15. Methodology and Data Sources
15.1 Customization Offerings
15.2 Subscription Services
15.3 Related Reports
15.4 Publisher Expertise
LIST OF TABLES
Table 1 Market Segmentation Analysis
Table 2 Global Trace Minerals In Feed Market Share of Leading Companies, 2023
Table 3 Product Offerings of Leading Companies
Table 4 Low Growth Scenario Forecasts
Table 5 Reference Case Growth Scenario
Table 6 High Growth Case Scenario
Table 7 Global Trace Minerals In Feed Revenue (USD Million) And CAGR (%) By Type (2021-2032)
Table 8 Global Trace Minerals In Feed Revenue (USD Million) And CAGR (%) By Application (2021-2032)
Table 9 Global Trace Minerals In Feed Revenue (USD Million) And CAGR (%) By Product (2021-2032)
Table 10 Global Trace Minerals In Feed Market Revenue (USD Million) By Regions (2021-2032)
Table 11 Global Trace Minerals In Feed Market Share (%) By Regions (2021-2032)
Table 12 North America Trace Minerals In Feed Revenue (USD Million) By Country (2021-2032)
Table 13 Europe Trace Minerals In Feed Revenue (USD Million) By Country (2021-2032)
Table 14 Asia Pacific Trace Minerals In Feed Revenue (USD Million) By Country (2021-2032)
Table 15 South America Trace Minerals In Feed Revenue (USD Million) By Country (2021-2032)
Table 16 Middle East and Africa Trace Minerals In Feed Revenue (USD Million) By Region (2021-2032)
Table 17 North America Trace Minerals In Feed Revenue (USD Million) By Type (2021-2032)
Table 18 North America Trace Minerals In Feed Revenue (USD Million) By Application (2021-2032)
Table 19 North America Trace Minerals In Feed Revenue (USD Million) By Product (2021-2032)
Table 20 Europe Trace Minerals In Feed Revenue (USD Million) By Type (2021-2032)
Table 21 Europe Trace Minerals In Feed Revenue (USD Million) By Application (2021-2032)
Table 22 Europe Trace Minerals In Feed Revenue (USD Million) By Product (2021-2032)
Table 23 Asia Pacific Trace Minerals In Feed Revenue (USD Million) By Type (2021-2032)
Table 24 Asia Pacific Trace Minerals In Feed Revenue (USD Million) By Application (2021-2032)
Table 25 Asia Pacific Trace Minerals In Feed Revenue (USD Million) By Product (2021-2032)
Table 26 South America Trace Minerals In Feed Revenue (USD Million) By Type (2021-2032)
Table 27 South America Trace Minerals In Feed Revenue (USD Million) By Application (2021-2032)
Table 28 South America Trace Minerals In Feed Revenue (USD Million) By Product (2021-2032)
Table 29 Middle East and Africa Trace Minerals In Feed Revenue (USD Million) By Type (2021-2032)
Table 30 Middle East and Africa Trace Minerals In Feed Revenue (USD Million) By Application (2021-2032)
Table 31 Middle East and Africa Trace Minerals In Feed Revenue (USD Million) By Product (2021-2032)
LIST OF FIGURES
Figure 1. Market Scope
Figure 2. Pricing Forecasts Per Unit, 2023- 2032
Figure 3. Porter’s Five Forces
Figure 4. Global Trace Minerals In Feed Market Revenue (USD Million) By Regions (2021-2032)
Figure 5. Global Trace Minerals In Feed Market Share (%) By Regions (2023)
Figure 6. North America Trace Minerals In Feed Revenue (USD Million) By Country (2021-2032)
Figure 7. United States Trace Minerals In Feed Revenue (USD Million) By Country (2021-2032)
Figure 8. Canada Trace Minerals In Feed Revenue (USD Million) By Country (2021-2032)
Figure 9. Mexico Trace Minerals In Feed Revenue (USD Million) By Country (2021-2032)
Figure 10. Europe Trace Minerals In Feed Revenue (USD Million) By Country (2021-2032)
Figure 11. Germany Trace Minerals In Feed Revenue (USD Million) By Country (2021-2032)
Figure 12. France Trace Minerals In Feed Revenue (USD Million) By Country (2021-2032)
Figure 13. United Kingdom Trace Minerals In Feed Revenue (USD Million) By Country (2021-2032)
Figure 14. Spain Trace Minerals In Feed Revenue (USD Million) By Country (2021-2032)
Figure 15. Italy Trace Minerals In Feed Revenue (USD Million) By Country (2021-2032)
Figure 16. Russia Trace Minerals In Feed Revenue (USD Million) By Country (2021-2032)
Figure 17. Rest of Europe Trace Minerals In Feed Revenue (USD Million) By Country (2021-2032)
Figure 11. Asia Pacific Trace Minerals In Feed Revenue (USD Million) By Country (2021-2032)
Figure 12. China Trace Minerals In Feed Revenue (USD Million) By Country (2021-2032)
Figure 13. Japan Trace Minerals In Feed Revenue (USD Million) By Country (2021-2032)
Figure 14. India Trace Minerals In Feed Revenue (USD Million) By Country (2021-2032)
Figure 15. South Korea Trace Minerals In Feed Revenue (USD Million) By Country (2021-2032)
Figure 16. Australia Trace Minerals In Feed Revenue (USD Million) By Country (2021-2032)
Figure 17. South East Asia Trace Minerals In Feed Revenue (USD Million) By Country (2021-2032)
Figure 18. South America Trace Minerals In Feed Revenue (USD Million) By Country (2021-2032)
Figure 19. Brazil Trace Minerals In Feed Revenue (USD Million) By Country (2021-2032)
Figure 20. Argentina Trace Minerals In Feed Revenue (USD Million) By Country (2021-2032)
Figure 21. Rest of Asia Pacific Trace Minerals In Feed Revenue (USD Million) By Country (2021-2032)
Figure 22. Middle East and Africa Trace Minerals In Feed Revenue (USD Million) By Region (2021-2032)
Figure 23. Saudi Arabia Trace Minerals In Feed Revenue (USD Million) By Region (2021-2032)
Figure 24. The UAE Trace Minerals In Feed Revenue (USD Million) By Region (2021-2032)
Figure 25. Rest of Middle East Trace Minerals In Feed Revenue (USD Million) By Region (2021-2032)
Figure 26. South Africa Trace Minerals In Feed Revenue (USD Million) By Region (2021-2032)
Figure 27. Africa Trace Minerals In Feed Revenue (USD Million) By Region (2021-2032)
Figure 28. North America Trace Minerals In Feed Revenue (USD Million) By Type (2021-2032)
Figure 29. North America Trace Minerals In Feed Revenue (USD Million) By Application (2021-2032)
Figure 30. North America Trace Minerals In Feed Revenue (USD Million) By Product (2021-2032)
Figure 31. Europe Trace Minerals In Feed Revenue (USD Million) By Type (2021-2032)
Figure 32. Europe Trace Minerals In Feed Revenue (USD Million) By Application (2021-2032)
Figure 33. Europe Trace Minerals In Feed Revenue (USD Million) By Product (2021-2032)
Figure 34. Asia Pacific Trace Minerals In Feed Revenue (USD Million) By Type (2021-2032)
Figure 35. Asia Pacific Trace Minerals In Feed Revenue (USD Million) By Application (2021-2032)
Figure 36. Asia Pacific Trace Minerals In Feed Revenue (USD Million) By Product (2021-2032)
Figure 37. South America Trace Minerals In Feed Revenue (USD Million) By Type (2021-2032)
Figure 38. South America Trace Minerals In Feed Revenue (USD Million) By Application (2021-2032)
Figure 39. South America Trace Minerals In Feed Revenue (USD Million) By Product (2021-2032)
Figure 40. Middle East and Africa Trace Minerals In Feed Revenue (USD Million) By Type (2021-2032)
Figure 41. Middle East and Africa Trace Minerals In Feed Revenue (USD Million) By Application (2021-2032)
Figure 42. Middle East and Africa Trace Minerals In Feed Revenue (USD Million) By Product (2021-2032)
By Type
Zinc
Copper
Cobalt
Manganese
Iron
Chromium
Others
By Livestock
Poultry
Ruminant
Swine
Aquaculture
Others
By Chelate Type
Amino Acids
Proteinates
Polysaccharides
Others
By Form
Dry
Liquid
Countries Analyzed
North America (US, Canada, Mexico)
Europe (Germany, UK, France, Spain, Italy, Russia, Rest of Europe)
Asia Pacific (China, India, Japan, South Korea, Australia, South East Asia, Rest of Asia)
South America (Brazil, Argentina, Rest of South America)
Middle East and Africa (Saudi Arabia, UAE, Rest of Middle East, South Africa, Egypt, Rest of Africa)
