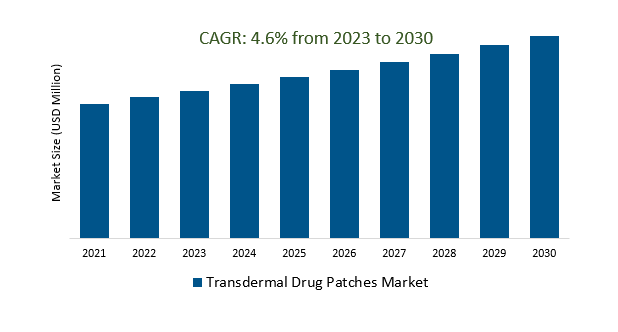
The Global Transdermal Drug Patches Market Size is estimated to register 4.6% growth over the forecast period from 2023 to 2030.
The market growth is driven by an increasing incidence of chronic diseases such as diabetes, hypertension, and chronic pain is driving the demand for transdermal drug patches as an effective and convenient treatment option. Leading Companies focusing on Expanding Indications, Personalized Medicine, Pediatric and Geriatric Applications, Oncology, Regulatory Support, and others to boost market shares in the industry.
Market Overview
The Transdermal Drug Patches Market is a rapidly growing sector within the pharmaceutical industry, offering non-invasive, controlled drug delivery through the skin. These patches are favored for their advantages, including steady drug release, patient compliance, and reduced side effects. They find applications in various therapeutic areas, such as pain management, hormone replacement therapy, and cardiovascular diseases. Key market players include Mylan, Novartis, and Johnson & Johnson. With emerging technologies and regulatory oversight, the market is poised for future growth, driven by expanding indications, personalized medicine, and the integration of wearable technology. The market dynamics vary by region, with North America, Europe, and Asia-Pacific being major players.
Market Dynamics
Market Trends- The increasing opioid epidemic is driving demand for transdermal drug patches, as they offer a safer and more effective way to deliver pain medication.
The escalating opioid epidemic is fueling a growing demand for transdermal drug patches, driven by the urgent need for safer and more effective pain medication delivery. These patches provide a crucial solution to the crisis, offering a controlled, non-invasive method of administering opioid pain relief. By eliminating the risks associated with oral opioids, such as abuse, addiction, and overdose, transdermal patches enhance patient safety while ensuring a steady and manageable release of pain medication.
Market Driver- Wearable technology integration is driving demand for transdermal drug patches, as it allows for more precise and personalized drug delivery.
The integration of wearable technology is a pivotal driver of demand within the Transdermal Drug Patches Market. By enabling the incorporation of sensors and connectivity features, wearable technology enhances the precision and personalization of drug delivery through transdermal patches. This innovation not only facilitates real-time monitoring of patient health status but also empowers healthcare providers to fine-tune treatment regimens for individual patients, ensuring optimal therapeutic outcomes.
Market Opportunity- FDA support is helping to accelerate the development and approval of new transdermal drug patches, driving growth in the market.
Strong FDA support is acting as a catalyst for the rapid evolution of the Transdermal Drug Patches Market. The regulatory backing provided by the FDA is expediting the research, development, and approval processes for innovative transdermal drug patches, thereby fueling remarkable growth within the market. This collaborative partnership between the industry and regulatory authority is streamlining the introduction of safer, more effective drug delivery solutions, creating an environment of innovation, and ultimately enhancing patient care.
Market Share Analysis- Fentanyl Transdermal Patch Transdermal Drug Patches Market will register the fastest growth
The Global Transdermal Drug Patches Market is analyzed across Fentanyl Transdermal Patch, Nicotine Transdermal Patch, Buprenorphine Transdermal Patch, Clonidine Transdermal Patch, Oxybutynin Transdermal Patch, and others. Fentanyl Transdermal Patch is poised to register the fastest growth. Fentanyl transdermal patches are a significant component of the broader Transdermal Drug Patches Market, designed for controlled, long-term release of the opioid medication, fentanyl, to manage chronic pain, particularly in cancer patients. They play a crucial role in addressing the need for safer and more effective pain management, contributing to the overall growth of the market.
Market Share Analysis- Analgesia held a significant market share in 2023
The Global Transdermal Drug Patches Market is analyzed across various Organizations including Hypertension, Contraception, Analgesia, Smoking Cessation, Angina, Hormone Replacement, and others. Of these, Analgesia held a significant market share in 2023. Analgesia transdermal drug patches, a vital segment of the Transdermal Drug Patches Market, are designed for controlled and continuous pain relief through skin-based drug delivery. These patches target various pain types, ensuring non-invasive and effective pain management. Within the broader market, they cater to the rising demand for pain relief, with an emphasis on minimizing side effects and enhancing patient compliance.
Transdermal Drug Patches Market Segmentation
By Type
- Fentanyl Transdermal Patch
- Nicotine Transdermal Patch
- Buprenorphine Transdermal Patch
- Clonidine Transdermal Patch
- Oxybutynin Transdermal Patch
By Application
- Hypertension
- Contraception
- Analgesia
- Smoking Cessation
- Angina
- Hormone Replacement
By Region
- North America (United States, Canada, Mexico)
- Europe (Germany, France, United Kingdom, Spain, Italy, Others)
- Asia Pacific (China, India, Japan, South Korea, Australia, Others)
- Latin America (Brazil, Argentina, Others)
- Middle East and Africa (Saudi Arabia, UAE, Kuwait, Other Middle East, South Africa, Nigeria, Other Africa)
Transdermal Drug Patches Market Companies
- Agile Therapeutics
- Mylan
- Novartis
- Johnson & Johnson
- Teikoku Pharma USA
- Noven
- Immune Pharmaceuticals
- Xel Pharmaceuticals
- Hercon Pharmaceuticals
- Pocono
- DURECT Corporation
*List not exhaustive
Transdermal Drug Patches Market Outlook 2023
1 Market Overview
1.1 Introduction to the Transdermal Drug Patches Market
1.2 Scope of the Study
1.3 Research Objective
1.3.1 Key Market Scope and Segments
1.3.2 Players Covered
1.3.3 Years Considered
2 Executive Summary
2.1 2023 Transdermal Drug Patches Industry- Market Statistics
3 Market Dynamics
3.1 Market Drivers
3.2 Market Challenges
3.3 Market Opportunities
3.4 Market Trends
4 Market Factor Analysis
4.1 Porter’s Five Forces
4.2 Market Entropy
4.2.1 Global Transdermal Drug Patches Market Companies with Area Served
4.2.2 Products Offerings Global Transdermal Drug Patches Market
5 COVID-19 Impact Analysis and Outlook Scenarios
5.1.1 Covid-19 Impact Analysis
5.1.2 Post-COVID-19 Scenario- Low Growth Case
5.1.3 Post-COVID-19 Scenario- Reference Growth Case
5.1.4 Post-COVID-19 Scenario- Low Growth Case
6 Global Transdermal Drug Patches Market Trends
6.1 Global Transdermal Drug Patches Revenue (USD Million) and CAGR (%) by Type (2018-2030)
6.2 Global Transdermal Drug Patches Revenue (USD Million) and CAGR (%) by Applications (2018-2030)
6.3 Global Transdermal Drug Patches Revenue (USD Million) and CAGR (%) by Regions (2018-2030)
7 Global Transdermal Drug Patches Market Revenue (USD Million) by Type, and Applications (2018-2022)
7.1 Global Transdermal Drug Patches Revenue (USD Million) by Type (2018-2022)
7.1.1 Global Transdermal Drug Patches Revenue (USD Million), Market Share (%) by Type (2018-2022)
7.2 Global Transdermal Drug Patches Revenue (USD Million) by Applications (2018-2022)
7.2.1 Global Transdermal Drug Patches Revenue (USD Million), Market Share (%) by Applications (2018-2022)
8 Global Transdermal Drug Patches Development Regional Status and Outlook
8.1 Global Transdermal Drug Patches Revenue (USD Million) By Regions (2018-2022)
8.2 North America Transdermal Drug Patches Revenue (USD Million) by Type, and Application (2018-2022)
8.2.1 North America Transdermal Drug Patches Revenue (USD Million) by Country (2018-2022)
8.2.2 North America Transdermal Drug Patches Revenue (USD Million) by Type (2018-2022)
8.2.3 North America Transdermal Drug Patches Revenue (USD Million) by Applications (2018-2022)
8.3 Europe Transdermal Drug Patches Revenue (USD Million), by Type, and Applications (USD Million) (2018-2022)
8.3.1 Europe Transdermal Drug Patches Revenue (USD Million), by Country (2018-2022)
8.3.2 Europe Transdermal Drug Patches Revenue (USD Million) by Type (2018-2022)
8.3.3 Europe Transdermal Drug Patches Revenue (USD Million) by Applications (2018-2022)
8.4 Asia Pacific Transdermal Drug Patches Revenue (USD Million), and Revenue (USD Million) by Type, and Applications (2018-2022)
8.4.1 Asia Pacific Transdermal Drug Patches Revenue (USD Million) by Country (2018-2022)
8.4.2 Asia Pacific Transdermal Drug Patches Revenue (USD Million) by Type (2018-2022)
8.4.3 Asia Pacific Transdermal Drug Patches Revenue (USD Million) by Applications (2018-2022)
8.5 South America Transdermal Drug Patches Revenue (USD Million), by Type, and Applications (2018-2022)
8.5.1 South America Transdermal Drug Patches Revenue (USD Million), by Country (2018-2022)
8.5.2 South America Transdermal Drug Patches Revenue (USD Million) by Type (2018-2022)
8.5.3 South America Transdermal Drug Patches Revenue (USD Million) by Applications (2018-2022)
8.6 Middle East and Africa Transdermal Drug Patches Revenue (USD Million), by Type, Technology, Application, Thickness (2018-2022)
8.6.1 Middle East and Africa Transdermal Drug Patches Revenue (USD Million) by Country (2018-2022)
8.6.2 Middle East and Africa Transdermal Drug Patches Revenue (USD Million) by Type (2018-2022)
8.6.3 Middle East and Africa Transdermal Drug Patches Revenue (USD Million) by Applications (2018-2022)
9 Company Profiles
10 Global Transdermal Drug Patches Market Revenue (USD Million), by Type, and Applications (2023-2030)
10.1 Global Transdermal Drug Patches Revenue (USD Million) and Market Share (%) by Type (2023-2030)
10.1.1 Global Transdermal Drug Patches Revenue (USD Million), and Market Share (%) by Type (2023-2030)
10.2 Global Transdermal Drug Patches Revenue (USD Million) and Market Share (%) by Applications (2023-2030)
10.2.1 Global Transdermal Drug Patches Revenue (USD Million), and Market Share (%) by Applications (2023-2030)
11 Global Transdermal Drug Patches Development Regional Status and Outlook Forecast
11.1 Global Transdermal Drug Patches Revenue (USD Million) By Regions (2023-2030)
11.2 North America Transdermal Drug Patches Revenue (USD Million) by Type, and Applications (2023-2030)
11.2.1 North America Transdermal Drug Patches Revenue (USD) Million by Country (2023-2030)
11.2.2 North America Transdermal Drug Patches Revenue (USD Million), by Type (2023-2030)
11.2.3 North America Transdermal Drug Patches Revenue (USD Million), Market Share (%) by Applications (2023-2030)
11.3 Europe Transdermal Drug Patches Revenue (USD Million), by Type, and Applications (2023-2030)
11.3.1 Europe Transdermal Drug Patches Revenue (USD Million), by Country (2023-2030)
11.3.2 Europe Transdermal Drug Patches Revenue (USD Million), by Type (2023-2030)
11.3.3 Europe Transdermal Drug Patches Revenue (USD Million), by Applications (2023-2030)
11.4 Asia Pacific Transdermal Drug Patches Revenue (USD Million) by Type, and Applications (2023-2030)
11.4.1 Asia Pacific Transdermal Drug Patches Revenue (USD Million), by Country (2023-2030)
11.4.2 Asia Pacific Transdermal Drug Patches Revenue (USD Million), by Type (2023-2030)
11.4.3 Asia Pacific Transdermal Drug Patches Revenue (USD Million), by Applications (2023-2030)
11.5 South America Transdermal Drug Patches Revenue (USD Million), by Type, and Applications (2023-2030)
11.5.1 South America Transdermal Drug Patches Revenue (USD Million), by Country (2023-2030)
11.5.2 South America Transdermal Drug Patches Revenue (USD Million), by Type (2023-2030)
11.5.3 South America Transdermal Drug Patches Revenue (USD Million), by Applications (2023-2030)
11.6 Middle East and Africa Transdermal Drug Patches Revenue (USD Million), by Type, and Applications (2023-2030)
11.6.1 Middle East and Africa Transdermal Drug Patches Revenue (USD Million), by Region (2023-2030)
11.6.2 Middle East and Africa Transdermal Drug Patches Revenue (USD Million), by Type (2023-2030)
11.6.3 Middle East and Africa Transdermal Drug Patches Revenue (USD Million), by Applications (2023-2030)
12 Methodology and Data Sources
12.1 Methodology/Research Approach
12.1.1 Research Programs/Design
12.1.2 Market Size Estimation
12.1.3 Market Breakdown and Data Triangulation
12.2 Data Sources
12.2.1 Secondary Sources
12.2.2 Primary Sources
12.3 Disclaimer
List of Tables
Table 1 Market Segmentation Analysis
Table 2 Global Transdermal Drug Patches Market Companies with Areas Served
Table 3 Products Offerings Global Transdermal Drug Patches Market
Table 4 Low Growth Scenario Forecasts
Table 5 Reference Case Growth Scenario
Table 6 High Growth Case Scenario
Table 7 Global Transdermal Drug Patches Revenue (USD Million) And CAGR (%) By Type (2018-2030)
Table 8 Global Transdermal Drug Patches Revenue (USD Million) And CAGR (%) By Applications (2018-2030)
Table 9 Global Transdermal Drug Patches Revenue (USD Million) And CAGR (%) By Regions (2018-2030)
Table 10 Global Transdermal Drug Patches Revenue (USD Million) By Type (2018-2022)
Table 11 Global Transdermal Drug Patches Revenue Market Share (%) By Type (2018-2022)
Table 12 Global Transdermal Drug Patches Revenue (USD Million) By Applications (2018-2022)
Table 13 Global Transdermal Drug Patches Revenue Market Share (%) By Applications (2018-2022)
Table 14 Global Transdermal Drug Patches Market Revenue (USD Million) By Regions (2018-2022)
Table 15 Global Transdermal Drug Patches Market Share (%) By Regions (2018-2022)
Table 16 North America Transdermal Drug Patches Revenue (USD Million) By Country (2018-2022)
Table 17 North America Transdermal Drug Patches Revenue (USD Million) By Type (2018-2022)
Table 18 North America Transdermal Drug Patches Revenue (USD Million) By Applications (2018-2022)
Table 19 Europe Transdermal Drug Patches Revenue (USD Million) By Country (2018-2022)
Table 20 Europe Transdermal Drug Patches Revenue (USD Million) By Type (2018-2022)
Table 21 Europe Transdermal Drug Patches Revenue (USD Million) By Applications (2018-2022)
Table 22 Asia Pacific Transdermal Drug Patches Revenue (USD Million) By Country (2018-2022)
Table 23 Asia Pacific Transdermal Drug Patches Revenue (USD Million) By Type (2018-2022)
Table 24 Asia Pacific Transdermal Drug Patches Revenue (USD Million) By Applications (2018-2022)
Table 25 South America Transdermal Drug Patches Revenue (USD Million) By Country (2018-2022)
Table 26 South America Transdermal Drug Patches Revenue (USD Million) By Type (2018-2022)
Table 27 South America Transdermal Drug Patches Revenue (USD Million) By Applications (2018-2022)
Table 28 Middle East and Africa Transdermal Drug Patches Revenue (USD Million) By Region (2018-2022)
Table 29 Middle East and Africa Transdermal Drug Patches Revenue (USD Million) By Type (2018-2022)
Table 30 Middle East and Africa Transdermal Drug Patches Revenue (USD Million) By Applications (2018-2022)
Table 31 Financial Analysis
Table 32 Global Transdermal Drug Patches Revenue (USD Million) By Type (2023-2030)
Table 33 Global Transdermal Drug Patches Revenue Market Share (%) By Type (2023-2030)
Table 34 Global Transdermal Drug Patches Revenue (USD Million) By Applications (2023-2030)
Table 35 Global Transdermal Drug Patches Revenue Market Share (%) By Applications (2023-2030)
Table 36 Global Transdermal Drug Patches Market Revenue (USD Million), And Revenue (USD Million) By Regions (2023-2030)
Table 37 North America Transdermal Drug Patches Revenue (USD)By Country (2023-2030)
Table 38 North America Transdermal Drug Patches Revenue (USD Million) By Type (2023-2030)
Table 39 North America Transdermal Drug Patches Revenue (USD Million) By Applications (2023-2030)
Table 40 Europe Transdermal Drug Patches Revenue (USD Million) By Country (2023-2030)
Table 41 Europe Transdermal Drug Patches Revenue (USD Million) By Type (2023-2030)
Table 42 Europe Transdermal Drug Patches Revenue (USD Million) By Applications (2023-2030)
Table 43 Asia Pacific Transdermal Drug Patches Revenue (USD Million) By Country (2023-2030)
Table 44 Asia Pacific Transdermal Drug Patches Revenue (USD Million) By Type (2023-2030)
Table 45 Asia Pacific Transdermal Drug Patches Revenue (USD Million) By Applications (2023-2030)
Table 46 South America Transdermal Drug Patches Revenue (USD Million) By Country (2023-2030)
Table 47 South America Transdermal Drug Patches Revenue (USD Million) By Type (2023-2030)
Table 48 South America Transdermal Drug Patches Revenue (USD Million) By Applications (2023-2030)
Table 49 Middle East and Africa Transdermal Drug Patches Revenue (USD Million) By Region (2023-2030)
Table 50 Middle East and Africa Transdermal Drug Patches Revenue (USD Million) By Region (2023-2030)
Table 51 Middle East and Africa Transdermal Drug Patches Revenue (USD Million) By Type (2023-2030)
Table 52 Middle East and Africa Transdermal Drug Patches Revenue (USD Million) By Applications (2023-2030)
Table 53 Research Programs/Design for This Report
Table 54 Key Data Information from Secondary Sources
Table 55 Key Data Information from Primary Sources
List of Figures
Figure 1 Market Scope
Figure 2 Porter’s Five Forces
Figure 3 Global Transdermal Drug Patches Revenue (USD Million) By Type (2018-2022)
Figure 4 Global Transdermal Drug Patches Revenue Market Share (%) By Type (2022)
Figure 5 Global Transdermal Drug Patches Revenue (USD Million) By Applications (2018-2022)
Figure 6 Global Transdermal Drug Patches Revenue Market Share (%) By Applications (2022)
Figure 7 Global Transdermal Drug Patches Market Revenue (USD Million) By Regions (2018-2022)
Figure 8 Global Transdermal Drug Patches Market Share (%) By Regions (2022)
Figure 9 North America Transdermal Drug Patches Revenue (USD Million) By Country (2018-2022)
Figure 10 North America Transdermal Drug Patches Revenue (USD Million) By Type (2018-2022)
Figure 11 North America Transdermal Drug Patches Revenue (USD Million) By Applications (2018-2022)
Figure 12 Europe Transdermal Drug Patches Revenue (USD Million) By Country (2018-2022)
Figure 13 Europe Transdermal Drug Patches Revenue (USD Million) By Type (2018-2022)
Figure 14 Europe Transdermal Drug Patches Revenue (USD Million) By Applications (2018-2022)
Figure 15 Asia Pacific Transdermal Drug Patches Revenue (USD Million) By Country (2018-2022)
Figure 16 Asia Pacific Transdermal Drug Patches Revenue (USD Million) By Type (2018-2022)
Figure 17 Asia Pacific Transdermal Drug Patches Revenue (USD Million) By Applications (2018-2022)
Figure 18 South America Transdermal Drug Patches Revenue (USD Million) By Country (2018-2022)
Figure 19 South America Transdermal Drug Patches Revenue (USD Million) By Type (2018-2022)
Figure 20 South America Transdermal Drug Patches Revenue (USD Million) By Applications (2018-2022)
Figure 21 Middle East and Africa Transdermal Drug Patches Revenue (USD Million) By Region (2018-2022)
Figure 22 Middle East and Africa Transdermal Drug Patches Revenue (USD Million) By Type (2018-2022)
Figure 23 Middle East and Africa Transdermal Drug Patches Revenue (USD Million) By Applications (2018-2022)
Figure 24 Global Transdermal Drug Patches Revenue (USD Million) By Type (2023-2030)
Figure 25 Global Transdermal Drug Patches Revenue Market Share (%) By Type (2030)
Figure 26 Global Transdermal Drug Patches Revenue (USD Million) By Applications (2023-2030)
Figure 27 Global Transdermal Drug Patches Revenue Market Share (%) By Applications (2030)
Figure 28 Global Transdermal Drug Patches Market Revenue (USD Million) By Regions (2023-2030)
Figure 29 North America Transdermal Drug Patches Revenue (USD Million) By Country (2023-2030)
Figure 30 North America Transdermal Drug Patches Revenue (USD Million) By Type (2023-2030)
Figure 31 North America Transdermal Drug Patches Revenue (USD Million) By Applications (2023-2030)
Figure 32 Europe Transdermal Drug Patches Revenue (USD Million) By Country (2023-2030)
Figure 33 Europe Transdermal Drug Patches Revenue (USD Million) By Type (2023-2030)
Figure 34 Europe Transdermal Drug Patches Revenue (USD Million) By Applications (2023-2030)
Figure 35 Asia Pacific Transdermal Drug Patches Revenue (USD Million) By Country (2023-2030)
Figure 36 Asia Pacific Transdermal Drug Patches Revenue (USD Million) By Type (2023-2030)
Figure 37 Asia Pacific Transdermal Drug Patches Revenue (USD Million) By Applications (2023-2030)
Figure 38 South America Transdermal Drug Patches Revenue (USD Million) By Country (2023-2030)
Figure 39 South America Transdermal Drug Patches Revenue (USD Million) By Type (2023-2030)
Figure 40 South America Transdermal Drug Patches Revenue (USD Million) By Applications (2023-2030)
Figure 41 Middle East and Africa Transdermal Drug Patches Revenue (USD Million) By Region (2023-2030)
Figure 42 Middle East and Africa Transdermal Drug Patches Revenue (USD Million) By Region (2023-2030)
Figure 43 Middle East and Africa Transdermal Drug Patches Revenue (USD Million) By Type (2023-2030)
Figure 44 Middle East and Africa Transdermal Drug Patches Revenue (USD Million) By Applications (2023-2030)
Figure 45 Bottom-Up and Top-Down Approaches For This Report
Figure 46 Data Triangulation
