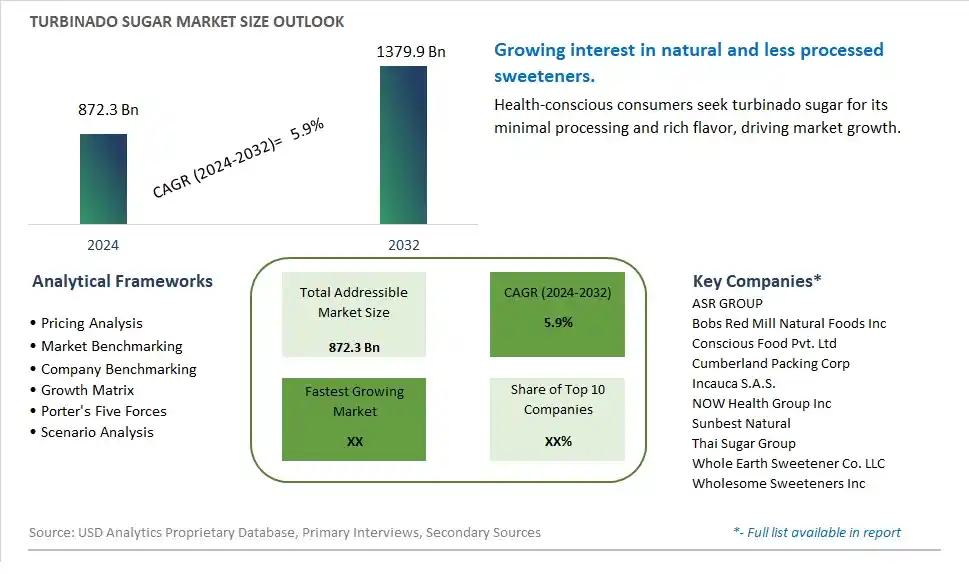
Global Turbinado Sugar Market Size is valued at $872.3 Billion in 2024 and is forecast to register a growth rate (CAGR) of 5.9% to reach $1379.9 Billion by 2032.
The global Turbinado Sugar Market Comprehensive Study analyzes and forecasts the market size across 6 regions and 24 countries for diverse segments -By Product (Regular Turbinado Sugar, Turbinado Sugar Cubes, Others), By End-User (Foodservice, Packaged Food, Beverage Manufacturers, Retail)
An Introduction to Turbinado Sugar Market
Turbinado sugar, also known as raw cane sugar, occupies a niche market segment in 2024, characterized by its natural sweetness, distinctive flavor, and perceived health benefits. Produced by evaporating cane juice and crystallizing it without further refinement, turbinado sugar retains some of the natural molasses and minerals found in sugarcane, imparting a light caramel flavor and golden color. This minimal processing appeals to health-conscious consumers seeking alternatives to refined white sugar, as turbinado sugar is often perceived as less processed and more natural. Additionally, its coarse texture and subtle molasses taste make it an ideal sweetener for beverages, baked goods, and desserts. With growing consumer demand for natural and unprocessed ingredients, turbinado sugar continues to gain popularity as a premium sugar alternative in specialty markets and health food stores, driving market growth and product innovation.
Turbinado Sugar Competitive Landscape
The market report analyses the leading companies in the industry including ASR GROUP, Bobs Red Mill Natural Foods Inc, Conscious Food Pvt. Ltd, Cumberland Packing Corp, Incauca S.A.S., NOW Health Group Inc, Sunbest Natural, Thai Sugar Group, Whole Earth Sweetener Co. LLC, Wholesome Sweeteners Inc, and Others.
Turbinado Sugar Market Dynamics
Turbinado Sugar Market Trend: Growing Demand for Natural and Less Processed Sweeteners
One prominent market trend in the turbinado sugar industry is the growing demand for natural and less processed sweeteners, driven by increasing consumer preference for healthier and more wholesome food options. Turbinado sugar, also known as raw sugar, is minimally processed and retains more of its natural molasses content compared to refined sugars, offering a slightly richer flavor profile and subtle caramel notes. With rising awareness about the adverse health effects of excessive sugar consumption and the desire for clean label products, consumers are seeking alternatives to highly processed sweeteners like white sugar and high-fructose corn syrup. As a result, turbinado sugar has gained popularity as a natural and more authentic sweetening option, fueling its demand across various food and beverage applications.
Market Driver: Growing Interest in Specialty and Artisanal Food Products
A key market driver for turbinado sugar is the growing interest in specialty and artisanal food products, driven by consumers' desire for unique flavor experiences and high-quality ingredients. Turbinado sugar's distinct flavor profile and less refined nature make it an attractive choice for food manufacturers, bakeries, and artisanal producers looking to differentiate their products and appeal to discerning consumers. As the demand for premium and gourmet food products continues to rise, driven by factors such as food exploration, culinary innovation, and premiumization trends, turbinado sugar offers a versatile ingredient that enhances the taste and texture of various sweet and savory dishes. This growing interest in specialty and artisanal food products presents opportunities for turbinado sugar suppliers and producers to cater to the evolving preferences of consumers and food industry professionals.
Market Opportunity: Expansion of Turbinado Sugar in Health and Wellness Segments
An opportunity for the turbinado sugar market lies in its expansion into the health and wellness segments, driven by its perceived naturalness and potential health benefits compared to refined sugars. While turbinado sugar is still a form of sugar and should be consumed in moderation, its less processed nature and higher molasses content may offer some nutritional advantages, such as trace minerals and antioxidants. With the increasing focus on holistic health, clean eating, and ingredient transparency, there is growing interest in incorporating turbinado sugar into health-conscious products, such as natural snacks, granolas, energy bars, and functional beverages. By positioning turbinado sugar as a more wholesome sweetening option in the health and wellness market, producers can tap into new consumer segments and capitalize on the growing demand for natural and minimally processed food ingredients.
Turbinado Sugar Market Share Analysis: Regular Turbinado Sugar held the dominant market share in 2024
In the Turbinado Sugar Market segmented by products, the Regular Turbinado Sugar category is the largest segment. This dominance is primarily due to the widespread use and versatility of regular turbinado sugar in various culinary applications. Regular turbinado sugar, also known as raw sugar, retains some of the natural molasses content and light brown color from the sugarcane juice during the refining process, imparting a distinct flavor profile to baked goods, beverages, and desserts. Its coarse texture and subtle caramel notes make it a preferred choice for adding sweetness and depth to dishes. Additionally, regular turbinado sugar is widely available and more affordable compared to specialty varieties like turbinado sugar cubes, catering to a broader consumer base. The familiarity and accessibility of regular turbinado sugar contribute to its prominence as the largest segment in the turbinado sugar market, as consumers continue to incorporate it into their culinary creations for its unique taste and texture.
Turbinado Sugar Market Share Analysis: Packaged Food market is poised to register the fastest growth rae over the forecast period to 2032
In the Turbinado Sugar Market segmented by end-users, the Packaged Food category is the fastest-growing segment. This accelerated growth is primarily driven by the increasing demand for natural and minimally processed ingredients in packaged food products. Packaged food manufacturers are increasingly incorporating turbinado sugar into their formulations as a healthier alternative to refined sugars, catering to consumer preferences for clean label products with recognizable and natural ingredients. Turbinado sugar's light caramel flavor and golden hue enhance the taste and visual appeal of packaged foods such as breakfast cereals, granola bars, cookies, and snacks. Further, the rising consumer awareness of the health risks associated with excessive sugar consumption prompts manufacturers to reformulate their products with less processed sweeteners, driving the demand for turbinado sugar in the packaged food industry. As a result, suppliers and producers are scaling up production to meet the growing demand from packaged food manufacturers, fueling the rapid expansion of this segment in the turbinado sugar market.
Turbinado Sugar Market Segmentation
By Product
Regular Turbinado Sugar
Turbinado Sugar Cubes
Others
By End-User
Foodservice
Packaged Food
Beverage Manufacturers
Retail
Countries Analyzed
North America (US, Canada, Mexico)
Europe (Germany, UK, France, Spain, Italy, Russia, Rest of Europe)
Asia Pacific (China, India, Japan, South Korea, Australia, South East Asia, Rest of Asia)
South America (Brazil, Argentina, Rest of South America)
Middle East and Africa (Saudi Arabia, UAE, Rest of Middle East, South Africa, Egypt, Rest of Africa)
Turbinado Sugar Companies Profiled in the Study
ASR GROUP
Bobs Red Mill Natural Foods Inc
Conscious Food Pvt. Ltd
Cumberland Packing Corp
Incauca S.A.S.
NOW Health Group Inc
Sunbest Natural
Thai Sugar Group
Whole Earth Sweetener Co. LLC
Wholesome Sweeteners Inc
*- List Not Exhaustive
Chapter 1. TABLE OF CONTENTS
Chapter 2. Introduction to Turbinado Sugar Market
2.1. Market Overview
2.2. Key Statistics and Report Highlights
2.3. Scope of the Comprehensive Study
2.3.1. Market Definition
2.3.2 Countries and Regions Covered
2.3.3 Research Objective
2.3.4 Units, Currency, and Conversions
2.3.5 Industry Value Chain
2.4. Key Market Segments
2.5. Key Companies
2.6. Study Period
Chapter 3. Strategic Analysis Review
3.1. Turbinado Sugar Pricing Analysis and Forecast
3.2. Porter’s Five Forces
3.3. Market Ecosystem
3.4. SWOT Analysis
3.5. Regulatory Scenario
3.3. Effects of Inflation, Russia-Ukraine War, moderating economic growth, and other macroeconomic factors
Chapter 4. Competitive Landscape
4.1. Market Share Analysis
4.1.1. Global Turbinado Sugar Market Share by Company, 2023
4.1.2. Product Offerings of Leading Turbinado Sugar Companies
4.2. Market Entropy
4.2.1. New Product Launches in the Industry
4.2.2. Mergers, Acquisitions, Joint ventures, and Partnerships
4.3. Key Strategies and Best Practices
Chapter 5. Global Market Projections: Best, Reference, and Low Case Scenarios
5.1. Growth Analysis- Case Scenario Definitions
5.2. Low Growth Case Scenario Forecasts
5.3. Reference Growth Case Scenario Forecasts
5.4. High Growth Case Scenario Forecasts
Chapter 6. Market Dynamics
6.1. Turbinado Sugar Market Drivers
6.2. Turbinado Sugar Market Challenges
6.6. Turbinado Sugar Market Opportunities
6.4. Turbinado Sugar Market Trends
Chapter 7. Global Turbinado Sugar Market Outlook Trends
7.1. Global Turbinado Sugar Revenue (USD Million) and CAGR (%) by Type (2021-2032)
7.2. Global Turbinado Sugar Revenue (USD Million) and CAGR (%) by Application (2021-2032)
7.3. Global Turbinado Sugar Revenue (USD Million) and CAGR (%) by Product (2021-2032)
By Product
Regular Turbinado Sugar
Turbinado Sugar Cubes
Others
By End-User
Foodservice
Packaged Food
Beverage Manufacturers
Retail
Chapter 8. Global Turbinado Sugar Regional Analysis and Outlook
8.1. Global Turbinado Sugar Revenue (USD Million) By Regions (2021- 2032)
8.2. North America Turbinado Sugar Revenue (USD Million) by Country (2021-2032)
8.2.1. United States Turbinado Sugar Regional Analysis and Outlook
8.2.2. Canada Turbinado Sugar Regional Analysis and Outlook
8.2.3. Mexico Turbinado Sugar Regional Analysis and Outlook
8.3. Europe Turbinado Sugar Revenue (USD Million), by Country (2021-2032)
8.3.1. Germany Turbinado Sugar Regional Analysis and Outlook
8.3.2. France Turbinado Sugar Regional Analysis and Outlook
8.3.3. United Kingdom Turbinado Sugar Regional Analysis and Outlook
8.3.4. Spain Turbinado Sugar Regional Analysis and Outlook
8.3.5. Italy Turbinado Sugar Regional Analysis and Outlook
8.3.6. Russia Turbinado Sugar Regional Analysis and Outlook
8.3.7. Rest of Europe Turbinado Sugar Regional Analysis and Outlook
8.4. Asia Pacific Turbinado Sugar Revenue (USD Million) by Country (2021-2032)
8.4.1. China Turbinado Sugar Regional Analysis and Outlook
8.4.2. Japan Turbinado Sugar Regional Analysis and Outlook
8.4.3. India Turbinado Sugar Regional Analysis and Outlook
8.4.4. South Korea Turbinado Sugar Regional Analysis and Outlook
8.4.5. Australia Turbinado Sugar Regional Analysis and Outlook
8.4.6. South East Asia Turbinado Sugar Regional Analysis and Outlook
8.4.7. Rest of Asia Pacific Turbinado Sugar Regional Analysis and Outlook
8.5. South America Turbinado Sugar Revenue (USD Million), by Country (2021-2032)
8.5.1. Brazil Turbinado Sugar Regional Analysis and Outlook
8.5.2. Argentina Turbinado Sugar Regional Analysis and Outlook
8.5.3. Rest of South America Turbinado Sugar Regional Analysis and Outlook
8.6. Middle East and Africa Turbinado Sugar Revenue (USD Million) by Country (2021-2032)
8.6.1. Middle East Turbinado Sugar Regional Analysis and Outlook
8.6.2. Africa Turbinado Sugar Regional Analysis and Outlook
Chapter 9. North America Turbinado Sugar Analysis and Outlook
9.1. North America Turbinado Sugar Revenue (USD Million) by Segments (2021-2032)
9.1.1. North America Turbinado Sugar Revenue (USD Million) by Type (2021-2032)
9.1.2. North America Turbinado Sugar Revenue (USD Million) by Application (2021-2032)
9.1.3. North America Turbinado Sugar Revenue (USD Million) by Product (2021-2032)
By Product
Regular Turbinado Sugar
Turbinado Sugar Cubes
Others
By End-User
Foodservice
Packaged Food
Beverage Manufacturers
Retail
Chapter 10. Europe Turbinado Sugar Analysis and Outlook
10.1. Europe Turbinado Sugar Revenue (USD Million), by Segments (USD Million) (2021-2032)
10.1.1. Europe Turbinado Sugar Revenue (USD Million) by Type (2021-2032)
10.1.2. Europe Turbinado Sugar Revenue (USD Million) by Application (2021-2032)
10.1.3. Europe Turbinado Sugar Revenue (USD Million) by Product (2021-2032)
By Product
Regular Turbinado Sugar
Turbinado Sugar Cubes
Others
By End-User
Foodservice
Packaged Food
Beverage Manufacturers
Retail
Chapter 11. Asia Pacific Turbinado Sugar Analysis and Outlook
11.1. Asia Pacific Turbinado Sugar Revenue (USD Million), and Revenue (USD Million) by Segments (2021-2032)
11.1.1. Asia Pacific Turbinado Sugar Revenue (USD Million) by Type (2021-2032)
11.1.2. Asia Pacific Turbinado Sugar Revenue (USD Million) by Application (2021-2032)
11.1.3. Asia Pacific Turbinado Sugar Revenue (USD Million) by Product (2021-2032)
By Product
Regular Turbinado Sugar
Turbinado Sugar Cubes
Others
By End-User
Foodservice
Packaged Food
Beverage Manufacturers
Retail
Chapter 12. South America Turbinado Sugar Analysis and Outlook
12.1. South America Turbinado Sugar Revenue (USD Million), by Segments (2021-2032)
12.1.1. South America Turbinado Sugar Revenue (USD Million) by Type (2021-2032)
12.1.2. South America Turbinado Sugar Revenue (USD Million) by Application (2021-2032)
12.1.3. South America Turbinado Sugar Revenue (USD Million) by Product (2021-2032)
By Product
Regular Turbinado Sugar
Turbinado Sugar Cubes
Others
By End-User
Foodservice
Packaged Food
Beverage Manufacturers
Retail
Chapter 13. Middle East and Africa Turbinado Sugar Analysis and Outlook
13.1. Middle East and Africa Turbinado Sugar Revenue (USD Million), by Segments (2021-2032)
13.1.1. Middle East and Africa Turbinado Sugar Revenue (USD Million) by Type (2021-2032)
13.1.2. Middle East and Africa Turbinado Sugar Revenue (USD Million) by Application (2021-2032)
13.1.3. Middle East and Africa Turbinado Sugar Revenue (USD Million) by Product (2021-2032)
By Product
Regular Turbinado Sugar
Turbinado Sugar Cubes
Others
By End-User
Foodservice
Packaged Food
Beverage Manufacturers
Retail
Chapter 14. Turbinado Sugar Company Profiles
14.1 Business Overview
14.2 Product Profiles
14.3 SWOT Profiles
14.5 Recent Developments
14.6 Financial Profile
List of Companies
ASR GROUP
Bobs Red Mill Natural Foods Inc
Conscious Food Pvt. Ltd
Cumberland Packing Corp
Incauca S.A.S.
NOW Health Group Inc
Sunbest Natural
Thai Sugar Group
Whole Earth Sweetener Co. LLC
Wholesome Sweeteners Inc
15. Methodology and Data Sources
15.1 Customization Offerings
15.2 Subscription Services
15.3 Related Reports
15.4 Publisher Expertise
LIST OF TABLES
Table 1 Market Segmentation Analysis
Table 2 Global Turbinado Sugar Market Share of Leading Companies, 2023
Table 3 Product Offerings of Leading Companies
Table 4 Low Growth Scenario Forecasts
Table 5 Reference Case Growth Scenario
Table 6 High Growth Case Scenario
Table 7 Global Turbinado Sugar Revenue (USD Million) And CAGR (%) By Type (2021-2032)
Table 8 Global Turbinado Sugar Revenue (USD Million) And CAGR (%) By Application (2021-2032)
Table 9 Global Turbinado Sugar Revenue (USD Million) And CAGR (%) By Product (2021-2032)
Table 10 Global Turbinado Sugar Market Revenue (USD Million) By Regions (2021-2032)
Table 11 Global Turbinado Sugar Market Share (%) By Regions (2021-2032)
Table 12 North America Turbinado Sugar Revenue (USD Million) By Country (2021-2032)
Table 13 Europe Turbinado Sugar Revenue (USD Million) By Country (2021-2032)
Table 14 Asia Pacific Turbinado Sugar Revenue (USD Million) By Country (2021-2032)
Table 15 South America Turbinado Sugar Revenue (USD Million) By Country (2021-2032)
Table 16 Middle East and Africa Turbinado Sugar Revenue (USD Million) By Region (2021-2032)
Table 17 North America Turbinado Sugar Revenue (USD Million) By Type (2021-2032)
Table 18 North America Turbinado Sugar Revenue (USD Million) By Application (2021-2032)
Table 19 North America Turbinado Sugar Revenue (USD Million) By Product (2021-2032)
Table 20 Europe Turbinado Sugar Revenue (USD Million) By Type (2021-2032)
Table 21 Europe Turbinado Sugar Revenue (USD Million) By Application (2021-2032)
Table 22 Europe Turbinado Sugar Revenue (USD Million) By Product (2021-2032)
Table 23 Asia Pacific Turbinado Sugar Revenue (USD Million) By Type (2021-2032)
Table 24 Asia Pacific Turbinado Sugar Revenue (USD Million) By Application (2021-2032)
Table 25 Asia Pacific Turbinado Sugar Revenue (USD Million) By Product (2021-2032)
Table 26 South America Turbinado Sugar Revenue (USD Million) By Type (2021-2032)
Table 27 South America Turbinado Sugar Revenue (USD Million) By Application (2021-2032)
Table 28 South America Turbinado Sugar Revenue (USD Million) By Product (2021-2032)
Table 29 Middle East and Africa Turbinado Sugar Revenue (USD Million) By Type (2021-2032)
Table 30 Middle East and Africa Turbinado Sugar Revenue (USD Million) By Application (2021-2032)
Table 31 Middle East and Africa Turbinado Sugar Revenue (USD Million) By Product (2021-2032)
LIST OF FIGURES
Figure 1. Market Scope
Figure 2. Pricing Forecasts Per Unit, 2023- 2032
Figure 3. Porter’s Five Forces
Figure 4. Global Turbinado Sugar Market Revenue (USD Million) By Regions (2021-2032)
Figure 5. Global Turbinado Sugar Market Share (%) By Regions (2023)
Figure 6. North America Turbinado Sugar Revenue (USD Million) By Country (2021-2032)
Figure 7. United States Turbinado Sugar Revenue (USD Million) By Country (2021-2032)
Figure 8. Canada Turbinado Sugar Revenue (USD Million) By Country (2021-2032)
Figure 9. Mexico Turbinado Sugar Revenue (USD Million) By Country (2021-2032)
Figure 10. Europe Turbinado Sugar Revenue (USD Million) By Country (2021-2032)
Figure 11. Germany Turbinado Sugar Revenue (USD Million) By Country (2021-2032)
Figure 12. France Turbinado Sugar Revenue (USD Million) By Country (2021-2032)
Figure 13. United Kingdom Turbinado Sugar Revenue (USD Million) By Country (2021-2032)
Figure 14. Spain Turbinado Sugar Revenue (USD Million) By Country (2021-2032)
Figure 15. Italy Turbinado Sugar Revenue (USD Million) By Country (2021-2032)
Figure 16. Russia Turbinado Sugar Revenue (USD Million) By Country (2021-2032)
Figure 17. Rest of Europe Turbinado Sugar Revenue (USD Million) By Country (2021-2032)
Figure 11. Asia Pacific Turbinado Sugar Revenue (USD Million) By Country (2021-2032)
Figure 12. China Turbinado Sugar Revenue (USD Million) By Country (2021-2032)
Figure 13. Japan Turbinado Sugar Revenue (USD Million) By Country (2021-2032)
Figure 14. India Turbinado Sugar Revenue (USD Million) By Country (2021-2032)
Figure 15. South Korea Turbinado Sugar Revenue (USD Million) By Country (2021-2032)
Figure 16. Australia Turbinado Sugar Revenue (USD Million) By Country (2021-2032)
Figure 17. South East Asia Turbinado Sugar Revenue (USD Million) By Country (2021-2032)
Figure 18. South America Turbinado Sugar Revenue (USD Million) By Country (2021-2032)
Figure 19. Brazil Turbinado Sugar Revenue (USD Million) By Country (2021-2032)
Figure 20. Argentina Turbinado Sugar Revenue (USD Million) By Country (2021-2032)
Figure 21. Rest of Asia Pacific Turbinado Sugar Revenue (USD Million) By Country (2021-2032)
Figure 22. Middle East and Africa Turbinado Sugar Revenue (USD Million) By Region (2021-2032)
Figure 23. Saudi Arabia Turbinado Sugar Revenue (USD Million) By Region (2021-2032)
Figure 24. The UAE Turbinado Sugar Revenue (USD Million) By Region (2021-2032)
Figure 25. Rest of Middle East Turbinado Sugar Revenue (USD Million) By Region (2021-2032)
Figure 26. South Africa Turbinado Sugar Revenue (USD Million) By Region (2021-2032)
Figure 27. Africa Turbinado Sugar Revenue (USD Million) By Region (2021-2032)
Figure 28. North America Turbinado Sugar Revenue (USD Million) By Type (2021-2032)
Figure 29. North America Turbinado Sugar Revenue (USD Million) By Application (2021-2032)
Figure 30. North America Turbinado Sugar Revenue (USD Million) By Product (2021-2032)
Figure 31. Europe Turbinado Sugar Revenue (USD Million) By Type (2021-2032)
Figure 32. Europe Turbinado Sugar Revenue (USD Million) By Application (2021-2032)
Figure 33. Europe Turbinado Sugar Revenue (USD Million) By Product (2021-2032)
Figure 34. Asia Pacific Turbinado Sugar Revenue (USD Million) By Type (2021-2032)
Figure 35. Asia Pacific Turbinado Sugar Revenue (USD Million) By Application (2021-2032)
Figure 36. Asia Pacific Turbinado Sugar Revenue (USD Million) By Product (2021-2032)
Figure 37. South America Turbinado Sugar Revenue (USD Million) By Type (2021-2032)
Figure 38. South America Turbinado Sugar Revenue (USD Million) By Application (2021-2032)
Figure 39. South America Turbinado Sugar Revenue (USD Million) By Product (2021-2032)
Figure 40. Middle East and Africa Turbinado Sugar Revenue (USD Million) By Type (2021-2032)
Figure 41. Middle East and Africa Turbinado Sugar Revenue (USD Million) By Application (2021-2032)
Figure 42. Middle East and Africa Turbinado Sugar Revenue (USD Million) By Product (2021-2032)
By Product
Regular Turbinado Sugar
Turbinado Sugar Cubes
Others
By End-User
Foodservice
Packaged Food
Beverage Manufacturers
Retail
Countries Analyzed
North America (US, Canada, Mexico)
Europe (Germany, UK, France, Spain, Italy, Russia, Rest of Europe)
Asia Pacific (China, India, Japan, South Korea, Australia, South East Asia, Rest of Asia)
South America (Brazil, Argentina, Rest of South America)
Middle East and Africa (Saudi Arabia, UAE, Rest of Middle East, South Africa, Egypt, Rest of Africa)
